Journal List > Korean Circ J > v.49(6) > 1125472

Lee, Park, and Kim: Temporal and Geospatial Trends of Hypertension Management in Korea: a Nationwide Study 2002–2016

Abstract

Background and Objectives

Geographic distribution of hypertension management in Korea has never been reported. We investigated temporal and regional trends of hypertension management in Korea.

Methods

For each calendar year from 2002 to 2016, we identified 2,423,245 to 7,549,989 persons aged ≥30 years treated for hypertension (total 80,564,109 cases). We calculated yearly age-sex standardized rates for medication adherence, combination therapy, blood test, and urine test according to geographic regions. We then used multivariate logistic regression to calculate odds ratios for hypertension management adjusted for individual-level sociodemographic factors.

Results

Adherence rates have markedly increased from 24.4% (2002) to 71.6% (2016) nationwide. Regional difference was prominent in 2002 (highest, 31.7% in Seoul; lowest, 14.4% in Jeonbuk), but has become less noticeable over 15 years (highest, 73.1% in Daejeon; lowest, 69.0% in Jeonnam, 2016). Combination therapy rates increased from 42.8% (2002) to 61.0% (2011), but are in decreasing trend after 2011. Blood test rates were 58.8% in 2016, whereas urine test rates have been stagnant below 50% across all regions. Geographic variations of combination therapy and complication screening rates were not profound. Results from multivariable logistic regression, adjusted for age and sex, were in agreement with trends observed by standardized rates. The odds ratios remained unchanged when the models were further adjusted for employment status and household income.

Conclusions

Regional difference in hypertension management was evident in the past, but has become less apparent over the last 15 years in Korea.

INTRODUCTION

Hypertension is a major risk factor for cardiovascular morbidity and mortality worldwide.1) Although effective blood pressure (BP)-lowering medications have been developed, awareness and control for hypertension often differ by various sociodemographic factors.2)3)4) In particular, geographic variations have been reported for hypertension prevalence and management in both high- and low-resource settings.5)6)7)8)9)10) However, determinants for regional health disparity remains poorly understood.
In South Korea, National Health Insurance Service (NHIS) is the single provider of universal and compulsory healthcare coverage. Per capita doctor visits in Korea is the highest among OECD countries,11) and national health screening is widely provided, with high participation rate (77.7% in 2016).12) Therefore, health disparity in Korea is expected to be less pronounced than in other high-income countries. The Korean Society of Hypertension reported overall increasing trend of diagnosis and treatment for hypertension over the last 15 years.13) However, geographic distribution of hypertension management in Korea has never been reported. We thus investigated the temporal and geospatial pattern of hypertension management in Korea, including medication adherence, use of combination therapy, and screening tests for complication.

METHODS

Data source

We constructed a nationwide repeated cross-sectional dataset of calendar years 2002 to 2016 from the NHIS database, which includes de-identified records of the entire Korean population. NHIS offers National Health Insurance (NHI) program for 97% of the population, and Medical Aid for the remaining 3% with financial needs or under special provision (e.g., national meritorious persons). The NHIS database contains claims and diagnoses, coded with International Classification of Disease, 10th edition (ICD-10), as well as individual-level sociodemographic details, including residential area.14) The study protocol was approved by the Institutional Review Board of Severance Hospital, Yonsei University Health System, Seoul, Korea (approval No. 4-2017-0322), and the requirement for informed consent was waived.

Study population

For each calendar year, we identified all individuals, aged 30 years or more, claimed for primary hypertension (ICD-10: I10) and antihypertensive medication (Supplementary Table 1). We excluded persons with incomplete geographic, sociodemographic, or hospital information—e.g., foreigners, military personnel, Medical Aid beneficiaries, etc. The same individual could be included in multiple calendar years, but would contribute only one observation per year included. The final dataset included a total of 80,564,109 observations (2,423,245 to 7,549,989 persons in 2002 to 2016), and the population size in each calendar year are summarized in Supplementary Table 2.

Regional and sociodemographic information

There are 8 metropolitan cities (Seoul, Busan, Daegu, Incheon, Gwangju, Daejeon, Ulsan, and Sejong) and 9 provinces (Gyeonggi, Gangwon, Chungbuk, Chungnam, Jeonbuk, Jeonnam, Gyeongbuk, Gyeongnam, and Jeju) in South Korea. For analytical purpose, we merged Sejong city with Chungnam province, since Sejong was named a metropolitan city only after 2012. Seoul is the capital city; together with adjacent regions, Seoul, Incheon, and Gyeonggi are considered capital area. Metropolitan cities and provinces comprise municipal divisions: si, gun, or gu. Further submunicipal divisions include dong as a unit of urban area; and eup - myeon - ri as units of rural area. For each individual, urbanization level of residential area was categorized as metropolitan, urban, or rural according to the aforesaid regional units. Working status was categorized into either employed or self-/non-employed. As a proxy for household income, we used insurance premium, determined by salary and asset information. We classified household income into quartiles, excluding Medical Aid.

Indicators of hypertension management

Quality of hypertension management was assessed for each calendar year. We used three indicators—adherence rate, combination therapy rate, and complication screening rate—each of which was calculated as percentage among treated patients. Adherence to treatment was defined as being prescribed antihypertensive medication for ≥290 days (80%) in a given year. Presence of multiple antihypertensive classes in a single prescription was regarded as combination therapy. Identification of antihypertensive regimen, duration, and the hospital prescribing the medication followed the protocol developed for the Korea Hypertension Fact Sheet.13) Complication screening rates were calculated for blood chemistry (as serum creatinine test) and proteinuria test (as random urinalysis and/or urine microalbumin test), separately. Presence of at least one claim for a particular test was considered screened in a given year.

Statistical analysis

Population characteristics were reported as frequency and percentage, or median and interquartile range. For each calendar year, hypertension management rates were directly age-sex standardized to the 2016 population. We chose four representative years of 4- or 5-year intervals (2002, 2006, 2011, and 2016), and visualized the geographic distribution of hypertension management on a map. We then used logistic regression to calculate odds ratio (OR) and 95% confidence interval (CI), for each indicator of hypertension management, according to geographic region and urbanization level, in each representative year. Multivariable logistic model was adjusted for age, sex, employment status, and household income quartiles. All analyses were performed using SAS version 9.4 (SAS Institute Inc., Cary, NC, USA) and R version 3.4.4 (R Foundation for Statistical Computing, Vienna, Austria; http://www.R-project.org).

RESULTS

Subject characteristics

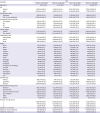
In 2002, a total of 2,423,245 individuals were treated for hypertension, and the number of treated patients gradually increased, reaching 7,549,989 in 2016 (Table 1). The proportion of male sex and employed workers among treated patients increased over time. The geographic distribution of patients remained largely unchanged, but an increasing proportion of patients living in non-metropolitan urban areas was observed. Regarding antihypertensive drug classes, the use of angiotensin II receptor blockers abruptly increased, from 12.9% in 2002 to 68.6% in 2016, while the use of beta-blockers or angiotensin-converting-enzyme (ACE) inhibitors declined over time. The percentage of dual therapy continuously increased, whereas the percentage of using 3 or more classes peaked at 2011 (20.1%) and started decreasing. The proportion of patients adherent to antihypertensive treatment was 24.3% in 2002, but markedly increased reaching 71.6% in 2016. The proportion of patients screened for complications also increased over time, although not dramatically.
Table 1

Population characteristics by calendar year

kcj-49-514-i001
Variables Year
2002 (n=2,423,245) 2006 (n=4,466,235) 2011 (n=6,155,625) 2016 (n=7,549,989)
Age, years 60 (51–68) 61 (51–69) 62 (53–71) 63 (54–73)
Sex
Female 1,418,840 (58.6) 2,436,318 (54.5) 3,200,523 (52.0) 3,764,676 (49.9)
Male 1,004,405 (41.4) 2,029,917 (45.5) 2,955,102 (48.0) 3,785,313 (50.1)
Employment status
Employed 328,602 (13.6) 724,638 (16.2) 1,256,082 (20.4) 1,888,291 (25.0)
Self- or non-employed 2,094,643 (86.4) 3,741,597 (83.8) 4,899,543 (79.6) 5,661,698 (75.0)
Household income, quartile
Q4, highest 946,513 (39.1) 1,652,681 (37.0) 2,387,228 (38.8) 2,887,231 (38.2)
Q3 575,664 (23.8) 1,112,429 (24.9) 1,503,730 (24.4) 1,816,233 (24.1)
Q2 477,076 (19.7) 862,046 (19.3) 1,112,297 (18.1) 1,387,833 (18.4)
Q1, lowest 423,992 (17.5) 839,079 (18.8) 1,152,370 (18.7) 1,458,692 (19.3)
Capital region
Capital* 1,143,339 (47.2) 2,121,397 (47.5) 2,946,116 (47.9) 3,610,290 (47.8)
Non-capital 1,279,906 (52.8) 2,344,838 (52.5) 3,209,509 (52.1) 3,939,699 (52.2)
Urbanization level
Metropolitan 1,111,036 (45.8) 1,983,742 (44.4) 2,651,916 (43.1) 3,183,798 (42.2)
Urban 727,167 (30.0) 1,386,002 (31.0) 2,005,339 (32.6) 2,577,882 (34.1)
Rural 585,042 (24.1) 1,096,491 (24.6) 1,498,370 (24.3) 1,788,309 (23.7)
Region
Seoul 538,731 (22.2) 958,766 (21.5) 1,260,692 (20.5) 1,470,947 (19.5)
Busan 187,086 (7.7) 340,847 (7.6) 443,725 (7.2) 522,213 (6.9)
Daegu 111,261 (4.6) 196,515 (4.4) 268,634 (4.4) 336,191 (4.5)
Incheon 125,777 (5.2) 229,109 (5.1) 326,459 (5.3) 415,602 (5.5)
Gwangju 59,044 (2.4) 104,185 (2.3) 140,890 (2.3) 173,855 (2.3)
Daejeon 71,918 (3.0) 123,265 (2.8) 166,826 (2.7) 201,390 (2.7)
Ulsan 42,107 (1.7) 78,888 (1.8) 117,668 (1.9) 151,734 (2.0)
Gyeonggi 478,831 (19.8) 933,522 (20.9) 1,358,965 (22.1) 1,723,741 (22.8)
Gangwon 86,182 (3.6) 169,876 (3.8) 227,098 (3.7) 277,169 (3.7)
Chungbuk 82,826 (3.4) 148,128 (3.3) 201,744 (3.3) 248,007 (3.3)
Chungnam (and Sejong) 116,110 (4.8) 218,085 (4.9) 301,572 (4.9) 377,893 (5.0)
Jeonbuk 112,747 (4.7) 193,181 (4.3) 254,919 (4.1) 314,254 (4.2)
Jeonnam 117,714 (4.9) 209,092 (4.7) 275,707 (4.5) 330,514 (4.4)
Gyeongbuk 135,450 (5.6) 259,284 (5.8) 353,878 (5.7) 441,950 (5.9)
Gyeongnam 143,600 (5.9) 272,791 (6.1) 388,109 (6.3) 475,001 (6.3)
Jeju 13,861 (0.6) 30,701 (0.7) 68,739 (1.1) 89,528 (1.2)
Hospital type
Tertiary 399,544 (16.5) 544,110 (12.2) 653,774 (10.6) 846,148 (11.2)
Secondary 352,815 (14.6) 888,229 (19.9) 1,284,624 (20.9) 1,602,524 (21.2)
Primary 1,670,886 (69.0) 3,033,896 (67.9) 4,217,227 (68.5) 5,101,317 (67.6)
Antihypertensive drug class
Diuretics 699,054 (28.8) 1,752,408 (39.2) 2,359,952 (38.3) 2,160,891 (28.6)
Beta-blockers 828,571 (34.2) 1,357,803 (30.4) 1,347,608 (21.9) 1,265,299 (16.8)
Calcium channel blockers 1,366,749 (56.4) 2,824,514 (63.2) 3,779,920 (61.4) 4,498,709 (59.6)
ACE inhibitors 436,732 (18.0) 580,556 (13.0) 335,593 (5.5) 190,856 (2.5)
ARBs 312,966 (12.9) 1,215,366 (27.2) 3,456,875 (56.2) 5,180,084 (68.6)
Others 75,861 (3.1) 60,783 (1.4) 50,451 (0.8) 40,019 (0.5)
Number of drug classes
1 1,404,024 (57.9) 2,038,863 (45.7) 2,415,293 (39.2) 3,129,778 (41.5)
2 779,480 (32.2) 1,657,480 (37.1) 2,505,277 (40.7) 3,226,128 (42.7)
≥3 239,741 (9.9) 769,892 (17.2) 1,235,055 (20.1) 1,194,083 (15.8)
Adherent to treatment 587,932 (24.3) 2,254,101 (50.5) 4,057,044 (65.9) 5,406,003 (71.6)
Tested for serum creatinine 942,122 (38.9) 2,001,078 (44.8) 3,172,014 (51.5) 4,439,896 (58.8)
Tested for proteinuria 996,133 (41.1) 1,912,225 (42.8) 2,631,028 (42.7) 3,390,150 (44.9)
Data are presented as median (interquartile range) or frequency (percent).
ACE = angiotensin-converting-enzyme; ARB = angiotensin II receptor blocker.
*Capital region includes Seoul, Incheon, and Gyeonggi; Counted with duplicates for combination therapy.

Management of hypertension by geographic region

Yearly standardized rates of adherence, combination therapy, and complication screening by capital/non-capital region or urbanization level are plotted in Figure 1. The same indicators in four representative years were map-visualized in Figure 2, and their numeric values are provided as supplements (Supplementary Tables 3, 4, 5, 6). In 2002, age-sex standardized adherence rates were 29.1% in the capital region, and 28.2% in metropolitan cities (31.7% in Seoul, 27.6% in Daegu, descending), whereas adherence rates in rural areas, especially in the southern provinces, were below 20% (14.4% in Jeonbuk, 15.6% in Jeonnam, 18.6% in Gyeongnam, ascending). In 2006, adherence rate in Seoul reached 56.3%, but southern regions, including Jeonnam and Jeonbuk, showed adherence rates below 45%. By 2011, all regions reached adherence rates above 60%, and in 2016, above 65% (highest, 73.1% in Daejeon; lowest, 69.0% in Jeonnam).
Figure 1

Age-sex standardized rates of hypertension management by regional characteristics and calendar year. All rates (%) are directly age-sex standardized to the 2016 population. (A, B) Adherence rates. (C, D) Combination therapy rates. (E, F) Blood test rates. (G, H) Urine test rates. (A, C, E, G) are stratified into capital or non-capital regions. (B, D, F, H) are stratified into metropolitan, urban, or rural area.
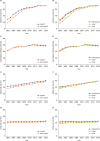
kcj-49-514-g001
Figure 2

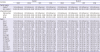
Map visualization of hypertension management by geographic region and calendar year. Yearly rates of adherence, combination therapy, blood test, and urine test are directly age-sex standardized to the 2016 population. Fill colors represent rates in percent. Crude and standardized rates in numeric forms are available in Supplementary Tables 3, 4, 5, 6.

kcj-49-514-g002
Combination therapy and complication screening rates were less heterogeneous across regions. In 2002, the highest combination therapy rate was 48.6% in Busan, followed by 46.4% in Gangwon, while the lowest rates were 37.0% in Jeonnam and 39.5% in Gwangju. By 2011, most regions reached 60% combination therapy rate (highest, 64.6% in Gangwon), but the rates showed decreasing trend thereafter, especially in metropolitan cities (lowest, 56.5% in Seoul and Daegu, 2016). As for complication screening, blood test rates increased from 39.3% to 58.8% nationwide, whereas urine test rates remained below 50% across all regions (lowest, 40.9% in Ulsan, 41.8% in Gyeongbuk, 2016).
When stratified by sex, women, especially those living in non-capital or rural area, had lower rates of hypertension management compared with men in 2002. However, adherence rate and complication screening rate in women exceeded those in men over time. Combination therapy rate, on the other hand, remained lower in women. The pattern of hypertension management according to regional characteristics were similar in both sexes (Supplementary Figure 1).
In multivariable logistic regression at individual level (Tables 2, 3, 4, 5), the odds for being adherent to antihypertensive treatment in most provinces were less than 60% of that in Seoul, when adjusted for age and sex, in 2002 (lowest in Jeonbuk: OR, 0.36; 95% CI, 0.36–0.37; Table 2, model 1). However, the regional difference gradually diminished over time, arriving within 20% in 2016 (highest in Daegu: OR, 1.06; 95% CI, 1.05–1.07 and lowest in Jeonnam: OR, 0.86; 95% CI, 0.86–0.87; Table 2, model 1). Also, for combination therapy and complication screening, results from logistic regression were in agreement with our observations with age-sex standardized rates. Furthermore, for all indicators of hypertension management, the ORs remained largely unchanged, when the models were adjusted for employment status and household income (Tables 2, 3, 4, 5, model 2).
Table 2

Adjusted odds ratios for medication adherence according to geographic region and calendar year
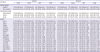
kcj-49-514-i002
Variables Model 1 Model 2
2002 2006 2011 2016 2002 2006 2011 2016
Capital region
Capital* 1.00 (reference) 1.00 (reference) 1.00 (reference) 1.00 (reference) 1.00 (reference) 1.00 (reference) 1.00 (reference) 1.00 (reference)
Non-capital 0.64 (0.64–0.65) 0.76 (0.76–0.76) 0.95 (0.94–0.95) 0.97 (0.97–0.97) 0.65 (0.65–0.66) 0.77 (0.76–0.77) 0.95 (0.95–0.95) 0.98 (0.97–0.98)
Urbanization level
Metropolitan 1.00 (reference) 1.00 (reference) 1.00 (reference) 1.00 (reference) 1.00 (reference) 1.00 (reference) 1.00 (reference) 1.00 (reference)
Urban 0.82 (0.82–0.83) 0.94 (0.93–0.94) 1.00 (1.00–1.00) 1.01 (1.00–1.01) 0.82 (0.82–0.83) 0.94 (0.93–0.94) 1.00 (1.00–1.00) 1.00 (1.00–1.01)
Rural 0.56 (0.55–0.56) 0.76 (0.76–0.76) 0.90 (0.90–0.91) 0.94 (0.94–0.95) 0.57 (0.57–0.58) 0.77 (0.77–0.78) 0.91 (0.91–0.92) 0.95 (0.95–0.96)
Region
Seoul 1.00 (reference) 1.00 (reference) 1.00 (reference) 1.00 (reference) 1.00 (reference) 1.00 (reference) 1.00 (reference) 1.00 (reference)
Busan 0.68 (0.68–0.69) 0.79 (0.78–0.80) 0.99 (0.98–1.00) 0.96 (0.95–0.97) 0.70 (0.69–0.70) 0.80 (0.79–0.80) 0.99 (0.99–1.00) 0.96 (0.95–0.97)
Daegu 0.83 (0.82–0.84) 0.88 (0.87–0.88) 1.05 (1.04–1.06) 1.06 (1.05–1.07) 0.84 (0.83–0.85) 0.88 (0.87–0.89) 1.06 (1.05–1.07) 1.07 (1.06–1.08)
Incheon 0.74 (0.73–0.75) 0.81 (0.80–0.82) 0.97 (0.96–0.97) 1.01 (1.00–1.02) 0.76 (0.74–0.76) 0.82 (0.81–0.83) 0.97 (0.96–0.98) 1.01 (1.00–1.02)
Gwangju 0.60 (0.59–0.62) 0.62 (0.61–0.62) 0.84 (0.84–0.85) 0.88 (0.87–0.89) 0.60 (0.59–0.62) 0.62 (0.61–0.62) 0.85 (0.84–0.86) 0.88 (0.87–0.89)
Daejeon 0.77 (0.76–0.78) 0.88 (0.86–0.88) 1.03 (1.02–1.04) 1.06 (1.05–1.07) 0.77 (0.76–0.79) 0.88 (0.86–0.88) 1.03 (1.02–1.05) 1.06 (1.05–1.07)
Ulsan 0.53 (0.52–0.54) 0.73 (0.72–0.74) 1.00 (0.99–1.01) 1.00 (0.98–1.01) 0.52 (0.51–0.54) 0.72 (0.71–0.73) 0.99 (0.98–1.00) 0.99 (0.98–1.00)
Gyeonggi 0.79 (0.78–0.80) 0.91 (0.91–0.92) 1.00 (1.00–1.01) 1.00 (1.00–1.01) 0.80 (0.79–0.81) 0.92 (0.91–0.92) 1.00 (1.00–1.01) 1.00 (1.00–1.00)
Gangwon 0.61 (0.60–0.62) 0.81 (0.80–0.82) 0.97 (0.96–0.98) 1.04 (1.03–1.05) 0.63 (0.62–0.64) 0.82 (0.81–0.83) 0.98 (0.97–0.98) 1.05 (1.04–1.06)
Chungbuk 0.58 (0.57–0.59) 0.77 (0.76–0.78) 0.98 (0.97–0.99) 1.00 (0.99–1.01) 0.59 (0.58–0.60) 0.78 (0.77–0.78) 0.98 (0.97–0.99) 1.00 (0.99–1.01)
Chungnam 0.49 (0.49–0.50) 0.72 (0.71–0.72) 0.95 (0.94–0.96) 0.97 (0.96–0.98) 0.51 (0.50–0.52) 0.73 (0.72–0.73) 0.95 (0.94–0.96) 0.97 (0.97–0.98)
Jeonbuk 0.36 (0.36–0.37) 0.56 (0.55–0.56) 0.86 (0.85–0.87) 0.94 (0.93–0.95) 0.37 (0.36–0.38) 0.56 (0.56–0.57) 0.87 (0.86–0.88) 0.95 (0.94–0.96)
Jeonnam 0.40 (0.39–0.40) 0.53 (0.53–0.54) 0.77 (0.77–0.78) 0.86 (0.86–0.87) 0.41 (0.40–0.42) 0.54 (0.54–0.55) 0.78 (0.78–0.79) 0.87 (0.86–0.88)
Gyeongbuk 0.53 (0.53–0.54) 0.70 (0.69–0.71) 0.94 (0.93–0.95) 0.99 (0.98–1.00) 0.54 (0.54–0.55) 0.71 (0.70–0.71) 0.95 (0.94–0.95) 1.00 (0.99–1.01)
Gyeongnam 0.50 (0.50–0.51) 0.71 (0.70–0.72) 0.96 (0.95–0.96) 0.95 (0.94–0.96) 0.51 (0.51–0.52) 0.71 (0.71–0.72) 0.96 (0.95–0.97) 0.95 (0.94–0.96)
Jeju 0.60 (0.57–0.62) 0.78 (0.76–0.80) 1.00 (0.98–1.02) 0.98 (0.97–1.00) 0.60 (0.58–0.62) 0.78 (0.76–0.80) 1.01 (0.99–1.03) 0.99 (0.98–1.00)
All values are reported as odds ratios (and 95% confidence intervals). Model 1 was adjusted for age and sex. Model 2 was further adjusted for employment status and income quartiles.
*Capital region includes Seoul, Incheon, and Gyeonggi; Sejong was merged with Chungnam.
Table 3

Adjusted odds ratios for combination therapy according to geographic region and calendar year
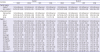
kcj-49-514-i003
Variables Model 1 Model 2
2002 2006 2011 2016 2002 2006 2011 2016
Capital region
Capital* 1.00 (reference) 1.00 (reference) 1.00 (reference) 1.00 (reference) 1.00 (reference) 1.00 (reference) 1.00 (reference) 1.00 (reference)
Non-capital 0.97 (0.97–0.98) 1.02 (1.02–1.02) 1.03 (1.03–1.03) 1.07 (1.06–1.07) 0.97 (0.97–0.98) 1.02 (1.02–1.02) 1.03 (1.02–1.03) 1.06 (1.06–1.07)
Urbanization level
Metropolitan 1.00 (reference) 1.00 (reference) 1.00 (reference) 1.00 (reference) 1.00 (reference) 1.00 (reference) 1.00 (reference) 1.00 (reference)
Urban 0.97 (0.96–0.97) 1.00 (0.99–1.00) 1.02 (1.01–1.02) 1.05 (1.04–1.05) 0.97 (0.96–0.97) 1.00 (0.99–1.00) 1.02 (1.01–1.02) 1.05 (1.04–1.05)
Rural 0.86 (0.86–0.87) 0.97 (0.97–0.98) 1.04 (1.03–1.04) 1.11 (1.11–1.12) 0.86 (0.86–0.87) 0.97 (0.97–0.98) 1.03 (1.03–1.04) 1.11 (1.10–1.11)
Region
Seoul 1.00 (reference) 1.00 (reference) 1.00 (reference) 1.00 (reference) 1.00 (reference) 1.00 (reference) 1.00 (reference) 1.00 (reference)
Busan 1.21 (1.20–1.22) 1.23 (1.22–1.24) 1.19 (1.18–1.20) 1.18 (1.17–1.19) 1.21 (1.19–1.22) 1.22 (1.21–1.23) 1.18 (1.17–1.19) 1.17 (1.17–1.18)
Daegu 0.94 (0.92–0.95) 0.97 (0.96–0.98) 0.96 (0.95–0.96) 1.00 (1.00–1.01) 0.94 (0.92–0.95) 0.96 (0.96–0.98) 0.95 (0.94–0.96) 1.00 (0.99–1.01)
Incheon 0.96 (0.94–0.97) 1.04 (1.03–1.05) 1.09 (1.09–1.10) 1.12 (1.11–1.13) 0.95 (0.94–0.96) 1.04 (1.03–1.05) 1.09 (1.08–1.10) 1.12 (1.11–1.12)
Gwangju 0.84 (0.82–0.85) 0.97 (0.96–0.98) 1.00 (0.99–1.01) 1.03 (1.02–1.04) 0.84 (0.82–0.85) 0.97 (0.96–0.98) 1.00 (0.99–1.01) 1.03 (1.02–1.04)
Daejeon 0.90 (0.88–0.91) 0.99 (0.98–1.00) 1.02 (1.01–1.03) 1.05 (1.04–1.06) 0.90 (0.88–0.91) 0.99 (0.98–1.00) 1.02 (1.01–1.03) 1.04 (1.04–1.05)
Ulsan 1.03 (1.01–1.05) 1.11 (1.09–1.13) 1.16 (1.14–1.17) 1.12 (1.10–1.13) 1.03 (1.01–1.05) 1.12 (1.10–1.13) 1.17 (1.15–1.18) 1.13 (1.12–1.14)
Gyeonggi 0.95 (0.94–0.96) 1.03 (1.03–1.04) 1.06 (1.06–1.07) 1.09 (1.09–1.10) 0.95 (0.94–0.96) 1.03 (1.02–1.04) 1.06 (1.05–1.07) 1.09 (1.08–1.09)
Gangwon 1.12 (1.10–1.13) 1.20 (1.19–1.21) 1.23 (1.22–1.24) 1.27 (1.26–1.28) 1.11 (1.10–1.13) 1.19 (1.18–1.21) 1.23 (1.21–1.24) 1.26 (1.25–1.27)
Chungbuk 0.94 (0.93–0.96) 1.00 (0.99–1.01) 1.07 (1.06–1.08) 1.17 (1.16–1.18) 0.94 (0.93–0.96) 0.99 (0.98–1.00) 1.06 (1.05–1.07) 1.16 (1.15–1.17)
Chungnam 0.85 (0.84–0.86) 1.02 (1.01–1.03) 1.12 (1.11–1.13) 1.16 (1.15–1.17) 0.85 (0.84–0.86) 1.02 (1.01–1.03) 1.12 (1.11–1.13) 1.16 (1.15–1.16)
Jeonbuk 0.88 (0.87–0.90) 1.00 (0.99–1.01) 1.00 (1.00–1.01) 1.12 (1.11–1.13) 0.88 (0.87–0.89) 1.00 (0.99–1.01) 1.00 (0.99–1.01) 1.11 (1.11–1.12)
Jeonnam 0.76 (0.74–0.76) 0.91 (0.90–0.92) 1.01 (1.00–1.02) 1.16 (1.15–1.17) 0.75 (0.74–0.76) 0.90 (0.89–0.91) 1.01 (1.00–1.01) 1.15 (1.14–1.16)
Gyeongbuk 0.86 (0.85–0.87) 1.00 (0.99–1.01) 1.01 (1.01–1.02) 1.08 (1.08–1.09) 0.86 (0.85–0.87) 1.00 (0.99–1.01) 1.01 (1.00–1.02) 1.08 (1.07–1.09)
Gyeongnam 1.01 (1.00–1.02) 1.04 (1.03–1.05) 1.07 (1.07–1.08) 1.14 (1.13–1.15) 1.01 (1.00–1.02) 1.04 (1.03–1.05) 1.07 (1.06–1.08) 1.14 (1.13–1.15)
Jeju 0.87 (0.84–0.90) 0.99 (0.97–1.01) 1.00 (0.99–1.02) 1.10 (1.08–1.12) 0.87 (0.84–0.90) 0.99 (0.97–1.01) 1.00 (0.98–1.01) 1.09 (1.08–1.11)
All values are reported as odds ratios (and 95% confidence intervals). Model 1 was adjusted for age and sex. Model 2 was further adjusted for employment status and income quartiles.
*Capital region includes Seoul, Incheon, and Gyeonggi; Sejong was merged with Chungnam.
Table 4

Adjusted odds ratios for blood test according to geographic region and calendar year
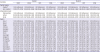
kcj-49-514-i004
Variables Model 1 Model 2
2002 2006 2011 2016 2002 2006 2011 2016
Capital region
Capital* 1.00 (reference) 1.00 (reference) 1.00 (reference) 1.00 (reference) 1.00 (reference) 1.00 (reference) 1.00 (reference) 1.00 (reference)
Non-capital 0.76 (0.75–0.76) 0.86 (0.85–0.86) 0.86 (0.86–0.86) 0.91 (0.90–0.91) 0.76 (0.75–0.76) 0.85 (0.85–0.86) 0.86 (0.85–0.86) 0.90 (0.90–0.90)
Urbanization level
Metropolitan 1.00 (reference) 1.00 (reference) 1.00 (reference) 1.00 (reference) 1.00 (reference) 1.00 (reference) 1.00 (reference) 1.00 (reference)
Urban 0.93 (0.92–0.94) 0.99 (0.99–1.00) 0.99 (0.99–1.00) 1.02 (1.02–1.03) 0.93 (0.92–0.94) 0.99 (0.99–1.00) 0.99 (0.99–1.00) 1.03 (1.02–1.03)
Rural 0.80 (0.80–0.81) 0.87 (0.86–0.87) 0.93 (0.93–0.94) 0.98 (0.98–0.98) 0.80 (0.80–0.81) 0.86 (0.86–0.87) 0.92 (0.92–0.93) 0.97 (0.97–0.97)
Region
Seoul 1.00 (reference) 1.00 (reference) 1.00 (reference) 1.00 (reference) 1.00 (reference) 1.00 (reference) 1.00 (reference) 1.00 (reference)
Busan 0.64 (0.64–0.65) 0.78 (0.78–0.79) 0.75 (0.74–0.75) 0.83 (0.82–0.83) 0.65 (0.64–0.66) 0.79 (0.78–0.80) 0.75 (0.74–0.75) 0.82 (0.82–0.83)
Daegu 0.65 (0.64–0.66) 0.81 (0.80–0.82) 0.77 (0.76–0.77) 0.84 (0.83–0.84) 0.65 (0.64–0.66) 0.81 (0.80–0.82) 0.76 (0.76–0.77) 0.83 (0.82–0.84)
Incheon 0.73 (0.72–0.74) 0.84 (0.84–0.85) 0.91 (0.90–0.92) 0.90 (0.90–0.91) 0.74 (0.73–0.75) 0.85 (0.85–0.86) 0.91 (0.91–0.92) 0.90 (0.90–0.91)
Gwangju 0.78 (0.76–0.79) 0.92 (0.91–0.93) 0.88 (0.87–0.89) 0.93 (0.92–0.94) 0.77 (0.76–0.79) 0.92 (0.91–0.93) 0.88 (0.87–0.89) 0.92 (0.92–0.93)
Daejeon 0.72 (0.71–0.73) 0.86 (0.86–0.88) 0.76 (0.75–0.77) 0.73 (0.72–0.74) 0.72 (0.71–0.73) 0.86 (0.86–0.88) 0.76 (0.75–0.77) 0.73 (0.72–0.74)
Ulsan 0.69 (0.68–0.70) 0.76 (0.75–0.77) 0.77 (0.76–0.78) 0.84 (0.83–0.85) 0.69 (0.68–0.71) 0.76 (0.75–0.77) 0.76 (0.75–0.77) 0.83 (0.82–0.84)
Gyeonggi 0.82 (0.81–0.83) 0.92 (0.92–0.92) 0.90 (0.90–0.91) 0.95 (0.94–0.95) 0.82 (0.82–0.83) 0.92 (0.92–0.93) 0.91 (0.90–0.91) 0.95 (0.95–0.96)
Gangwon 0.84 (0.83–0.85) 0.86 (0.85–0.87) 0.93 (0.92–0.94) 1.04 (1.03–1.05) 0.84 (0.83–0.86) 0.86 (0.85–0.87) 0.92 (0.92–0.93) 1.04 (1.03–1.04)
Chungbuk 0.61 (0.60–0.62) 0.75 (0.74–0.76) 0.80 (0.79–0.81) 0.90 (0.89–0.91) 0.62 (0.61–0.63) 0.75 (0.74–0.76) 0.80 (0.79–0.81) 0.90 (0.89–0.90)
Chungnam 0.70 (0.70–0.71) 0.84 (0.83–0.85) 0.87 (0.87–0.88) 0.89 (0.88–0.90) 0.71 (0.70–0.72) 0.84 (0.83–0.85) 0.87 (0.86–0.88) 0.88 (0.87–0.89)
Jeonbuk 0.70 (0.69–0.71) 0.75 (0.74–0.76) 0.79 (0.78–0.79) 0.85 (0.85–0.86) 0.70 (0.69–0.71) 0.75 (0.74–0.76) 0.78 (0.78–0.79) 0.84 (0.84–0.85)
Jeonnam 0.61 (0.60–0.62) 0.82 (0.81–0.82) 0.83 (0.83–0.84) 0.88 (0.87–0.88) 0.61 (0.60–0.62) 0.82 (0.81–0.82) 0.83 (0.82–0.83) 0.87 (0.86–0.87)
Gyeongbuk 0.66 (0.65–0.67) 0.75 (0.74–0.75) 0.78 (0.77–0.78) 0.84 (0.84–0.85) 0.66 (0.65–0.67) 0.75 (0.74–0.75) 0.77 (0.77–0.78) 0.83 (0.83–0.84)
Gyeongnam 0.61 (0.60–0.62) 0.84 (0.83–0.84) 0.83 (0.82–0.84) 0.90 (0.90–0.91) 0.62 (0.61–0.62) 0.84 (0.83–0.84) 0.82 (0.82–0.83) 0.90 (0.89–0.90)
Jeju 0.77 (0.74–0.80) 1.16 (1.14–1.19) 1.07 (1.05–1.08) 1.10 (1.08–1.11) 0.77 (0.74–0.80) 1.16 (1.13–1.19) 1.06 (1.04–1.08) 1.09 (1.07–1.10)
All values are reported as odds ratios (and 95% confidence intervals). Model 1 was adjusted for age and sex. Model 2 was further adjusted for employment status and income quartiles.
*Capital region includes Seoul, Incheon, and Gyeonggi; Sejong was merged with Chungnam.
Table 5

Adjusted odds ratios for urine test according to geographic region and calendar year

kcj-49-514-i005
Variables Model 1 Model 2
2002 2006 2011 2016 2002 2006 2011 2016
Capital region
Capital* 1.00 (reference) 1.00 (reference) 1.00 (reference) 1.00 (reference) 1.00 (reference) 1.00 (reference) 1.00 (reference) 1.00 (reference)
Non-capital 0.92 (0.92–0.93) 0.92 (0.92–0.93) 0.92 (0.91–0.92) 0.93 (0.93–0.93) 0.92 (0.92–0.93) 0.92 (0.92–0.92) 0.91 (0.91–0.92) 0.92 (0.92–0.92)
Urbanization level
Metropolitan 1.00 (reference) 1.00 (reference) 1.00 (reference) 1.00 (reference) 1.00 (reference) 1.00 (reference) 1.00 (reference) 1.00 (reference)
Urban 0.90 (0.90–0.91) 0.94 (0.93–0.94) 0.94 (0.94–0.94) 0.96 (0.96–0.96) 0.90 (0.90–0.91) 0.94 (0.93–0.94) 0.94 (0.94–0.94) 0.96 (0.96–0.96)
Rural 0.80 (0.80–0.81) 0.83 (0.83–0.84) 0.88 (0.88–0.89) 0.91 (0.91–0.92) 0.80 (0.79–0.80) 0.83 (0.83–0.84) 0.88 (0.87–0.88) 0.91 (0.90–0.91)
Region
Seoul 1.00 (reference) 1.00 (reference) 1.00 (reference) 1.00 (reference) 1.00 (reference) 1.00 (reference) 1.00 (reference) 1.00 (reference)
Busan 0.85 (0.84–0.86) 0.91 (0.90–0.92) 0.89 (0.89–0.90) 0.93 (0.92–0.94) 0.85 (0.84–0.86) 0.91 (0.91–0.92) 0.89 (0.89–0.90) 0.93 (0.92–0.93)
Daegu 0.91 (0.90–0.92) 0.98 (0.97–0.99) 0.91 (0.90–0.91) 0.89 (0.88–0.90) 0.91 (0.90–0.92) 0.98 (0.97–0.99) 0.90 (0.90–0.91) 0.88 (0.88–0.89)
Incheon 0.86 (0.85–0.87) 0.92 (0.91–0.92) 0.96 (0.95–0.97) 0.98 (0.98–0.99) 0.87 (0.86–0.88) 0.92 (0.92–0.93) 0.96 (0.96–0.97) 0.98 (0.98–0.99)
Gwangju 1.14 (1.12–1.16) 1.09 (1.08–1.11) 1.03 (1.02–1.04) 1.07 (1.05–1.08) 1.14 (1.12–1.16) 1.09 (1.08–1.11) 1.03 (1.02–1.04) 1.06 (1.05–1.07)
Daejeon 0.89 (0.88–0.90) 0.97 (0.96–0.98) 0.86 (0.85–0.87) 0.88 (0.87–0.89) 0.89 (0.88–0.90) 0.97 (0.96–0.99) 0.86 (0.85–0.87) 0.88 (0.87–0.89)
Ulsan 0.81 (0.80–0.83) 0.84 (0.82–0.85) 0.78 (0.77–0.79) 0.78 (0.78–0.79) 0.82 (0.80–0.83) 0.84 (0.82–0.85) 0.78 (0.77–0.79) 0.78 (0.77–0.79)
Gyeonggi 0.82 (0.82–0.83) 0.91 (0.90–0.91) 0.90 (0.90–0.90) 0.93 (0.93–0.94) 0.83 (0.82–0.83) 0.91 (0.91–0.92) 0.90 (0.90–0.90) 0.93 (0.93–0.94)
Gangwon 0.82 (0.80–0.83) 0.82 (0.81–0.82) 0.86 (0.86–0.87) 0.89 (0.88–0.89) 0.81 (0.80–0.83) 0.82 (0.81–0.83) 0.86 (0.85–0.87) 0.88 (0.87–0.89)
Chungbuk 0.74 (0.73–0.75) 0.77 (0.76–0.78) 0.81 (0.80–0.82) 0.85 (0.85–0.86) 0.74 (0.73–0.75) 0.78 (0.77–0.78) 0.81 (0.80–0.81) 0.85 (0.84–0.86)
Chungnam 0.82 (0.81–0.84) 0.84 (0.83–0.84) 0.86 (0.85–0.86) 0.89 (0.88–0.90) 0.82 (0.81–0.84) 0.84 (0.83–0.84) 0.85 (0.84–0.86) 0.88 (0.88–0.89)
Jeonbuk 0.95 (0.94–0.96) 0.93 (0.92–0.94) 0.94 (0.93–0.95) 0.99 (0.98–1.00) 0.95 (0.94–0.96) 0.93 (0.92–0.94) 0.93 (0.93–0.94) 0.98 (0.97–0.99)
Jeonnam 0.80 (0.80–0.82) 0.89 (0.88–0.90) 0.90 (0.90–0.91) 0.93 (0.92–0.94) 0.80 (0.79–0.82) 0.89 (0.88–0.90) 0.90 (0.89–0.91) 0.92 (0.91–0.93)
Gyeongbuk 0.80 (0.79–0.81) 0.79 (0.79–0.80) 0.80 (0.79–0.80) 0.82 (0.81–0.82) 0.80 (0.79–0.81) 0.79 (0.79–0.80) 0.79 (0.79–0.80) 0.81 (0.80–0.81)
Gyeongnam 0.70 (0.69–0.71) 0.82 (0.81–0.82) 0.82 (0.82–0.83) 0.85 (0.85–0.86) 0.70 (0.69–0.71) 0.82 (0.81–0.82) 0.82 (0.82–0.83) 0.85 (0.84–0.85)
Jeju 0.82 (0.80–0.85) 1.01 (0.99–1.04) 0.99 (0.97–1.00) 1.10 (1.09–1.12) 0.82 (0.79–0.85) 1.01 (0.99–1.03) 0.98 (0.96–1.00) 1.10 (1.08–1.11)
All values are reported as odds ratios (and 95% confidence intervals). Model 1 was adjusted for age and sex. Model 2 was further adjusted for employment status and income quartiles.
*Capital region includes Seoul, Incheon, and Gyeonggi; Sejong was merged with Chungnam.
Finally, as some patients may visit out-of-region hospitals, we also calculated adherence rate and combination therapy rate according to geographic region and characteristics of the hospital prescribing the medications (Supplementary Figures 2 and 3). The trend of hypertension management by region of hospital were largely similar to that by region of residence. When stratified by hospital type, adherence rate in primary clinics was lower than that in tertiary hospitals in 2002 (primary, 22.1%; tertiary, 36.6%), but the rate rapidly improved and exceeded that of tertiary hospitals in 2008 and thereafter (primary, 74.7%; tertiary, 70.1%; in 2016). In case of combination therapy rate, the overall trend of rise and fall was observed in all three hospital types, but the decline after 2011 was more rapid in secondary and tertiary hospitals than in primary clinics.

DISCUSSION

In this nationwide study of persons treated for hypertension in Korea, we observed a trend of diminishing regional variation in hypertension management from 2002 to 2016. The largest inter-regional difference in the OR for medication adherence decreased from 64% in 2002 to 20% in 2016; and for combination therapy, from 45% in 2002 to 27% in 2016. Geographic distributions of complication screening rates were less heterogeneous. Of note, this is the first study to describe regional difference of hypertension management in Korea. Given that the NHI was universally implemented by 1989, finding of such low adherence rates and large regional differences in the early 2000s is interesting, as is the rapid improvements made thereafter.
Adherence rates have substantially increased nationwide, reaching 70% in most regions by 2013. On the other hand, the recent decreasing trend of combination therapy rate is quite unexpected. While dual therapy rates are constantly increasing, triple (or higher) therapy rates have been slowly decreasing across all regions after 2011. As we do not have data on achieved BPs, it is unclear whether this trend reflects less intensive BP control, less need for triple therapy to achieve target BP, or a greater influx of new patients with initial single or dual therapy. In the Korean National Health and Nutrition Examination Survey (KNHANES), 1998–2016, the rate of BP control below 140/90 mmHg have plateaued at 70% among treated patients after 2010.13) However, information on antihypertensive regimen was not available in KNHANES. In the early- to mid-2010s, results from the Action to Control Cardiovascular Risk in Diabetes blood pressure (ACCORD BP) trial15) and the subsequent 2013 European Society of Hypertension (ESH)/European Society of Cardiology (ESC)16) and the 2014 Eighth Joint National Committee (JNC-8)17) hypertension guidelines de-emphasized the importance of intensive BP lowering. The impact of such guidelines may have been reflected in this decreasing trend of combination therapy after 2011, especially in secondary and tertiary hospitals. In this regard, it would be interesting to see the impact of Systolic Blood Pressure Intervention Trial (SPRINT)18) and the recent 2017 American College of Cardiology/American Heart Association19) and 2018 ESC/ESH20) guidelines on combination therapy rate in Korea in the near future.
For complication screening, The Korean Society of Hypertension recommends annual testing for proteinuria, and blood chemistry, including creatinine and electrolytes.21)22) Blood test rates have modestly improved, but still remains below 60% in most regions. Urine test rates have been stagnant below 50% across all regions. Particularly, urine microalbumin tests are done in less than 30%, with no improvement over 15 years. Measurement of random urine albumin-to-creatinine ratio, for screening glomerular injury, should be more advocated as per international guidelines.19)20)
The reason for regional variation in hypertension management is not entirely understood. A British study on hypertension treatment found attenuated regional effect when adjusted for sociodemographic factors including employment, education, etc.6) However, the study compared London with the rest of England, rather than inter-comparing regions or districts. Another study using small spatial units in Germany suggested areal deprivation to be associated with disease distribution.10) In our study, geographic effect on hypertension management remained unchanged, even after serial adjustment for individual-level sociodemographic variables, although lifestyle factors were not included in the model. In this regard, the large regional difference in the early 2000s, as well as its resolution, may be related to regional characteristics or infrastructures, rather than individual-level risk factors.
Our study has some notable strengths. Using a nationwide database of the entire Korean population, we captured nearly all cases of treated hypertension, providing representative indicators that may be useful for local governments and policymakers. Importantly, these indicators of hypertension management, as well as other covariates, were derived from objective data rather than self-report. Furthermore, individual-level data on residential areas, sociodemographic factors, and healthcare utilization were available. However, our study also has some limitations. First, diagnosis of hypertension was based on medical claims rather than clinical information. Definition of hypertension using administrative data has been well reviewed elsewhere.23) However, the true prevalence of hypertension cannot be determined, and individuals untreated or with no healthcare utilization would not be identified by claims data. Second, analyses on smaller regional units were not done. Aggregate figures are weighed more on populous subunits, and thus may underrepresent less inhabited areas. Using smaller areal units, with smoothing methods,24) would achieve a finer geospatial assessment, but would deviate from our purpose of providing useful indicators at provincial level. Third, in the logistic model, temporal and geospatial effects were analyzed separately rather than simultaneously. Therefore, inference on the change of geospatial effect over time cannot be made, and would instead require a multilevel approach. Fourth, lifestyle factors and other unmeasured confounders may have contributed to geographic variations at individual level. Lastly, this study excluded Medical Aid beneficiaries, and thus should be interpreted accordingly.
In conclusion, geographic variation of hypertension management in Korea had been concerning, but the difference has become less apparent over the last 15 years. Adherence rates have plateaued above 70% nationwide. Recently decreasing trend of combination therapy rates should be noted, but its clinical implication is yet unclear. Finally, there is still room for improvement in complication screening, especially for proteinuria.

Notes

Funding This work was partially supported by a grant of the Korea Health Technology R&D Project through the Korea Health Industry Development Institute, funded by the Ministry of Health and Welfare, Republic of Korea (grant No. HI13C0715). HL was supported by the Physician-Scientist Fellowship Program, Yonsei University College of Medicine, Seoul, Korea.

Conflict of Interest The authors have no financial conflicts of interest.

Author Contributions

  • Conceptualization: Lee H, Kim HC.

  • Formal analysis: Lee H.

  • Funding acquisition: Kim HC.

  • Supervision: Kim HC.

  • Visualization: Lee H.

  • Writing - original draft: Lee H.

  • Writing - review & editing: Park S, Kim HC.

References

1. GBD 2016 Risk Factors Collaborators. Global, regional, and national comparative risk assessment of 84 behavioural, environmental and occupational, and metabolic risks or clusters of risks, 1990–2016: a systematic analysis for the Global Burden of Disease Study 2016. Lancet. 2017; 390:1345–1422.
2. Grotto I, Huerta M, Sharabi Y. Hypertension and socioeconomic status. Curr Opin Cardiol. 2008; 23:335–339.
crossref
3. Chow CK, Teo KK, Rangarajan S, et al. Prevalence, awareness, treatment, and control of hypertension in rural and urban communities in high-, middle-, and low-income countries. JAMA. 2013; 310:959–968.
crossref
4. Lloyd-Sherlock P, Beard J, Minicuci N, Ebrahim S, Chatterji S. Hypertension among older adults in low- and middle-income countries: prevalence, awareness and control. Int J Epidemiol. 2014; 43:116–128.
crossref
5. Reynolds K, Gu D, Muntner P, et al. Geographic variations in the prevalence, awareness, treatment and control of hypertension in China. J Hypertens. 2003; 21:1273–1281.
crossref
6. Mindell JS, Shelton NJ, Roth MA, Chaudhury M, Falaschetti E. Persistent regional variation in treatment of hypertension. Public Health. 2012; 126:317–323.
crossref
7. Marques-Vidal P, Paccaud F. Regional differences in self-reported screening, prevalence and management of cardiovascular risk factors in Switzerland. BMC Public Health. 2012; 12:246.
crossref
8. Stöckl D, Rückert-Eheberg IM, Heier M, et al. Regional variability of lifestyle factors and hypertension with prediabetes and newly diagnosed type 2 diabetes mellitus: the population-based KORA-F4 and SHIP-TREND studies in Germany. PLoS One. 2016; 11:e0156736.
crossref
9. Yin M, Augustin B, Fu Z, Yan M, Fu A, Yin P. Geographic distributions in hypertension diagnosis, measurement, prevalence, awareness, treatment and control rates among middle-aged and older adults in China. Sci Rep. 2016; 6:37020.
crossref
10. Kauhl B, Maier W, Schweikart J, Keste A, Moskwyn M. Exploring the small-scale spatial distribution of hypertension and its association to area deprivation based on health insurance claims in Northeastern Germany. BMC Public Health. 2018; 18:121.
crossref
11. OECD iLibrary. Doctors' Consultations. place unknown: OECD iLibrary;2018. DOI: 10.1787/1a1ac034-en.
12. National Health Insurance Service. 2016 National Health Screening Statistical Yearbook. Wonju: National Health Insurance Service;2017.
13. Korean Society Hypertension (KSH). Hypertension Epidemiology Research Working Group. Kim HC, Cho MC. Korea hypertension fact sheet 2018. Clin Hypertens. 2018; 24:13.
crossref
14. Seong SC, Kim YY, Khang YH, et al. Data resource profile: the national health information database of the national health insurance service in South Korea. Int J Epidemiol. 2017; 46:799–800.
15. ACCORD Study Group. Cushman WC, Evans GW, et al. Effects of intensive blood-pressure control in type 2 diabetes mellitus. N Engl J Med. 2010; 362:1575–1585.
crossref
16. Mancia G, Fagard R, Narkiewicz K, et al. 2013 ESH/ESC guidelines for the management of arterial hypertension: the Task Force for the Management of Arterial Hypertension of the European Society of Hypertension (ESH) and of the European Society of Cardiology (ESC). Eur Heart J. 2013; 34:2159–2219.
17. James PA, Oparil S, Carter BL, et al. 2014 evidence-based guideline for the management of high blood pressure in adults: report from the panel members appointed to the Eighth Joint National Committee (JNC 8). JAMA. 2014; 311:507–520.
18. SPRINT Research Group. Wright JT Jr, Williamson JD, et al. A randomized trial of intensive versus standard blood-pressure control. N Engl J Med. 2015; 373:2103–2116.
crossref
19. Whelton PK, Carey RM, Aronow WS, et al. 2017 ACC/AHA/AAPA/ABC/ACPM/AGS/APhA/ASH/ASPC/NMA/PCNA guideline for the prevention, detection, evaluation, and management of high blood pressure in adults: a report of the American College of Cardiology/American Heart Association Task Force on Clinical Practice Guidelines. Hypertension. 2018; 71:e13–115.
crossref
20. Williams B, Mancia G, Spiering W, et al. 2018 ESC/ESH guidelines for the management of arterial hypertension. Eur Heart J. 2018; 39:3021–3104.
21. Shin J, Park JB, Kim KI, et al. 2013 Korean Society of Hypertension guidelines for the management of hypertension: part I-epidemiology and diagnosis of hypertension. Clin Hypertens. 2015; 21:1.
crossref
22. Shin J, Park JB, Kim KI, et al. 2013 Korean Society of Hypertension guidelines for the management of hypertension: part II-treatments of hypertension. Clin Hypertens. 2015; 21:2.
crossref
23. Halpern MT, Khan ZM, Schmier JK, et al. Recommendations for evaluating compliance and persistence with hypertension therapy using retrospective data. Hypertension. 2006; 47:1039–1048.
crossref
24. Pedigo A, Aldrich T, Odoi A. Neighborhood disparities in stroke and myocardial infarction mortality: a GIS and spatial scan statistics approach. BMC Public Health. 2011; 11:644.
crossref

SUPPLEMENTARY MATERIALS

Supplementary Table 1

Index drug codes

Supplementary Table 2

Study population size

Supplementary Table 3

Crude and standardized adherence rates by geographic region and calendar year

Supplementary Table 4

Crude and standardized combination therapy rates by geographic region and calendar year

Supplementary Table 5

Crude and standardized blood test rates by geographic region and calendar year

Supplementary Table 6

Crude and standardized urine test rates by geographic region and calendar year

Supplementary Figure 1

Age-standardized rates of hypertension management stratified by sex.

Supplementary Figure 2

Age-sex standardized rates of hypertension management by hospital characteristics and calendar year.

Supplementary Figure 3

Map visualization of hypertension management by hospital region and calendar year.
TOOLS
ORCID iDs

Hokyou Lee
https://orcid.org/0000-0002-5034-8422

Sungha Park
https://orcid.org/0000-0001-5362-478X

Hyeon Chang Kim
https://orcid.org/0000-0001-7867-1240

Similar articles