

 PDF
PDF ePub
ePub Citation
 Print
Print


INTRODUCTION
The most challenging step of percutaneous coronary intervention in a bifurcation lesion with the one-stent technique is crossing the wire to the side branch (SB) after the main vessel (MV) is stented.1) The proximal optimization technique (POT) was originally developed to facilitate crossing a guidewire or balloon in the SB through the stent struts covering the MV.2) This procedure is performed by post-dilating the MV stent immediately proximal to the carina using a short, non-compliant balloon sized for the proximal MV reference diameter. This technique also improves stent apposition and eccentricity in the proximal MV.3)4)5) The consensus of European Bifurcation Club considers POT to be a standard step in the treatment of coronary bifurcation lesion.6) However, the clinical impact of stent apposition, expansion, and reduction of eccentricity is not clear, while these features are considered the major benefits of POT. Moreover, limited data were available on the clinical benefit of POT in a large-scale study. Therefore, in this study, we sought to investigate the impact of POT on clinical outcomes in patients with coronary bifurcation lesions treated with drug-eluting stents.
METHODS
Study population
This is a retrospective multicenter registry of patients with coronary bifurcation lesions who underwent percutaneous coronary intervention with drug-eluting stent. A total of 2,897 patients from 18 major coronary intervention centers between January 2003 and December 2009 were enrolled. The inclusion criteria were as follows: 1) coronary bifurcation lesions treated with drug-eluting stent only; and 2) MV diameter of 2.5 mm and SB diameter of 2.3 mm confirmed by core laboratory quantitative coronary analysis. The decisions regarding whether or not to perform POT were made by the respective operators. A bifurcation lesion with a large SB will have a large discrepancy between the proximal and distal MV according to Murray's law.7) This type of lesion is the optimal target of POT. In order to assess the effects of POT on procedural and clinical outcomes, we additionally selected bifurcation lesions with an SB reference diameter ≥2.5 mm on core-lab quantitative coronary angiography analysis. A total of 1,191 patients were ultimately included in this study. The local Institutional Review Board at each hospital approved this study, and the need for informed consent was waived.
Percutaneous coronary intervention procedure and proximal optimization technique
Decisions regarding the treatment strategy, stenting technique, selection of drug-eluting stent type, and use of glycoprotein IIb/IIIa receptor inhibitors or intravascular ultrasound were all made at the operator's discretion. The POT was performed in one of two ways, as follows: 1) immediately after MV stenting with a nominal pressure, the stent balloon was pulled back to post-dilate the proximal MV just proximal to the carina with a high pressure targeting 0.25–0.5 mm overexpansion above the nominal balloon diameter; 2) after MV stenting, the MV stent was post-dilated immediately proximal to the carina using a short, non-compliant balloon sized for the proximal MV reference diameter.
Data collection and quantitative coronary angiographic analysis
Data were collected using a Web-based reporting system. Additional information was obtained from the medical records or by telephone contact, if necessary. Coronary angiograms were reviewed and analyzed quantitatively by an independent core laboratory. Angiographic and procedural characteristics of all cine-angiograms were reviewed and analyzed at the angiographic core laboratory using an automated edge-detection system (Centricity CA1000; GE; Waukesha, WI, USA) and standard definitions.8) Bifurcations were classified according to the Medina classification, in which the proximal MV, distal MV, and SB components of the bifurcation are each assigned a score of 1 or 0 depending on the presence or absence of >50% stenosis, respectively.9) Target bifurcation was defined as lesions including MV (<5 mm proximal to SB take off and <5 mm distal to SB take off) and SB ostium (<5 mm distal to take off). Quantitative coronary angiographic analysis was independently rechecked off-line by two experienced analysts based on previous study.10)
Definitions and outcomes
Deaths were considered to be of cardiac origin unless there was documentation of otherwise. Myocardial infarction was defined as the presence of electrocardiography findings indicative of ischemia that were unrelated to the index procedure, as well as chest discomfort associated with elevated creatinine kinase MB fraction or troponin-T/troponin I. The primary outcome was major adverse cardiac events (MACEs), which were defined as a composite of cardiac death, myocardial infarction, or target lesion revascularization (TLR) during follow-up. The secondary outcomes included individual components of the primary endpoint, all-cause death, and stent thrombosis.
Statistical analysis
Comparisons for continuous variables were made using the t-test or the Wilcoxon rank-sum test when applicable. Results are presented as mean±standard deviation or median with interquartile range. The differences between groups were evaluated using χ2 or Fisher's exact test for categorical data. All outcomes of interest for analysis are survival data — all cause death, cardiac death, MI, stent thrombosis, TLR (MV, SB ostium, target bifurcation), and MACE. To estimate hazard rates for all-cause death, we used a multivariable Cox model and considered all covariates that were either statistically suggestive with (p<0.2) on univariate analysis or clinically relevant. To estimate hazard rates for other survival events with competing risks, we used the Fin and Gray's competing risk proportional hazard model; 1) cardiac death (competing risk=non-cardiac death); 2) MI (competing risk=death); 3) TLR and its components (competing risk=death); and 4) stent thrombosis (competing risk=death). We then advocated the propensity score method to balance the treatment groups and compared if confounding effects in our retrospective study might have produced bias in the estimated hazard rates obtained above. Propensity scores were estimated using multiple logistic-regression analysis. We developed a full non-parsimonious model, which includes all variables in Tables 1 and 2, as well as the baseline variables of quantitative coronary angiographic analysis in Table 3. One-to-many (1:N) propensity score matching with non-fixed matching ratio was performed using the nearest neighbor matching method, which is a greedy algorithm among patients with an individual propensity score. The covariate balance achieved by matching was assessed by calculating the absolute standardized mean differences of <10% and variance ratio of 1.0 in all covariates between the POT and non-POT groups. In the propensity score-matched population, continuous variables were compared using a paired t-test or the Wilcoxon signed-rank test, as appropriate. Categorical variables were compared using McNemar's or Bowker's test of symmetry, as appropriate. The reduction in the risk of negative outcome was estimated using a clustered Cox regression model or an extension of a competing risk proportional hazard model for the propensity matched clustered data and compared with the results from the original full data. The cumulative incidence functions of the POT and non-POT groups for MACE were obtained from the competing risk model and compared by a Gray's test. Statistical analyses were performed using SAS 9.2 (SAS Institute Inc., Cary, NC, USA). All tests were two-tailed, and p<0.05 were considered statistically significant.
Table 1
Baseline patient characteristics

Values are presented as mean±standard deviation or number (%).
POT = proximal optimization technique.
![]()
Table 2
Angiographic and procedural characteristics

Values are presented as mean±standard deviation or number (%).
MV = main vessel; POT = proximal optimization technique; SB = side branch.
![]()
Table 3
Quantitative coronary angiographic analysis

Values are presented as mean±standard deviation.
MV = main vessel; POT = proximal optimization technique; SB = side branch.
![]()
RESULTS
Clinical, angiographic, and procedural characteristics
Among the 1,191 eligible patients, POT was performed in 252 patients (21.2%). Eighty-one of these patients were treated with a short, non-compliant balloon. There was no significant difference in the clinical characteristics between the POT and non-POT groups, except for the proportion of dyslipidemia (Table 1). The angiographic and procedural characteristics are shown in Table 2. Compared with patients in the non-POT group, those in the POT group had a higher incidence of left main bifurcation, non-true bifurcation, SB predilation, use of intravascular ultrasound, one stent technique, and large stent diameter (Table 2). After propensity score matching, there were no significant differences in the clinical, angiographic, and procedural characteristics between the two groups.
Quantitative coronary angiographic data
After propensity score matching, there were no significant differences in results of quantitative coronary angiographic analysis between the two groups (Table 3). Notably, the manual lymph drainage (MLD) of the proximal MV was similar between the two groups, both in the total population and in the propensity score-matched population. After POT, the MV proximal, middle and distal MLD, SB ostial, and distal MLD were similar between the two groups. These results of quantitative coronary angiographic analysis were maintained after POT in the propensity-matched populations.
Clinical outcomes
The median follow-up duration was 37.3 (interquartile range, 26.0–51.8) months. In the total population, the incidence of MACEs was significantly lower in the POT group than it was in the non-POT group (POT vs. non-POT; 4.8% vs. 11.7%, p=0.006, Table 4, Figure 1A). This result was mostly driven by the lower incidence of TLR (3.6% vs. 9.5%, p=0.008), mostly in MV, in the POT group compared to that in the non-POT group. After 1:N propensity-score matching, the POT was associated with a lower incidence of MACE (3.8% vs. 11.8%, hazard ratio [HR], 0.34; 95% confidence interval [CI], 0.17–0.69; p=0.003, Table 4, Figure 1B) and TLR (3.3% vs. 9.5%, HR, 0.37; 95% CI, 0.17–0.78; p=0.01), mostly in MV.
Table 4
Clinical outcomes in POT group compared with non-POT group during follow-up period

Values are presented as number (%). Stent thrombosis was defined as definite or probable; MACEs included cardiac death, recurrent myocardial infarction, and TLR. All-cause mortality was analyzed via the Cox regression model and other survival outcomes were analyzed via the method of a competing risk proportional hazard model where the competing risk was non-cardiac death for cardiac death or death for others.
CI = confidence interval; HR = hazard ratio; MACE = major adverse cardiac event; MV = main vessel; POT = proximal optimization technique; SB = side branch; TLR = target lesion revascularization.
*Adjusted covariates include dyslipidemia, prior percutaneous coronary intervention, bifurcation location, Medina classification, predilatation of SB, use of intravascular ultrasound, stent technique, maximal stent diameter, and ostium minimal luminal diameter of SB.
![]()
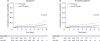 | Figure 1Cumulative incidence functions in POT versus non-POT groups from a competing risk proportional hazard model for MACE. (A) Cumulative incidence functions for MACEs in POT (solid line) versus non-POT groups (dashed line) in all patients. (B) Cumulative incidence functions for MACEs in POT versus non-POT groups in propensity-matched populations.MACE = major adverse cardiac event; POT = proximal optimization technique; PS = propensity-score.
|
Subgroup analysis
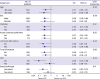
We calculated the unadjusted HR for MACE and TLR in various complex subgroups in order to determine whether the observed outcomes related to POT (in the overall populations) were consistent. Compared with the non-POT group, the association of POT with better MACE outcomes was consistent across various subgroups. Of note, POT was not associated with a reduction in MACE in patients who were treated with kissing ballooning. In contrast, POT was associated with a reduction in MACE in those treated without kissing ballooning (p for interaction=0.052, Figure 2). Similarly, the association of POT with better TLR outcomes was consistent across various subgroups without a significant interaction. However, there was a significant interaction between the use of POT and TLR according to the presence or absence of final kissing ballooning (p for interaction=0.03, Figure 3).
 | Figure 2Comparative unadjusted HRs of MACE for subgroups in all population. The association of POT with better TLR outcomes was consistent across various subgroups without a significant interaction.HR = hazard ratio; FKB = final kissing ballooning; MACE = major adverse cardiac event; POT = proximal optimization technique; TLR = target lesion revascularization.
|
 | Figure 3Comparative unadjusted HRs of TLR for subgroups in all population. There was a significant interaction between the use of POT and TLR according to the presence or absence of final kissing ballooning.HR = hazard ratio; FKB = final kissing ballooning; POT = proximal optimization technique; TLR = target lesion revascularization.
|
The impact of POT in patients treated without kissing ballooning
In patients who did not undergo kissing ballooning, the proximal MV MLD was significantly greater in the POT group compared to that in the non-POT group (3.46±0.56 mm, 3.27±0.61 mm, p=0.001). In contrast, there was no difference between the two groups in patients treated with kissing ballooning (3.59±0.58 mm, 3.61±0.60 mm, p=0.76). POT was associated with a significantly lower risk of MACE and TLR than was the non-POT group (MACE: 2.0% vs. 10.5%, HR, 0.20; 95% CI, 0.06–0.63; p=0.01 and TLR: 0.7% vs. 8.5%, HR, 0.08; 95% CI, 0.01–0.57; p=0.01). This result was consistent after additional propensity-score matching between the POT and non-POT groups (Table 5).
Table 5
Clinical outcomes in patients without kissing ballooning during follow-up period

Values are presented as number (%).MACEs included cardiac death, recurrent myocardial infarction, and TLR. Please see the notes for Table 4.
CI = confidence interval; HR = hazard ratio; MACE = major adverse cardiac event; MV = main vessel; POT = proximal optimization technique; SB = side branch; TLR = target lesion revascularization.
![]()
DISCUSSION
This study has several key findings. The POT group had better clinical outcomes than the non-POT group. This result was mostly driven by the lower TLR rate in the POT group compared to that in the non-POT group, which was maintained in propensity-matched populations. The improved results with POT were specific to patients who did not undergo kissing ballooning. In those treated with kissing ballooning, POT showed no additional clinical benefit.
We investigated the impact of POT on the clinical outcomes compared to strategies treated without a POT in a large-scale bifurcation registry. In this study, the POT was associated with better clinical outcomes, which was mostly driven by the lower TLR rate in MV. The mechanism of the lower TLR rate must have been associated with the better expansion of the proximal MV and better circularity, as suggested in the bench test. Particularly, in recent published study, use of intravascular ultrasound enables POT to optimize provisional stenting by expanding the proximal and bifurcation stent segments symmetrically in patients with coronary bifurcation lesions.11) However, quantitative coronary angiographic analysis did not show a significant difference in the MLD of the proximal MV after the procedure. The discrepancy between the clinical outcomes and results of quantitative coronary angiographic analysis may be explained by the better apposition and circularity of the stent by the POT. However, these outcomes were not assessed in this study. Another possibility is that quantitative coronary angiographic analysis may not be sensitive enough to reveal the further expansion of the stent by post-dilation. A previous study showed that further stent expansion after a high pressure post-dilation was demonstrated by intravascular ultrasound, but was not captured by quantitative coronary angiographic analysis.12) In this study, we also did not measure the post-procedural MV reference diameter, which can be enlarged after the POT. In addition, kissing ballooning affects proximal MV stent expansion, which obscures the effect of POT on the MV stent expansion in quantitative coronary angiographic analysis. The quantitative coronary angiographic analysis in patients treated without kissing ballooning demonstrated a significantly larger MLD of the proximal MLD in the POT group compared to that of the non-POT group.
The clinical benefit of POT was consistent across various subgroups with no significant interaction, except when kissing ballooning was performed. The benefit of POT was only found in patients who were not treated with kissing ballooning. This interaction was significant. Quantitative coronary angiographic analysis showed that there was a larger proximal MV MLD in the POT group compared with that in the non-POT group; however, this result was also only true in patients who did not undergo kissing ballooning. This result suggests that the benefit of kissing ballooning and POT may share the same mechanism, with better stent expansion in the proximal MV. A previous study demonstrated that final kissing ballooning was associated with a lower TLR, which was explained by better expansion of the MV stent.13) In patients treated with kissing ballooning, the proximal portion of the MV stent was already well expanded. Additional expansion by the POT was not possible, which explains why the POT was not effective in improving clinical results in these patients. One of the benefits of POT, compared to kissing ballooning, is the better circularity of the MV stent. However, the benefit of stent circularity has never been tested with regard to clinical outcome. There is no clinical benefit of POT in patients treated with kissing ballooning. This finding suggests that the circularity of the MV stent may not be a major contributing factor to clinical outcomes.
Our study has several limitations. First, the registry data were not randomized, which could have exposed the study results to selection bias. Several baseline characteristics were significantly different between the groups. The decision to perform POT in each patient was made at the operator's discretion. We performed propensity score-matched analysis to adjust for potential confounding factors. However, we were not able to correct for unmeasured variables. A second limitation is that we could not determine the relationship between binary restenosis and TLR because angiographic follow-up and TLR were performed according to each institution's strategy and at each operator's discretion. In addition, the TLR rate might be underestimated because routine follow up angiography was not performed in all institutions. Third, given the observed clinical event rates, the study was considerably underpowered and subgroup analysis was not conclusive. Fourth, although we do not have a standard procedure protocol for the treatment of coronary bifurcation lesion due to the nature of retrospective study from 18 major coronary intervention centers, technical aspects such as SB dilation before kissing ballooning and rePOT after SB post-dilation can influence the results. Finally, further trials are needed to evaluate the outcomes of POT with second- or third-generation stents.
In conclusion, in coronary bifurcation lesions with large SBs, POT may be beneficial to improve long-term clinical outcomes, particularly in patients treated without kissing ballooning during the procedure. A large-scale randomized trial is needed to substantiate these findings.
 XML Download