

 PDF
PDF ePub
ePub Citation
 Print
Print


INTRODUCTION
Cancer treatment alters the nutritional status and body composition of growing children and adolescents, and these changes can affect physical growth, disease course, and clinical outcomes in pediatric cancer patients [12].
Because poor nutritional status was previously reported to be related to poor outcomes in children with cancer [34], previous studies have focused mainly on undernutrition [567]. However, recently, not only undernutrition but also overnutrition that can cause excessive fat gain has also been proposed to affect the clinical outcome of cancer patients [12]. Butturini et al. [8] reported that survival rate was significantly reduced in 343 obese children out of 4,260 patient with acute lymphoblastic leukemia (ALL). Thus nutritional status and body composition of cancer patients need to be analyzed on the emphasis of body fat changes during cancer treatment [12].
The application of dual energy X-ray absorptiometry (DXA) may be a more useful and accurate method than anthropometry to evaluate body composition, especially body fat mass and percentage, of cancer patients in both clinical practice and research [910]. However, most previous studies used only simple anthropometric measurements such as weight, height, body mass index (BMI), mid-upper arm circumference, and skinfold thickness and provided limited interpretations on changes in nutritional status and body composition in cancer patients [3679].
In addition, previous studies reporting significant changes in body composition of cancer patients were mostly adult studies, the results of which cannot be directly applied to childhood cancer patients [91112]. According to these adult studies, the changes in body composition during the disease course tended to heterogeneous according to the type of underlying malignancies or cancer therapy regimens [91112].
To date, there are a few studies on body composition changes in pediatric cancer patients during cancer treatment, which have some limitations because only anthropometric measurements were used or body composition was measured not evaluating changes [9131415]. Furthermore, the type of underlying malignancies, in which treatment modalities are different, was considered in only one study [15].
Therefore, this prospective study aimed to evaluate short- and long-term changes of body compositions, particularly focused on body fat percentages, in pediatric cancer patients during the first year of cancer treatment using a DXA in addition to anthropometric measurement. And, we also aimed to compare the differences in body composition changes over time in different pediatric cancer groups (i.e., hematologic malignancies and solid tumors).
SUBJECTS AND METHODS
Subjects
Children with newly diagnosed cancers who were treated with chemotherapy between September 2012 and October 2014 were recruited in this prospective study for a longitudinal assessment of nutritional status and body compositions during the first year of cancer treatment as described in our previous study involving the same pediatric cancer cohort [16]. Patients with relapsed cancer were excluded from the study to eliminate the confounding effect of previous chemotherapy.
A total 30 (21 boys and 9 girls) pediatric cancer patients and 30 age and gender matched controls were enrolled. The control group included healthy individuals without cancer or any other underlying organic diseases selected from the outpatient department if they/their parents agreed to participate in the study.
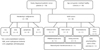
Pediatric cancer patients were divided into the following two groups: hematologic malignancies (n = 19) and solid tumors (n = 11) (Fig. 1). The 19 hematologic malignancies consisted of ALL (n = 8), acute myelogenous leukemia (AML; n = 4), lymphoma (n = 6), and Langerhans cell histiocytosis (LCH; n = 1). Of the 11 solid tumors, there were 3 osteosarcomas, 2 brain tumors, 1 neuroblastoma, 1 Wilms tumor, 1 rhabdomyosarcoma, 1 Ewing sarcoma, 1 mesenchymal chondrosarcoma, and 1 solid pseudopapillary tumor of the pancreas.
Cancer therapy protocols
All cancer patients were treated based on pediatric cancer protocols consisting of multiple chemotherapeutic agents for 6–12 months before the final assessment at the outpatient clinic for pediatric cancer patients.
Patients with ALL, lymphoma, and LCH received 40–60 mg/m2 of prednisolone daily for 4–6 weeks of the induction period. The total cumulative dose of corticosteroid was 1.2–5.9 g/m2 during 6–12 months of treatment. For solid tumor cases, including osteosarcoma, methotrexate (48.0–84.0 g/m2) and ifosfamide (9.0–63.0 g/m2) were administered. Busulfan- or melphalan-based conditioning regimens without total body irradiation were used in patients who underwent allogeneic or autologous hematopoietic stem cell transplantation.
Anthropometry
Body weight was determined to the nearest 0.1 kg using a calibrated digital scale, and height was measured to the nearest 0.1 cm on a standard height board. Abdominal circumference (AC) was measured twice using a tapeline at the maximum waist girth at umbilicus level in standing position [17].
BMI was calculated as weight (kg) divided by height square (m2). Weight, height, and BMI z scores were calculated using the least mean squares method adjusted for age and gender based on the 2017 Korean National Growth Charts [18].
Dual energy X-ray absorptiometry
Body composition was measured using a whole body DXA scanner (Lunar Prodigy, General Electric Medical systems, Madison, WI, USA). Body composition was quantified based on body tissue absorption of photons that are emitted at two energy levels. Body weight (body mass) was stratified into bone mineral, fat-free mass (FFM), and fat mass (FM) using the enCORE version 13.6 (General Electric Medical systems, Madison, WI, USA). Body fat percentages in the whole body, trunk, and extremities were automatically calculated and expressed as percentages. Each patient underwent DXA scanning for about 15 minutes in supine position without any movement in accordance with the manufacturer's recommendations as described in our previous study [16]. DXA measurements were performed at baseline (before initiating cancer treatment) and 1, 6, and 12 month(s) of chemotherapy in all recruited pediatric cancer patients. DXA was measured once at the first visit in the control group and compared with the baseline values from cancer patients.
Statistics
SPSS version 22.0 (IBM Corp., Armonk, NY, USA) was used for data analyses. All nonparametric continuous values were expressed as a median (range). The Kruskal-Wallis method was used for nonparametric analysis of continuous variables among the three groups. Wilcoxon paired t tests were used for analyzing the changes in the median BMI z scores and body fat percentages between different time intervals [i.e., baseline and 1 month, 1 and 6 month(s), and 6 and 12 month(s)] in children with pediatric cancer regardless of cancer group. Multiple regression analyses were used to evaluate factors affecting body fat composition of the subjects. Generalized estimation equation (GEE) analyses were used to show the trends of body composition changes after short- and long-term follow up. The level of significance was set at P < 0.05.
RESULTS
Patient characteristics
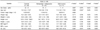
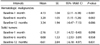
The clinical features of the pediatric cancer patients (mean age, 10.9 ± 3.8 yrs) and the healthy controls are listed in Table 1. There were no significant differences in demographic parameters, such as age and sex, at baseline among the three groups (i.e., hematologic malignancies, solid tumors, and healthy control groups). Anthropometric parameters (i.e., weight, height, BMI, AC, and z scores of weight, height and BMI) at baseline were also not different among the three groups (Table 1).
Body compositions at baseline
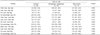
Comparisons of body composition parameters, measured by DXA, among the hematologic malignancy, solid tumor, and control groups at baseline are shown in Table 2. The leg FFM was different among the three groups (P = 0.011; Table 2). However, there were no other differences in FFM, FM, or fat percentage among groups.
Changes in weight for age (WFA) z scores and BMI z scores
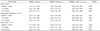
There were no significant changes in WFA z scores between the different time intervals (i.e., baseline and 1 month, 1–6 month(s), and 6–12 months) in each pediatric cancer group during the first year of cancer treatment (Table 3).
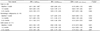
The initial median BMI z score of −0.31 (range: −1.85 – 1.85) at initial diagnosis increased to 0.04 (−1.74 – 2.39) after 1 year of cancer treatment; however, this change was not statistically significant (P = 0.523). There were also no significant changes in BMI z scores between the different time intervals in each pediatric cancer group during the first year of cancer treatment (Table 4).
Changes in body composition
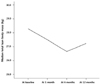
Although the total body mass did not change significantly during the first month of cancer treatment (P = 0.304), the total median FFM significantly decreased from 27.4 kg (range, 11.5 – 53.5 kg) to 26.9 kg (14.4 – 50.6 kg, P = 0.008). The total FFM significantly increased from 26.0 kg (12.0 – 52.4 kg) at 6 months to 27.2 kg (13.6 – 54.1 kg) at 12 months of cancer treatment (P < 0.001; Fig. 2).
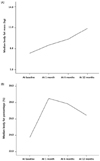
In contrast, the total median FM and body fat percentage increased significantly from 7.2 kg (1.8 – 21.5 kg) to 9.2 kg (2.1 – 21.5 kg, P = 0.000; Fig. 3A) and 21.4% (5.9 – 42.0%) to 25.8% (9.5 – 43.3%, P = 0.002; Fig. 3B), respectively, during the first month. However, there were no significant changes in the total FM or fat percentages between time intervals (i.e., 1 to 6 months and 6 to 12 months) after 1 month of cancer treatment (all P > 0.05; Fig. 3A and 3B). There were significant changes in the fat percentage of the extremities and trunk during the first month of cancer therapy (P < 0.001 and P < 0.001, respectively).
Changes in body fat percentage in each pediatric cancer group
The median body fat percentage in children with hematologic malignancies significantly increased from 20.0% (12.6 – 41.7%) to 27.4% (14.5 – 43.3%) during the first month of cancer treatment (P = 0.003; Table 4). However, there were no significant changes in body fat percentage between 1 and 6 month(s) and 6 and 12 month (s) after initiating cancer treatment (P = 0.449 and P = 0.196, respectively; Table 5).
In children with solid tumors, significant changes in body fat percentage were also observed between baseline and 1 month of follow-up (P = 0.007; Table 4), although no significant changes in body fat percentage were observed between 1 and 6 month(s) and 6 and 12 months of follow-up (P = 0.192 and P = 0.402, respectively; Table 5).
Trends in body fat percentage in each pediatric cancer group
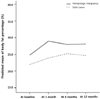
The trends for changes in mean body fat percentage between baseline and 1, 6, and 12 month(s) after initiating cancer treatment in each group pediatric cancer group are shown in Fig. 3. In children with hematologic malignancies, there was a significant upward trend in body fat percentage between baseline and at each follow-up period during the first year, especially the first month, of cancer treatment (Fig. 4 & Table 6). However, there were no significant upward trends for changes in body fat percentage during the first year of treatment in children with solid tumors (Fig. 4 & Table 6).
DISCUSSION
In the present study, we first prospectively evaluated the trends of body composition changes during the first year of cancer treatment in pediatric cancer patients. At baseline, there were no differences in anthropometric (i.e., weight, height, BMI z scores, and AC) and DXA-based body composition (i.e., FFM, FM, and body fat percentage) measurements among the 3 groups (i.e., hematologic malignancies, solid tumors, and healthy control group). However, a decrease in the total FFM and no change in the body weight were observed during the first month of follow-up after initiating cancer treatment. The FFM recovered during the interval between 6 and 12 months, while the total FM and body fat percentage increased significantly during the first month without significant changes after 1 to 12 month(s). This rapid increase in body fat during the first month of cancer therapy was obvious in both the extremities and trunks of our study subjects.
According to previous studies, most cancer patients undergoing cancer therapy experience diverse body composition changes during the disease course. Breast and prostate cancer patients may gain body fat and lose lean body mass (LBM), while lung and colon cancer patients may have an accelerated loss of LBM [9]. In previous studies regarding body composition changes, no significant net body weight or BMI changes during chemotherapy were observed in breast cancer patients because the LBM mass decreased while the FM increased or vice versa [1112]. Even in our study of pediatric cancer patients, the decrease in LBM and increase in FM and body fat percentage during the first month occurred without any significant body weight or BMI changes. These findings may suggest that body composition measurements focused on the change of each body compartment (e.g., FM and FFM) rather than changes in body weight or BMI based on anthropometric measurement may provide more accurate information about body composition changes during cancer treatment in children.
In the present study, a significant decrease in LBM was observed during the first month, which later recovered between 6 and 12 months, while body fat dramatically increased during the first month without any additional significant increase in body fat afterwards. There have been several studies regarding short- and long-term body composition changes in pediatric cancer patients during cancer treatment [210131415]. According to a prospective cohort study by Brinksma et al. [15], body weight, BMI, and FM increased during the first 3 months of follow-up after initiating treatment. However, FFM, which was already low at diagnosis, remained low during the disease course. These findings also suggest that body composition changes, mainly those related to body fat, in pediatric cancer patients develop particularly in the early stage of cancer treatment as well as cancer-related cachexia [19]. There was no relationship between energy intake or corticosteroid therapy and the increase in BMI or body fat, and the authors suggested that tube feeding and decreased physical activity might be associated with increases in BMI and body fat [15]. However, in our study, the increase in body fat occurred mainly during the first month, and no patients received nutritional support via tube feeding. Therefore, further explanations for this phenomenon of body fat change in children with cancer are required and possible explanations for this change in pediatric cancer patients may be the combination of several factors such as imbalanced diet during the initial period of cancer therapy, immobilization or decreased physical activity, and intensive chemotherapy in conjunction with corticosteroids, all of which may gradually resolve during the second half year after initiating cancer treatment.
In the present study, we also evaluated and compared the differences in short- and long-term body composition changes over time between patients with hematologic malignancies and solid tumors. A significant increase in body fat was observed in both groups during the first month of cancer treatment, but not afterwards. When additional statistical analysis was conducted using GEE, a significant upward trend for body fat changes was observed during the first year of cancer treatment in children with hematologic malignancies, but not in those with solid tumors. Early changes of increased adiposity may be related to high calorie diet, immobilization, and therapeutic regimens including corticosteroids, especially in children with hematologic malignancies. However, emetogenic chemotherapy agents administered in children with solid tumors lead to adverse effects that may countervail an increase in adiposity during the early stages, such as intense vomiting and poor oral intake.
As described in our study, underlying cancers with different treatment modalities seem to make differences between different pediatric cancer groups. According to a previous report in 15 children with hematologic malignancies, a significant increase in the BMI z scores of cancer patients was observed at the 1-year follow-up, at 6-month intervals, compared to healthy controls [14]. The increase in FM and LBM was both higher in children with hematologic malignancies than healthy controls in this previous study; however, the increase in body fat percentage and the decrease in LBM percentage were relatively higher in pediatric cancer patients compared to those of healthy controls [14]. However, according to a study in children and young adults with solid tumors (i.e., Ewing sarcoma and osteosarcoma), body weight and BMI decreased dramatically during treatment and then recovered during the follow-up until 24 months [13]. These findings suggested that there is a risk of undernutrition during multimodality cancer therapy for children with solid tumors, but they will recover to normal after active anti-cancer therapy [13]. In another study that evaluated children with hematologic malignancies and solid tumors, weight changes (weight gain or loss) of > 5% were common in both cancer groups within the first 3 months, whereas weight gains were more prevalent in both groups between 3 to 12 months [15]. According to these limited findings, further research regarding heterogeneous body composition changes in pediatric cancer patients based on their underlying malignancies is warranted.
Based on previous reports, body composition changes, such as a tendency to gain body fat, especially in the trunk, and reduced LBM, may result in overweight or obesity-related complications after the cessation of cancer therapy and in later life [1020212223]. According to a report from the Children's Oncology Group, the beginning of maintenance therapy was suggested to be the best time to intervene with nutritional and behavioral interventions to reduce the risk for obesity in pediatric cancer patients [22]. However, based on the results from our study, individualized dietary and behavioral strategies along with cancer therapy starting at a very early stage of cancer treatment and continuing through the disease course might be more appropriate to prevent excessive fat gain and loss of LBM during cancer treatment and to improve outcomes later in life in pediatric cancer patients.
Our study has some limitations. First, although it is a prospective cohort study, this study was conducted in a small study sample with 30 cancer patients and 30 controls. Second, a variety of underlying cancers were included, which were classified as two main cancer groups of smaller numbers. Therefore, statistical analysis was performed using nonparametric statistical analysis to overcome these limitations. Third, because there were some barriers in obtaining data on energy intake of the subjects, the explanations for changes in body composition are to some extent limited in this study, requiring further studies.
In conclusion, significant changes in body composition were observed during the first year of cancer treatment, especially during the first month after initiating treatment. A rapid increase in body fat and a decrease in LBM, particularly in children with hematologic malignancies, were observed. Therefore, individualized nutritional strategies based on body composition changes and body fat gaining according to the underlying cancer type are needed during the early period of cancer treatment in children for better clinical outcomes.

 XML Download