

 PDF
PDF ePub
ePub Citation
 Print
Print


INTRODUCTION
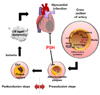
A subset of coronary heart disease (CHD), myocardial infarction (MI) is a consequence of irreversible heart damage. The damage results from the extensive death of myocardial cells, and is attributed to prolonged ischemia with or without reperfusion, generated by occlusion of the coronary arteries. Progression to MI can be divided into the preocclusion and postocclusion steps [1234] (Fig. 1).
In the preocclusion steps, atherosclerosis results in narrowing of the arteries, which, in turn, is triggered by major risk factors such as hypertension, hypercholesterolemia, and diabetes [56]. These risk factors exert oxidative stress on the endothelium resulting in endothelial dysfunction, which permits low-density lipoprotein (LDL) to enter the intima [789]. The LDL absorbed is oxidized and then engulfed by macrophages, which transform into foam cells. Proliferation of the foam cells leads to plaque formation, resulting in narrowing of the arteries. Overall, this is a slow process and usually takes several decades [10]. Previous studies have demonstrated the efficacy of psyllium seed husk (PSH) consumption in reducing risk factors such as hyperlipidemia [11,12,13], diabetes [14], and hypertension [1516], thereby inhibiting the preocclusion steps (Fig. 1).
In the postocclusion steps, abrupt rupture of the plaques results in clot formation which, in turn, occludes the artery and results in myocardial ischemia. The resultant ischemia greatly reduces ATP generation and produces excessive reactive oxygen species (ROS) from the cytosol and mitochondria when coupled with reperfusion, in particular. Consequently, myocardial cells get damaged and die through necrosis and apoptosis, including generation of caspase 3 from procaspase 3, subsequently leading to MI. ROS, including superoxide anion (O2-) and hydrogen peroxide (H2O2), is mainly generated in the mitochondria [17]. ROS reacts with polyunsaturated fatty acids (PUFA) such as cardiolipin (a mitochondrial lipid), resulting in the production of toxic byproducts such as 4-hydroxy-2-nonenal (HNE) and malondialdehyde (MDA) [17]. ROS levels are reduced by the transformation of O2- to H2O2 by superoxide dismutase (SOD) [18], followed by the conversion of H2O2 into innocuous water by a catalase reaction [18]. On the other hand, 4-hydroxynoneal (HNE) is removed by glutathione S-transferase (GST) through conjugation with glutathione [19]. Antioxidant enzymes, including SOD, catalase, and GST, are target genes of the transcription factor nuclear factor erythroid 2-related factor 2 (NRF2), which attach to the binding sites on promoters of the target genes, thereby upregulating transcription of the antioxidant enzymes [2021]. In addition, several proteins located upstream of NRF2 in the apoptotic cascades such as sirtuins [22], cAMP response element-binding protein (CREB) [23], and protein kinase A (PKA) [24], are involved in modulating myocardial I/R injury. This is a fast process and usually takes only several days for humans [25].
In our previous study, we demonstrated that administration of arabinoxylan (AX; a major cell wall polysaccharide of wheat consisting of arabinose and xylose), arabinose itself, as well as hot water extract of ground wheat, reduces myocardial injury at the postocclusion steps in a rat MI model [26]. Our findings implicate that any foods containing high levels of AX may be efficacious in preventing MI through the action of arabinose during the postocclusion steps. To test the hypothesis, we conducted a literature search and chose PSH (soluble dietary fiber) as a candidate since PSH is rich in AX (approximately 60 wt% of PSH) and yields approximately 20 and 46 wt% of arabinose and xylose, respectively, when hydrolyzed [27]. Based on these findings, we undertook to investigate whether PSH supplementation for 3 d reduces the myocardial injury in a rat model of MI where the left anterior descending coronary artery (LAD) was occluded for 30 min through ligation, and then reperfused for 3 h through release of ligation. We further investigated whether PSH supplementation reduces the myocardial injury by inhibiting the apoptotic cascades, including PKA to caspase-3 (CASP3). This study provides some evidence indicating that PSH is able to prevent MI by inhibiting only the postocclusion steps, since the 3 d period chosen to supplement PSH is too short to affect the preocclusion steps which usually takes several decades [10] (Fig. 1).
MATERIALS AND METHODS
Materials
PSH was purchased from Pharmatech Korea (Yongin, Gyeonggi-do, Republic of Korea). Other reagents were purchased from Sigma-Aldrich (St. Louis, MO, USA), unless stated otherwise. PSH was analyzed to contain approximately 66% AX and 21% arabinose (wt/wt) [28].
Animals
Eight-week-old male Sprague Dawley (SD) rats were purchased from Samtaco Inc. (Osan, Gyeonggi-do, Republic of Korea). Experiments were carried out according to the protocols for animal care and use of laboratory animals, approved by the Institutional Animal Care and Research Advisory Committee of Catholic University, Daegu, South Korea (No. DCIAFCR-151230-20-Y). Animals were housed with food and water available ad libitum under diurnal lighting conditions and in a temperature-controlled environment until the start of the experiment.
Diet Preparation
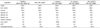
A diet containing PSH was prepared as previously described [129]. To prepare 1 kg each of the 1, 10, or 100 mg/kg PSH diets, mixtures of 0.02 g PSH + 49.98 g corn starch, 0.2 g PSH + 49.8 g corn starch, and 2 g PSH + 48 g corn starch were added, respectively, to 950 g of a modified AIN-93G diet purchased from Unifaith Inc. (Seoul, Republic of Korea) (Table 1). To prepare 1 kg of the basal diet, 50 g of corn starch was added to 950 g of the modified AIN-93G diet.
Diet administration
PSH diets and basal diet were supplied to the rats as described previously [129]. Briefly, the rats were randomly assigned to one of the five groups: (1) sham (n = 6), (2) control (n = 6), and (3) PSH-treated group (1, 10, or 100 mg/kg per day) (n = 6 per group). In the PSH-treated group, the rats (approximately 300 g weight) received 15 g/d of PSH diet (1, 10, or 100 mg/kg/d PSH per rat) for 3 d before ligation. Once the rats consumed the requisite PSH diet each day, more basal diet was provided ad libitum. Rats in the control and sham groups received the basal diet only.
Myocardial infarction model
Ischemia/reperfusion injury was generated through ligation of the LAD followed by release of the ligation, as described previously [129]. Briefly, the male SD rats (~300 g) were anesthetized through intramuscular injections of ketamine (100 mg/kg) and xylazine (5 mg/kg), intubated, and ventilated with air throughout the experiment. The heart was then exposed by a left thoracic incision, and the LAD of the rats in the PSH-treated group was ligated for 30 min approximately 5 mm below the aortic origin, by passing a 5-0 Prolene suture (BV-1, Ethicon, Somerville, NJ, USA) and double-knotting the suture. Occlusion generated through the ligation was confirmed by observing development of a pale color in the left ventricular wall. Subsequently, the heart was reperfused for 3 h by releasing the ligation. Rats in the sham group underwent the same experimental procedure, but without ligation. During surgery, the rectal temperature was maintained at 37 ± 0.5℃ using a thermostat-controlled warming plate (Harvard Apparatus, Holliston, MA, USA).
Assessment of the infarct size
The infarct size (IS) was assessed through 2,3,5-triphenyltetrazolium chloride (TTC) staining, as described previously [129]. After the I/R procedure, the LAD was re-ligated, and 1 ml of 1% Evans blue dye (Sigma-Aldrich, St. Louis, MO, USA) was infused into the heart through the jugular vein. Next, the rats were euthanized by thoracotomy under anesthetization. The heart was harvested, excised into 4 pieces approximately 3-mm thick, which were subsequently stained with TTC. The area at risk (AAR) is defined as the area not infiltrated by Evans blue dye. The infarct area (IA) is defined as the area not stained with TTC. The border zone area (BZA) is defined as the area in which the IA is excluded from the AAR (AAR-IA). The AAR, IA, BZA, and left ventricular area (LVA) were determined by computerized planimetry using ImageJ software (NIH, v1.47). Using these areas, we calculated the IS and risk size (RS), which are defined as the percentage of IA to AAR and AAR to LVA, respectively.
Western blotting
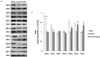
Western blotting was performed for the pieces of the hearts harvested, as described previously [1]. Briefly, the harvested pieces were lysed with radioimmunoprecipitation assay (RIPA) buffer (Cell Signaling, Beverly, MA, USA) containing protease inhibitor cocktail. Equal quantity of protein extracts in the supernatant were separated on sodium dodecyl sulfate (SDS)-polyacrylamide gels, transferred to polyvinylidene fluoride (PVDF) membranes (Bio-Rad Laboratories, Inc., Hercules, CA, USA), and blocked with 5% skim milk, prior to incubation with each primary antibody. The primary antibodies used were cleaved CASP3 (C-CASP3, also expressed as CASP3), BCL-2, BAX, CREB, phosphorylated CREB (pCREB), superoxide dismutase 2 (SOD2), sirturin 1(SIRT1),, SIRT2, SIRT3, SIRT5, SIRT6, and SIRT7 (1:1000, Cell Signaling, Beverly, MA, USA), PKAβ and SIRT4 (1:1000, Abcam, Cambridge, MA, USA), NRF2 (1:1000, Enzo, Farmingdale, NY, USA), glutathione S-transferase mu 2(GSTM2) (1:400, USCN Life Science Inc., Houston, Texas, USA), and ERK1 (1:1000, Santa Cruz Biotechnology Inc., Santa Cruz, CA, USA). The probed membranes were then incubated with the horseradish peroxidase-labeled secondary antibodies (1:2000, Enzo, Farmingdale, NY, USA) and subsequently developed with enhanced chemiluminescence (ECL) substrate solution (Thermo Fisher Scientific, Rockford, IL, USA) using ChemiDoc XRS Gel Imager (Bio-Rad Laboratories, Inc., Hercules, CA, USA). Intensities of the protein bands were quantified using the ImageJ software (NIH, v1.47). In the quantitative analysis, ratios between various combinations of proteins and phosphorylated proteins were presented using ERK1 as a loading control by setting the control group value (0 mg/kg/d of PSH) at 1.
Statistical analyses
The values are expressed as the means ± standard error of the mean (SEM). Statistical analyses were performed using the SPSS software (IBM SPSS Statistics; version 19, Armonk, NY, USA). Shapiro-Wilk test and Levene's test were used to test all variables for normal distribution and homogeneity of variances, respectively. A one-way ANOVA followed by the post hoc test was used to compare changes in infarct size and western blot analysis. The statistical significance was set as P < 0.05.
RESULTS
PSH supplementation reduces infarct size
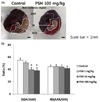
Using a rat I/R model, we first undertook to determine whether PSH supplementation protects against myocardial injury at the postocclusion steps. Our previous study showed that supplementation with 5 mg/kg/d of AX was enough to exert efficacies [26]. As 10 mg/kg/d of PSH is equivalent to 5 mg/kg/d of AX, considering that PSH contains approximately 50% AX, we tested various dosages of PSH supplementation, including 10 mg/kg/d of PSH (1, 10, or 100 mg/kg/d), to find a minimum efficacious dosage. The rats were fed diets supplemented with PSH for 3 d, after which they were subjected to 30 min ischemia through ligation of LAD, followed by 3 h reperfusion through release of the ligation. Finally, the heart was harvested, cut into four slices, and stained with TTC (Fig. 2A). AAR, IA, and BZA were defined as the area without infiltration of Evans blue dye, the area without TTC stain, and the area equivalent to (AAR-IA), respectively (Fig. 2A). To determine whether PSH supplementation reduces myocardial injury, we assessed the infarct size (IS, the ratio of IA to AAR), which represents degree of cell death in the AAR. We observed that supplementation with 10 or 100 mg/kg/d significantly reduces the IS, compared with the control group (39.8 ± 3.3 and 38.3 ± 4.9%, respectively, versus 55.1 ± 3.5%; P < 0.05) (Fig. 2B). To confirm reproducibility of the experiments, we next assessed the risk size (RS, the ratio of AAR to LVA). The RS of PSH-treated groups was not significantly different from that of the control groups (P > 0.05), indicating that the surgical procedure to generate I/R injury was reliable (Fig. 2B). Taken together, these results indicate that PSH intake over certain dosages protects against I/R injury during the postocclusion steps.
PSH supplementation reduces apoptosis
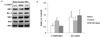
As AX supplementation reduces myocardial injury by inhibiting apoptosis [26], we investigated whether PSH supplementation also protects against myocardial injury by inhibiting apoptosis, using CASP3 as a biomarker [30]. Supplementation with PSH (100 mg/kg/d) tends to reduce levels of CASP3 (cleaved CASP3 generated from procaspase-3) as compared with the control group, suggesting that PSH supplementation results in decreased apoptosis (Fig. 3A and 3B). To support the conclusion, we investigated whether PSH supplementation modulated the expression of BCL-2 and BAX, which are located upstream of CASP3 in the apoptotic cascade [31]. We observed that PSH supplementation tended to increase the ratio of BCL-2 with anti-apoptotic activities, and BAX with pro-apoptotic activities (BCL-2/BAX) as compared to the control group, suggesting that PSH supplementation contributes towards inhibiting apoptosis (Fig. 3B) [3132]. Taken together, our results indicate that PSH intake protects against myocardial I/R injury by inhibiting the apoptotic cascades.
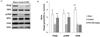
PSH supplementation upregulates expression of antioxidant enzymes through NRF2
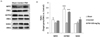
We next investigated whether PSH supplementation upregulates the levels of GSTM2. PSH supplementation significantly upregulated GSTM2 expression compared with the control group (Fig. 4A and 4B). In addition, PSH supplementation tended to upregulate the SOD2 expression, which is responsible for the removal of O2- in the mitochondria. These results indicate that PSH supplementation eliminates ROS through upregulation of antioxidant enzymes. As both GSTM2 and SOD2 are target genes of NRF2 transcription factor [2021], we investigated whether PSH supplementation upregulates NRF2 expression, and observed significant increase in NRF2 expression compared with the control (Fig. 4B). Taken together, our results indicate that PSH supplementation promotes the NRF2 expression, which contributes to upregulating gene expression of antioxidant enzymes.
PSH supplementation upregulates expression of sirtuins
The effect of PSH supplementation was investigated on the modulation of gene expression of sirtuins (Fig. 5A). Of the known sirtuins (1–7), SIRT5 (a mitochondrial sirtuin), and SIRT6 and SIRT7 (nuclear sirtuins) [22] were significantly upregulated by PSH supplementation (Fig. 5B). These results suggest that PSH supplementation upregulates some sirtuin genes, which might contribute to upregulating the NRF2 expression.
PSH supplementation promotes phosphorylation of CREB and upregulates expression of protein kinase A (PKA)
Finally, we investigated whether PSH supplementation increases the pCREB level (Fig. 6A). Indeed, PSH supplementation resulted in significant increases in the pCREB level compared to the control, although CREB levels remained unaffected (Fig. 6B). Moreover, as phosphorylation of CREB is mediated by PKA [33], we investigated whether PSH supplementation modulates the PKA expression. PSH supplementation significantly increases PKAβ, a catalytic subunit of PKA, compared to the control (Fig. 6B). Taken together, the results indicate that PSH supplementation upregulates PKA expression, which contributes to enhancing the phosphorylation of CREB.
DISCUSSION
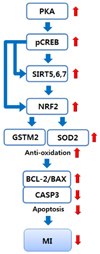
In this study, we determined that PSH supplementation reduces myocardial I/R injury by inhibiting the apoptotic cascades through reduction of CASP3 generation and increase of BCL-2/BAX ratio in a rat I/R model. Inhibition of apoptosis might be mediated by from upregulation of PKA expression to reduction of CASP3 generation (Fig. 7). In the cascades, PSH supplementation first upregulates the PKA expression, which contributes to the enhancement of CREB phosphorylation to generate pCREB. This theory is supported by previous studies which have reported that higher levels of PKA [24] and pCREB [23], and activation of PKA-CREB axis [34] are associated with myocardial protection against I/R injury by inhibiting apoptosis through reduction of CASP3 generation and increase of BCL-2/BAX ratio. Therefore, our studies indicate that PSH supplementation contributes to myocardial protection by upregulation of PKA expression and enhancement of CREB phosphorylation. Of the 7 mammalian sirtuins (1–7), PSH supplementation upregulates the expression of SIRT5, SIRT6, and SIRT7. These findings indicate that PSH enhances the NAD+-dependent deacetylation of proteins including histones, in both mitochondria and nuclei, since SIRT5 is located in the mitochondria, and SIRT6 and SIRT7 are located in the nuclei [22]. Furthermore, it has been reported that higher levels of SIRT6 protect against myocardial I/R injury by inhibiting apoptosis through reduction of ROS generation, due to the upregulated antioxidant enzymes such as SOD2 [35]. In addition, higher levels of SIRT7 contribute to enhancing wound healing through increased scar formation after MI [36]. Finally, higher levels of SIRT5 protect the cardiomyocytes from oxidative stress by inhibiting apoptosis [37]. Taken together, PSH supplementation upregulates expression of some sirtuins such as SIRT5, SIRT6, and SIRT7, which contributes to protecting against myocardial I/R injury through elimination of ROS and subsequent enhancement of wound healing. Upregulation of the sirtuins through PSH supplementation might be mediated by binding of pCREB to the binding site CRE located on promoters of the sirtuins (SIRT6 gene promoter has putative pCREB binding site) [38] (Fig. 7). PSH supplementation also upregulates the expression of NRF2 and its target genes such as GSTM2 and SOD2 [2021]. In our previous study, we showed that supplementation with wheat extract (WE) containing AX as an active component reduces the MDA generation and upregulates GSTM2 [26]. SOD2 is involved in removing O2- in the mitochondria through conversion of O2- into H2O2 [18]. On the other hand, GSTM2 is involved in detoxification of HNE and MDA, the peroxidative byproducts of PUFA attributed to ROS, through conjugation of the byproducts with glutathione [19]. In addition, NRF2 expression is regulated by SIRT6 [3940] through deacetylation of histones [41]. The NRF2 gene promoter also has the pCREB binding site, implicating that CREB is also involved in the upregulation of NRF2 gene expression [42]. Taken together, these findings suggest that PSH supplementation upregulates NRF2 expression by pCREB and the sirtuins, which in turn results in upregulation of antioxidant enzymes and subsequent elimination of ROS toxicity (Fig. 7). Based on these results, we propose that PSH supplementation protects against myocardial I/R injury through upregulation of PKA expression, CREB phosphorylation, sirtuin expression, NRF2 expression, antioxidant enzymes expression, and subsequent reduction of ROS toxicity followed by reduction of apoptosis (Fig. 7).
The findings from this study indicating that PSH supplementation protects against myocardial I/R injury support our hypothesis that consumption of any foods containing high level of AX and/or arabinose (such as PSH) can be effective in protecting against myocardial injury. In this study, supplementation with PSH containing approximately 65% AX and 20% arabinose [28] showed efficacies at a dosage of 10 mg/kg/d. Previously, we showed that supplementation with AX containing approximately 40% arabinose exerts efficacies at a dosage of 5 mg/kg/d [26]. We have also reported that supplementation with apple pectin containing approximately 1.5% arabinose shows efficacy at a dosage of 100 mg/kg/d [10]. Therefore, this suggests that consumption of lesser amount of foods containing higher levels of AX or arabinose are required to exhibit their efficacies. An underlying mechanism by which PSH consumption protects against myocardial injury through arabinose can be presented, as previously described [26]. Briefly, once PSH is ingested, AX present in PSH is hydrolyzed to arabinose and xylose by microbiota inhabiting the large intestine. In turn, the arabinose generated is absorbed into the body and protects the heart against ischemic injury.
Regardless of underlying mechanisms, the findings from this study reveal that short-term PSH intake protects against myocardial I/R injury even after coronary arteries are occluded, indicating that PSH intake can prevent MI by blocking the postocclusion steps (Fig. 1). It has already been shown that long-term PSH consumption prevents MI by blocking the preocclusion steps, because PSH consumption was effective in reducing risk factors for coronary ischemic disease such as hyperlipidemia [1112], diabetes [14], and hypertension [15], which promote the formation of atherosclerotic plaques responsible for narrowing the coronary arteries (Fig. 1). Overall, we conclude that PSH consumption prevents MI by inhibiting both the preocclusion and postocclusion steps.
Approximately 10 g/d of PSH was administered in various clinical trials to assess the efficacies in reducing the risk factors [111415]. Based on these findings, the US Food and Drug Administration (FDA) approved health claims of reducing cardiovascular disease for PSH at dosages of over 8 g/d [43]. However, results from the current study indicate that PSH supplementation to the rats protected myocardial I/R injury at dosages over 10 mg/kg/d. The dosage is equivalent to 100 mg/d for a 60 kg person, based on calculations using a conversion factor provided by the FDA [44]. Thus, we postulate that the dosage required to show efficacies for blocking postocclusion steps is much smaller than that required for blocking preocclusion steps, which will therefore not cause any safety concerns for consuming PSH to reduce myocardial injury.
In conclusion, the results from our study reveal that PSH consumption reduces myocardial I/R injury in rats by inhibiting the apoptotic cascades through modulation of gene expression of several genes located upstrem of apoptosis, at a safe dosage when converted to human beings. Our findings indicate that PSH consumption prevents MI by blocking the postocclusion steps. We belive that PSH has the potential to be developed as a functional food for preventing MI, through blockade of both the preocclusion and postocclusion steps.
 XML Download