Abstract
Purpose
One of the suggested potential mechanisms of tinnitus is an alteration in perception in the neural auditory pathway. The aim of this study was to investigate the difference in laterality in functional connectivity between tinnitus patients and healthy controls using resting state functional MRI (rs-fMRI).
Materials and Methods
Thirty-eight chronic tinnitus subjects and 45 age-matched healthy controls were enrolled in this study. Connectivity was investigated using independent component analysis, and the laterality index map was calculated based on auditory (AN) and dorsal attention (DAN), default mode (DMN), sensorimotor, salience (SalN), and visual networks (VNs). The laterality index (LI) of tinnitus subjects was compared with that of normal controls using region-of-interest (ROI) and voxel-based methods and a two-sample unpaired t-test. Pearson correlation was conducted to assess the associations between the LI in each network and clinical variables.
Results
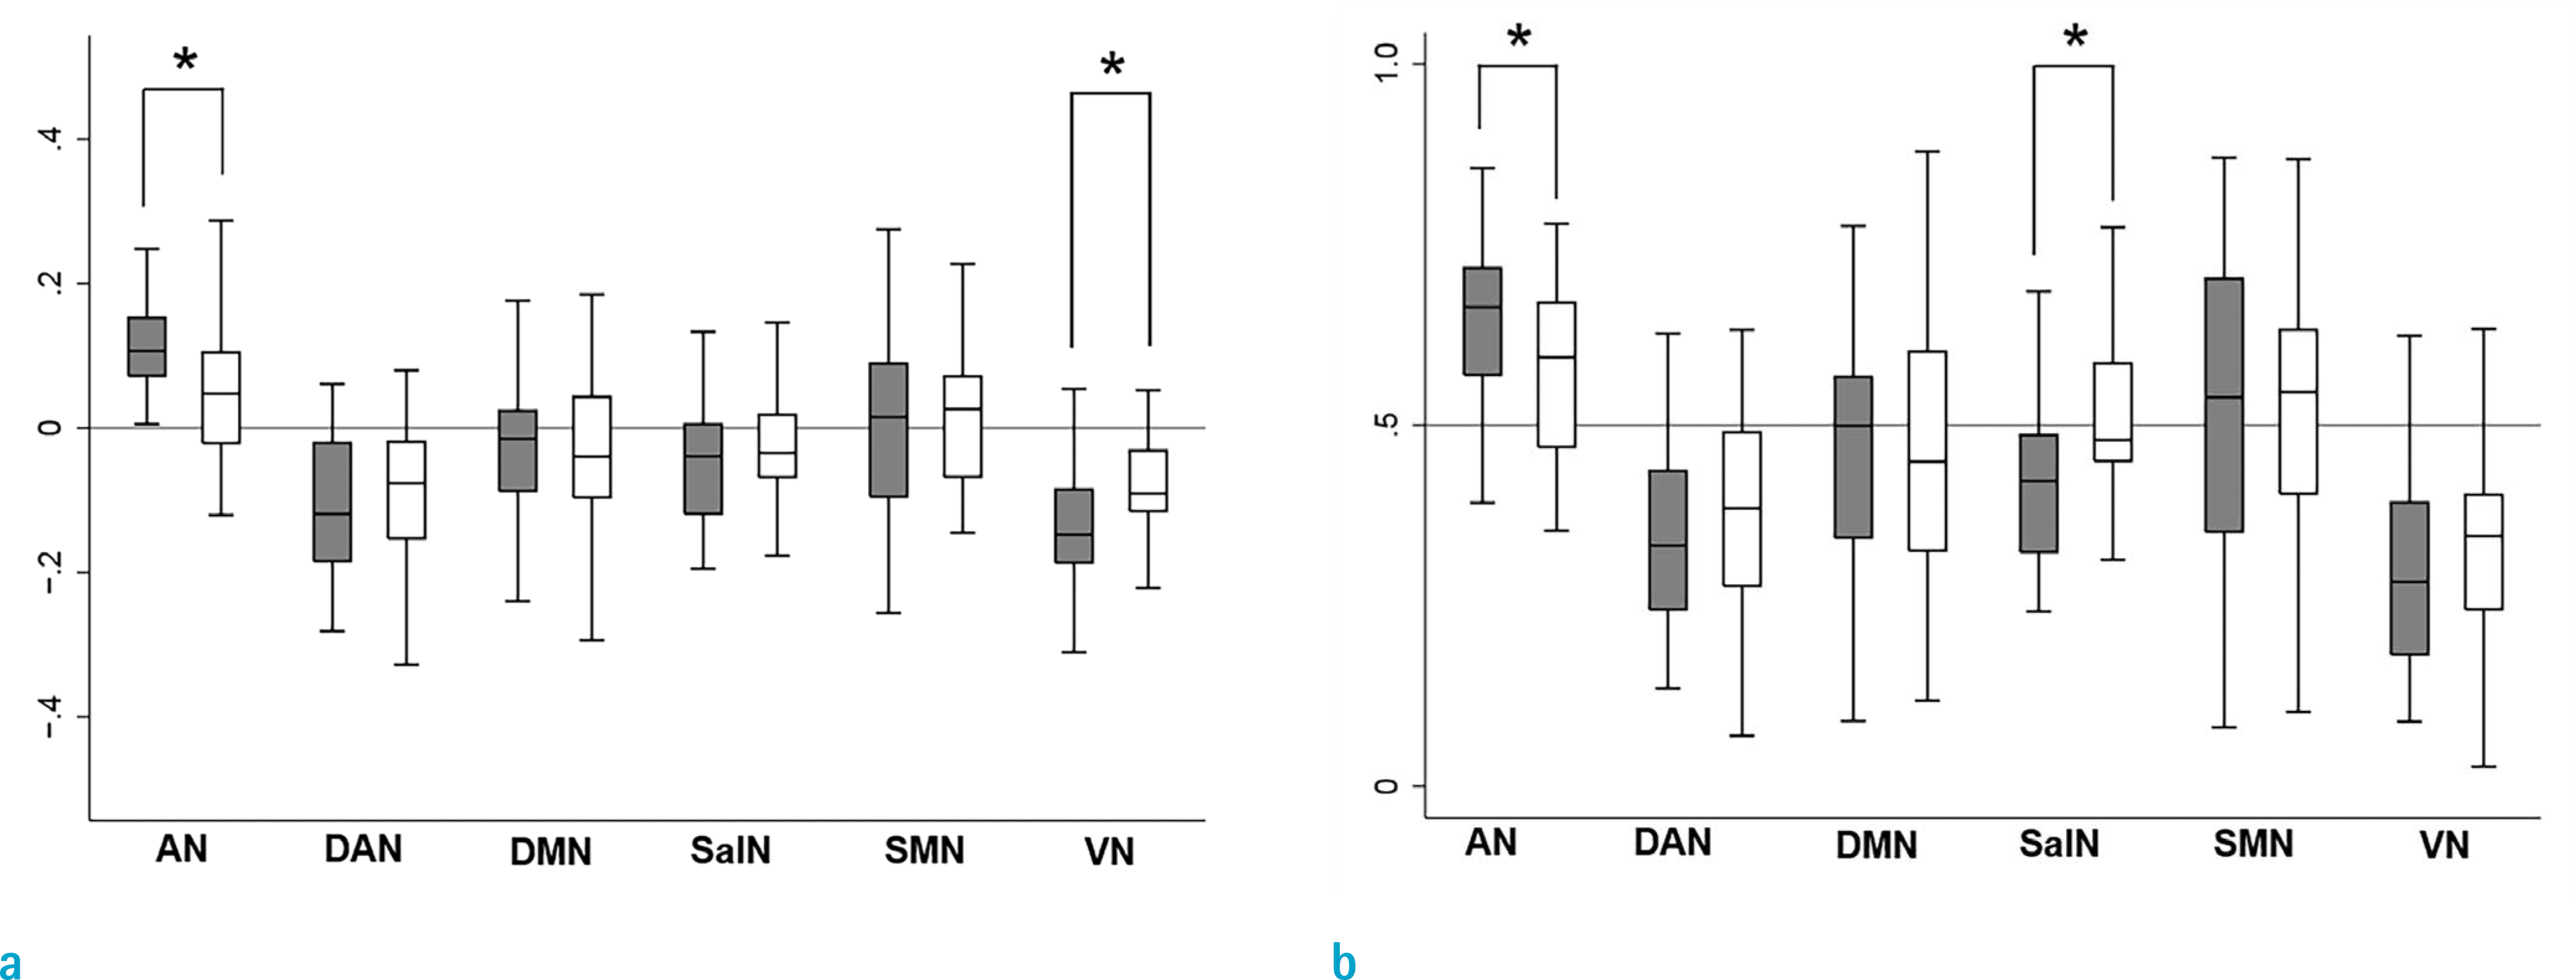
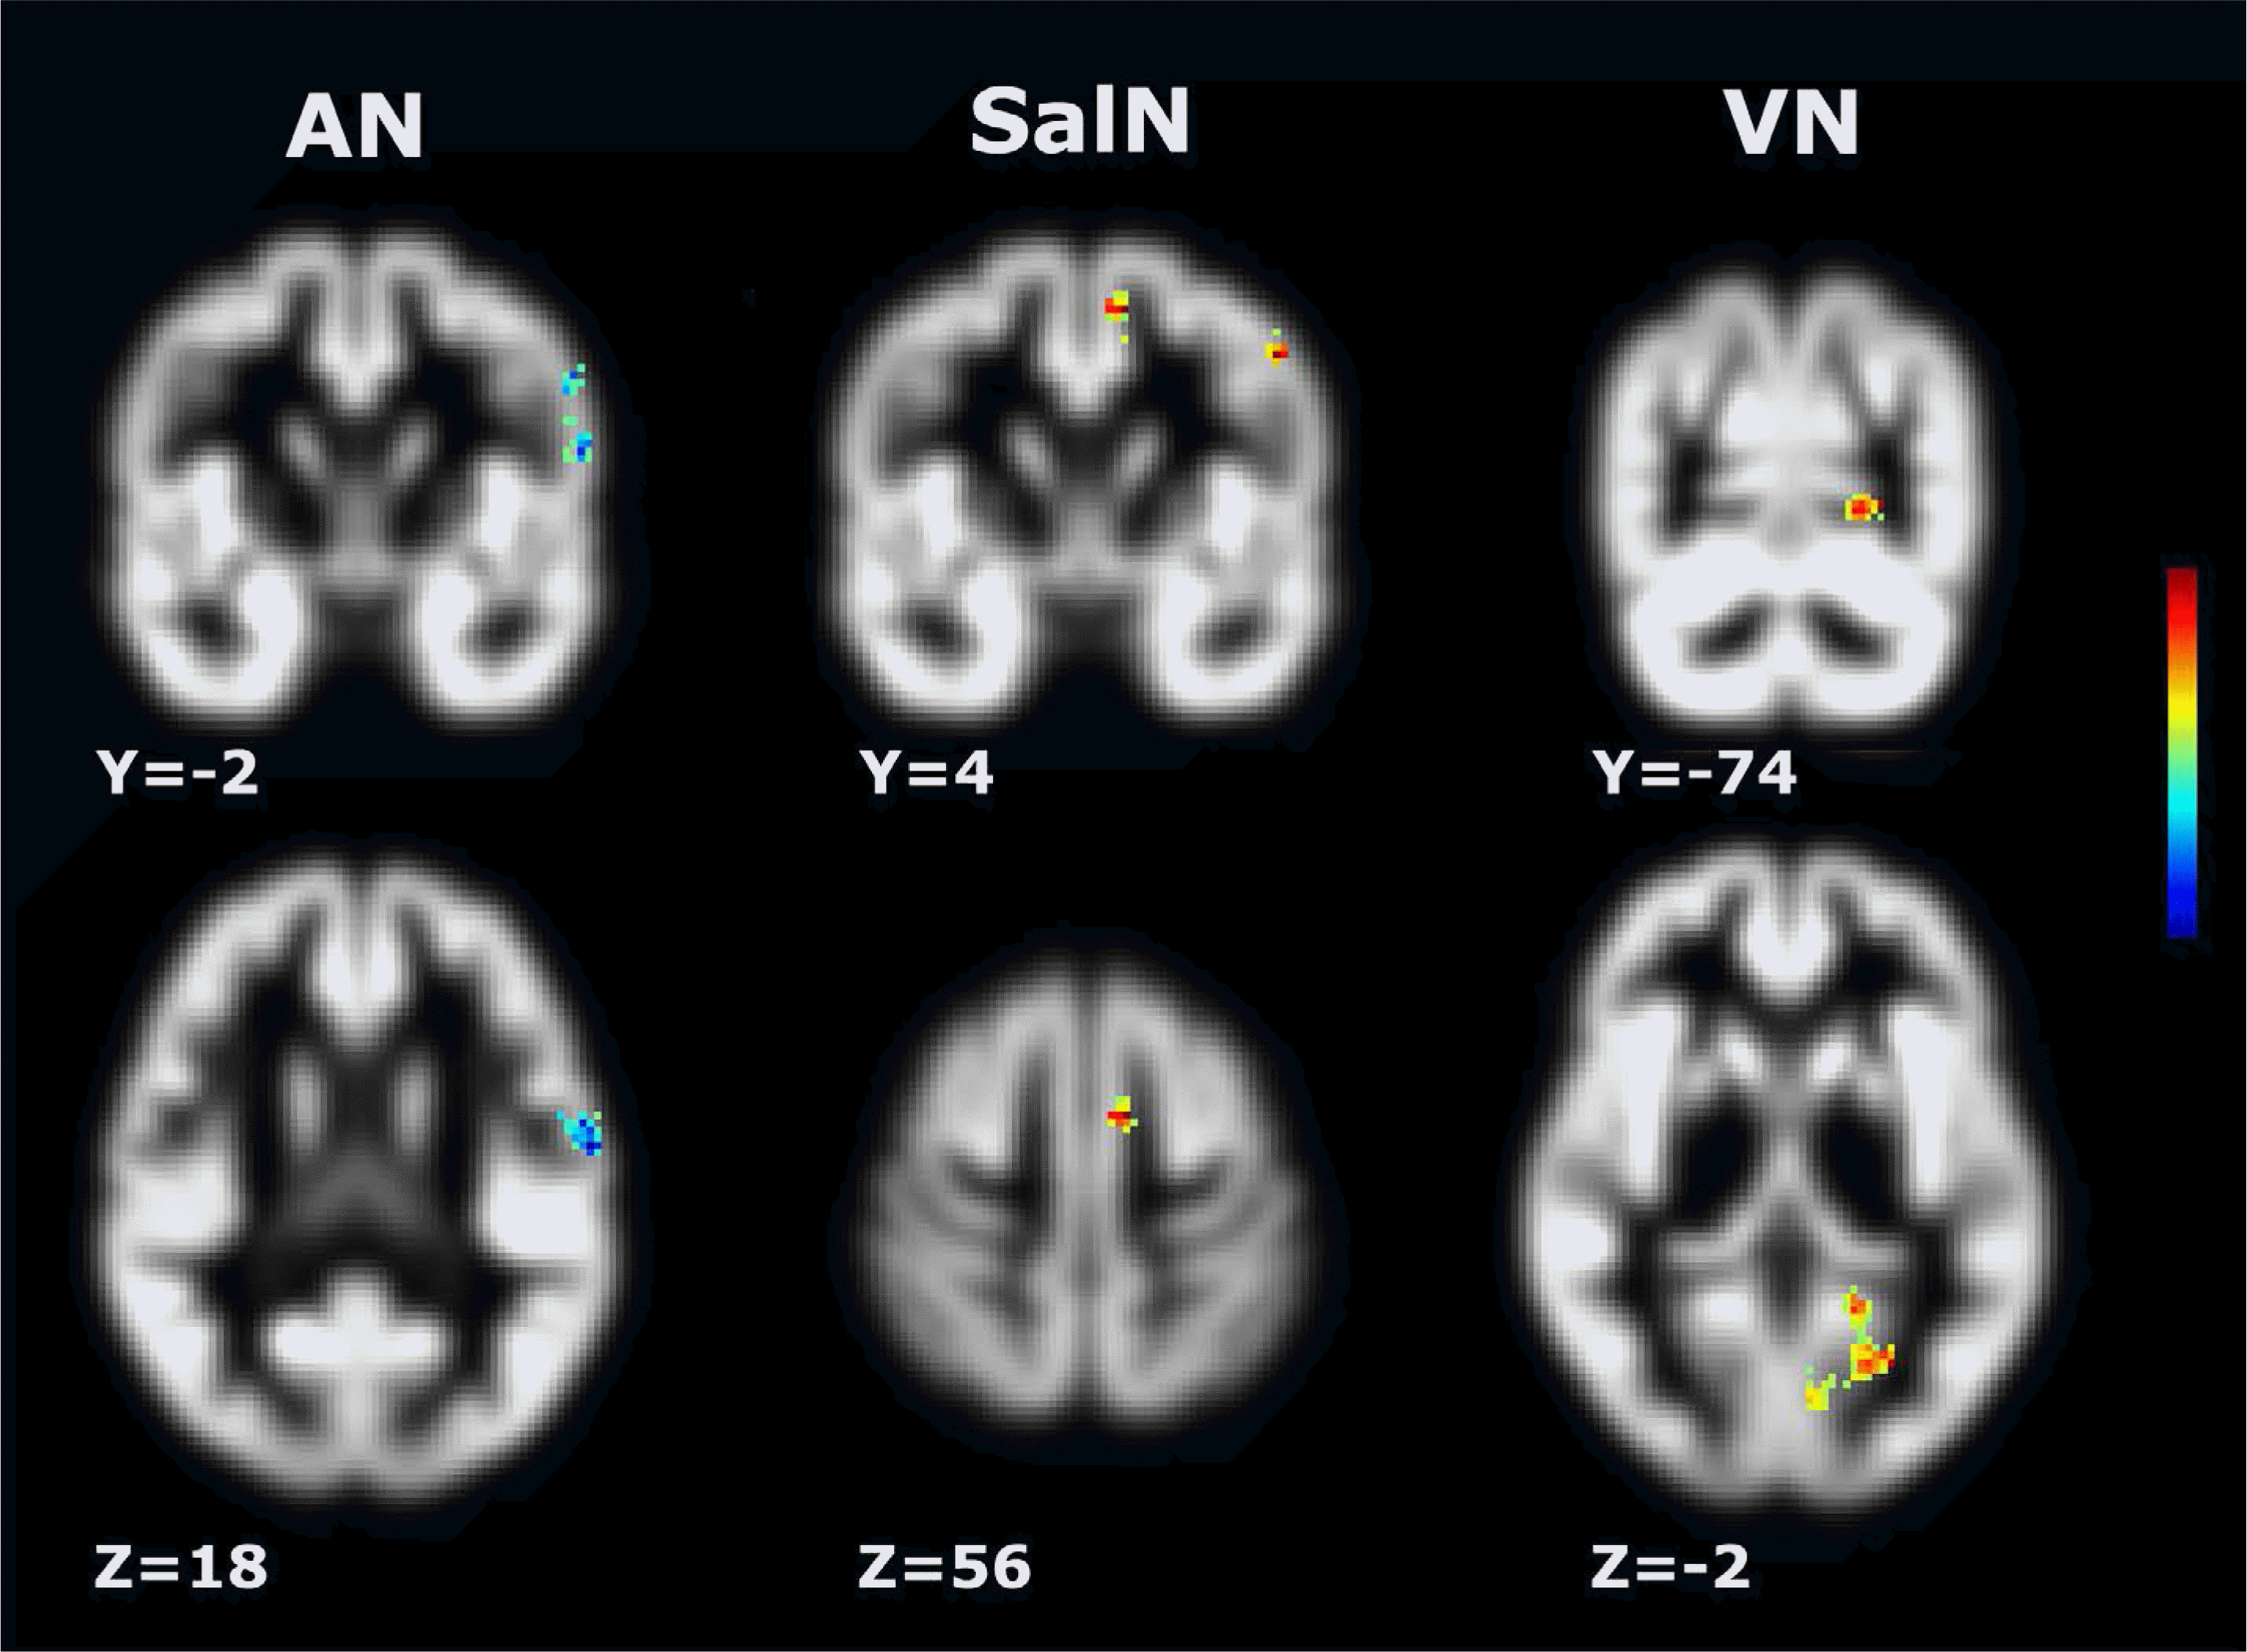
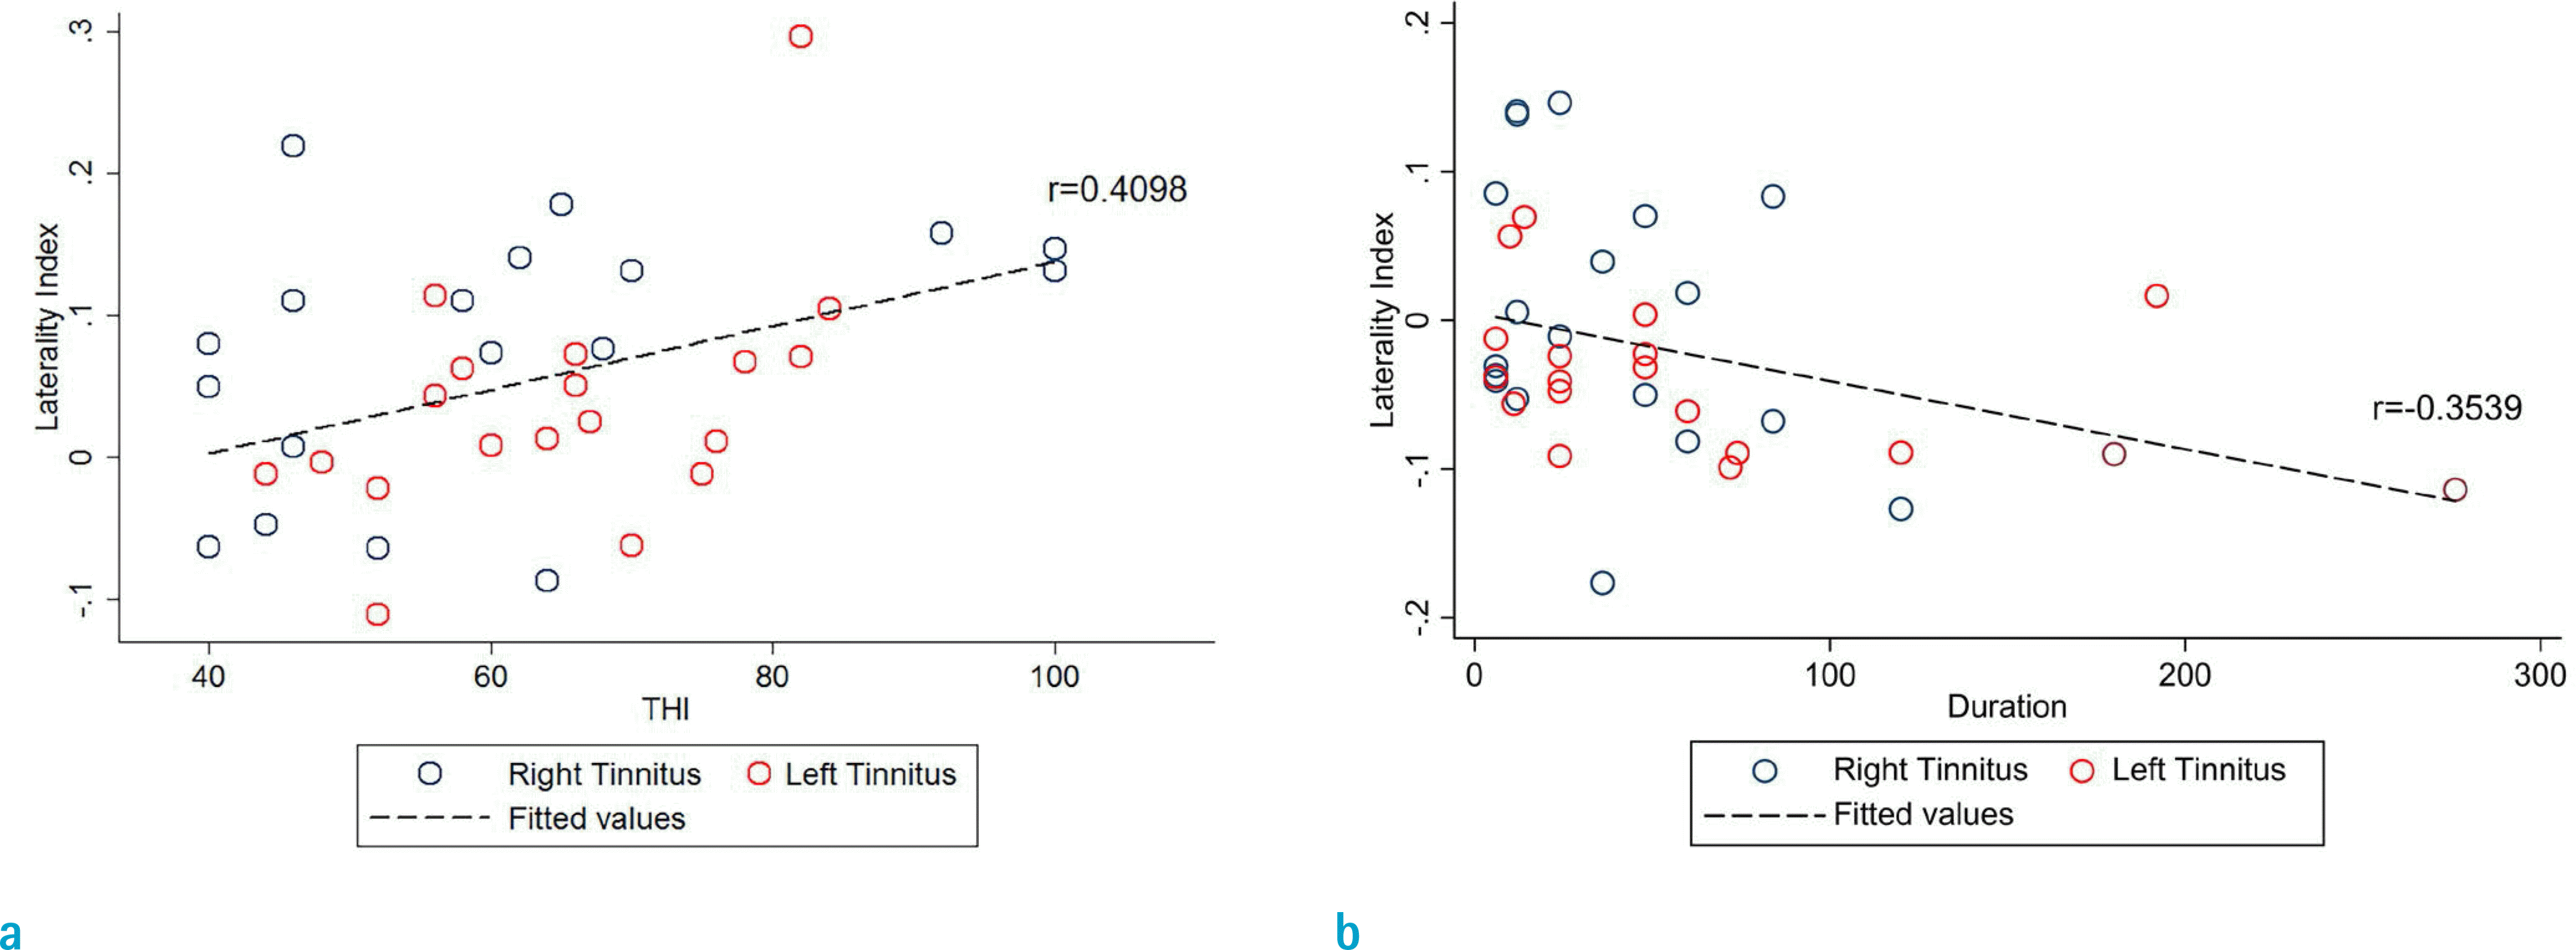
The AN and VN showed significant differences in LI between the two groups in ROI analysis (P < 0.05), and the tinnitus group had clusters with significantly decreased laterality of AN, SalN, and VN in voxel-based comparisons. The AN was positively correlated with tinnitus distress (tinnitus handicap inventory), and the SalN was negatively correlated with symptom duration (P < 0.05).
References
1. Vigneau M, Beaucousin V, Herve PY, et al. What is right-hemisphere contribution to phonological, lexico-semantic, and sentence processing? Insights from a metaanalysis. Neuroimage. 2011; 54:577–593.
2. Thiebaut de Schotten M, Dell'Acqua F, Forkel SJ, et al. A lateralized brain network for visuospatial attention. Nat Neurosci. 2011; 14:1245–1246.

3. Su L, An J, Ma Q, Qiu S, Hu D. Influence of resting-state network on lateralization of functional connectivity in mesial temporal lobe epilepsy. AJNR Am J Neuroradiol. 2015; 36:1479–1487.

4. Zhan J, Gao L, Zhou F, et al. Decreased regional homogeneity in patients with acute mild traumatic brain injury: a resting-state fMRI study. J Nerv Ment Dis. 2015; 203:786–791.
5. Saleh S, Bagce H, Qiu Q, et al. Mechanisms of neural reorganization in chronic stroke subjects after virtual reality training. Conf Proc IEEE Eng Med Biol Soc. 2011; 2011:8118–8121.

6. Luo C, Zhang X, Cao X, et al. The lateralization of intrinsic networks in the aging brain implicates the effects of cognitive training. Front Aging Neurosci. 2016; 8:32.

7. Geven LI, de Kleine E, Willemsen AT, van Dijk P. Asymmetry in primary auditory cortex activity in tinnitus patients and controls. Neuroscience. 2014; 256:117–125.

8. Smits M, Kovacs S, de Ridder D, Peeters RR, van Hecke P, Sunaert S. Lateralization of functional magnetic resonance imaging (fMRI) activation in the auditory pathway of patients with lateralized tinnitus. Neuroradiology. 2007; 49:669–679.

9. Schecklmann M, Landgrebe M, Poeppl TB, et al. Neural correlates of tinnitus duration and distress: a positron emission tomography study. Hum Brain Mapp. 2013; 34:233–240.

10. Newman CW, Jacobson GP, Spitzer JB. Development of the tinnitus handicap inventory. Arch Otolaryngol Head Neck Surg. 1996; 122:143–148.

11. Watkins KE, Paus T, Lerch JP, et al. Structural asymmetries in the human brain: a voxel-based statistical analysis of 142 MRI scans. Cereb Cortex. 2001; 11:868–877.

12. Calhoun VD, Adali T, Pearlson GD, Pekar JJ. A method for making group inferences from functional MRI data using independent component analysis. Hum Brain Mapp. 2001; 14:140–151.

13. Himberg J, Hyvarinen A, Esposito F. Validating the independent components of neuroimaging time series via clustering and visualization. Neuroimage. 2004; 22:1214–1222.

14. Erhardt EB, Rachakonda S, Bedrick EJ, Allen EA, Adali T, Calhoun VD. Comparison of multi-subject ICA methods for analysis of fMRI data. Hum Brain Mapp. 2011; 32:2075–2095.

15. Smith SM, Fox PT, Miller KL, et al. Correspondence of the brain's functional architecture during activation and rest. Proc Natl Acad Sci U S A. 2009; 106:13040–13045.

16. Damoiseaux JS, Rombouts SA, Barkhof F, et al. Consistent resting-state networks across healthy subjects. Proc Natl Acad Sci U S A. 2006; 103:13848–13853.

17. Agcaoglu O, Miller R, Mayer AR, Hugdahl K, Calhoun VD. Lateralization of resting state networks and relationship to age and gender. Neuroimage. 2015; 104:310–325.

18. Tomasi D, Volkow ND. Laterality patterns of brain functional connectivity: gender effects. Cereb Cortex. 2012; 22:1455–1462.

19. Swanson N, Eichele T, Pearlson G, Kiehl K, Yu Q, Calhoun VD. Lateral differences in the default mode network in healthy controls and patients with schizophrenia. Hum Brain Mapp. 2011; 32:654–664.

20. Chen YC, Xia W, Feng Y, et al. Altered interhemispheric functional coordination in chronic tinnitus patients. Biomed Res Int. 2015; 2015:345647.

21. Burton H, Wineland A, Bhattacharya M, Nicklaus J, Garcia KS, Piccirillo JF. Altered networks in bothersome tinnitus: a functional connectivity study. BMC Neurosci. 2012; 13:3.

22. Maudoux A, Lefebvre P, Cabay JE, et al. Auditory resting-state network connectivity in tinnitus: a functional MRI study. PLoS One. 2012; 7:e36222.

23. Duquette P. Increasing our insular world view: interoception and psychopathology for psychotherapists. Front Neurosci. 2017; 11:135.

24. Sikora M, Heffernan J, Avery ET, Mickey BJ, Zubieta JK, Pecina M. Salience network functional connectivity predicts placebo effects in major depression. Biol Psychiatry Cogn Neurosci Neuroimaging. 2016; 1:68–76.

25. Barrett LF, Quigley KS, Hamilton P. An active inference theory of allostasis and interoception in depression. Philos Trans R Soc Lond B Biol Sci. 2016; 371.

26. Seeley WW, Menon V, Schatzberg AF, et al. Dissociable intrinsic connectivity networks for salience processing and executive control. J Neurosci. 2007; 27:2349–2356.

27. Michalka SW, Kong L, Rosen ML, Shinn-Cunningham BG, Somers DC. Short-term memory for space and time flexibly recruit complementary sensory-biased frontal lobe attention networks. Neuron. 2015; 87:882–892.

28. Zhang J, Chen YC, Feng X, et al. Impairments of thalamic resting-state functional connectivity in patients with chronic tinnitus. Eur J Radiol. 2015; 84:1277–1284.

Fig. 1.
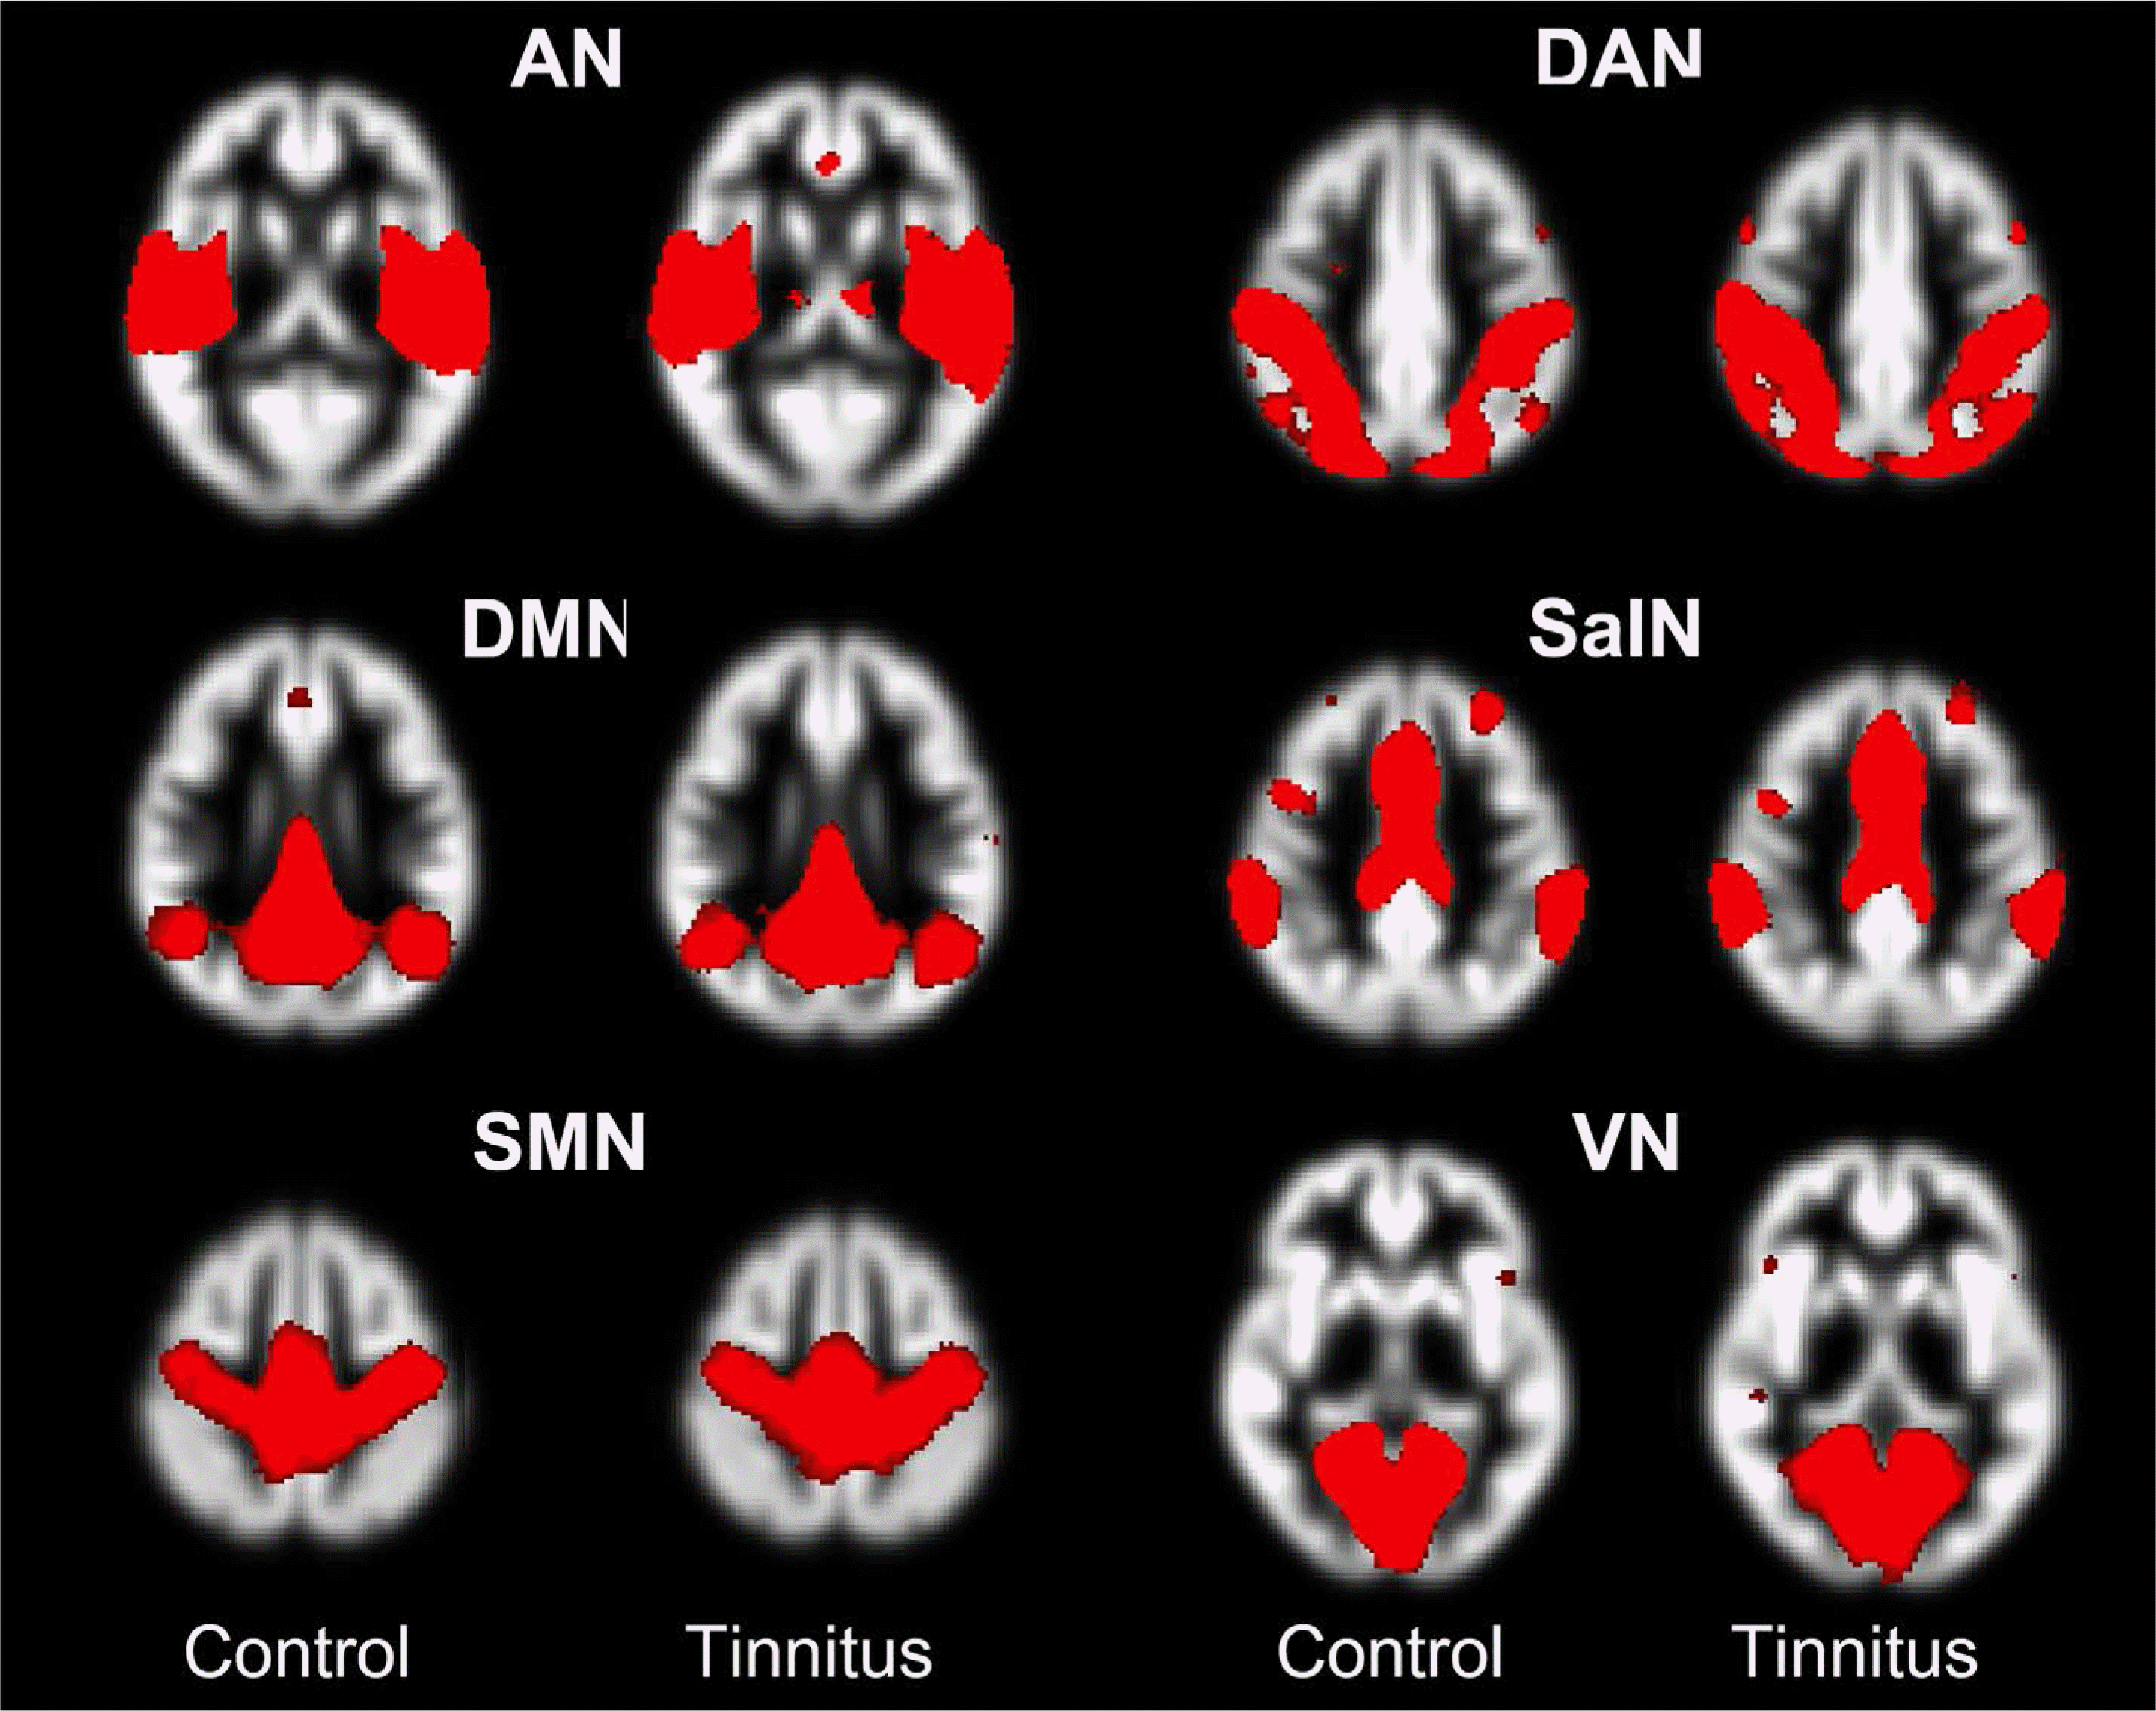
Spatial maps of the six independent components of interest, grouped by network in tinnitus patients (right column) and controls (left column). Auditory (AN), dorsal attention network (DAN), default mode network (DMN), sensorimotor (SMN), salience network (SalN), and visual (VN) networks. Spatial maps are plotted as the t-statistics thresholded over two standard deviations. Background images are bilaterally symmetric gray-matter templates created from specific subjects.

Fig. 2.
Box and whisker plots showing the laterality index (a), and volumetric laterality ratio values (b) of the auditory (AN), dorsal attention network (DAN), default mode network (DMN), sensorimotor (SMN), salience network (SalN) and visual (VN) networks in the tinnitus and control groups. The grey bar represents the control group, and the white bar represents the tinnitus group. Positive value of Y-axis means left laterality.

Fig. 3.
Regions showing significant differences in laterality index (LI) between tinnitus patients and healthy controls. Thresholds were set at corrected P < 0.01, with a voxel-level of P < 0.001 and a minimum cluster size of 21 voxels using AlphaSim. The LI of the auditory network (AN) in the tgPCS and postcentral gyrus were lower in tinnitus subjects than in controls (left column; cluster with blue color). The LI of the salience network (SalN) in the supplemental motor cortex and middle frontal gyrus (middle column), and the LI of the visual network (VN) in the precuneus (right column) are higher in tinnitus subjects than in controls (cluster with yellow to red color). Note that significant clusters are shown only in the left cerebral hemisphere.

Fig. 4.
Scatter plots of the correlations between clinical variables (THI, duration) and the laterality of networks (auditory and salience networks) in the tinnitus group. The navy and red circles represent right-sided and left-sided tinnitus, respectively. The regression line is also shown. (a) Scatter plots between tinnitus distress (THI) and the LI values of tgPCS of the auditory network. The X-axis is THI scores, and the Y-axis is LI values extracted from ROI (shown in Fig. 3, left column). The correlation coefficient was 0.4098 (95% CI, 0.1037 to 0.6450; P < 0.05). (b) Scatter plots between tinnitus duration (month) and the LI values for middle frontal gyrus of the salience network. The X-axis is symptom duration (months), and the Y-axis is LI values extracted from ROI (shown in Fig. 3, middle column). The correlation coefficient was −0.3539 (95% CI, −0.6051 to −0.03855; P < 0.05).

Table 1.
Clinical Variables of Left- and Right-Sided Tinnitus
Table 2.
ROI Comparison of Laterality Index and Lateralized Volume Ratio between Tinnitus and Control Groups
| Network |
Tinnitus (38) |
Controls (45) |
Unpaired t-test |
||||||
|---|---|---|---|---|---|---|---|---|---|
| Mean | 95% CI | Dominance | Mean | 95% CI | Dominance | t | P-value | ||
| AN | LI | 0.0536 | 0.0247 to 0.0825 | Left | 0.0979 | 0.0741 to 0.1217 | Left | –2.414 | 0.0181* |
| LvR | 0.5735 | 0.5343 to 0.6127 | 0.6436 | 0.6076 to 0.6796 | –2.661 | 0.0094* | |||
| DAN | LI | –0.0889 | –0.1207 to −0.0572 | Right | –0.1122 | –0.1410 to −0.0835 | Right | 1.101 | 0.2741 |
| LvR | 0.3737 | 0.3282 to 0.4193 | 0.3471 | 0.3089 to 0.3853 | 0.439 | 0.3645 | |||
| DMN | LI | –0.0257 | –0.0659 to 0.0146 | Indeterminate | –0.0365 | –0.0672 to −0.00575 | Indeterminate | 6.499 | 0.6618 |
| LvR | 0.4636 | 0.4025 to 0.5246 | 0.4639 | 0.4168 to 0.5110 | –0.009 | 0.9928 | |||
| SalN | LI | –0.0187 | –0.0437 to 0.0063 | Indeterminate | –0.0483 | –0.0724 to −0.0241 | Right | –1.711 | 0.0909 |
| LvR | 0.4805 | 0.4460 to 0.5149 | 0.4296 | 0.3955 to 0.4637 | –2.106 | 0.0383* | |||
| SMN | LI | 0.0260 | –0.0150 to 0.0669 | Indeterminate | 0.0003 | –0.0406 to 0.0411 | Indeterminate | –0.892 | 0.3753 |
| LvR | 0.5256 | 0.4601 to 0.5911 | 0.5130 | 0.4473 to 0.5788 | 0.272 | 0.7860 | |||
| vN | LI | –0.0985 | –0.1283 to −0.0687 | Right | –0.1441 | –0.1733 to −0.1148 | Right | –2.190 | 0.0314* |
| LvR | 0.3427 | 0.2868 to 0.3986 | 0.3087 | 0.2642 to 0.3533 | –0.972 | 0.3338 | |||
Table 3.
Voxel-Based Comparison of Laterality Index between Tinnitus Subjects and Healthy Controls
| Network | Region (Nearest Brodmann's area) | Number of voxels | Peak intensity |
MNI coordinate** |
||
|---|---|---|---|---|---|---|
| X* | Y | Z | ||||
| AN | Postcentral gyrus (43) | 93 | –4.0807 | |62| | –6 | 18 |
| tgPCS (6) | 22 | –3.6249 | |50| | –3 | 38 | |
| SalN | Supplemental motor area (6) | 76 | 3.9689 | |10| | 2 | 56 |
| Middle frontal gyrus (6) | 24 | 3.8871 | |50| | 2 | 44 | |
| VN | Precuneus (19) | 89 | 4.4266 | |10| | –76 | 26 |
| Lingual gyrus (18) | 208 | 4.2507 | |18| | –54 | –4 | |
| Lingual gyrus (18) | 66 | 3.6009 | |8| | –76 | –4 | |
Table 4.
Voxel-Based Analysis of Correlation between Laterality Index and Clinical Variables in Tinnitus Patients
| Network | Region (Nearest Brodmann's area) | Number of voxels | s Peak intensity |
MNI coordinate** |
||
|---|---|---|---|---|---|---|
| X* | Y | Z | ||||
| AN-THI | Superior temporal gyrus (42) | 67 | 0.6038 | |52| | –32 | 10 |
| Superior temporal gyrus (22) | 22 | 0.5627 | |68| | –8 | 2 | |
| SalN-duration | Inferior parietal lobule (40) | 29 | –0.5078 | |58| | 36 | 50 |


 PDF
PDF ePub
ePub Citation
 Print
Print


 XML Download