

 PDF
PDF ePub
ePub Citation
 Print
Print


INTRODUCTION
MATERIALS AND METHODS
Patients
ASL Perfusion MRI
DSA
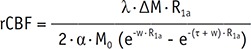
Quantitative Analysis of CBF on ASL
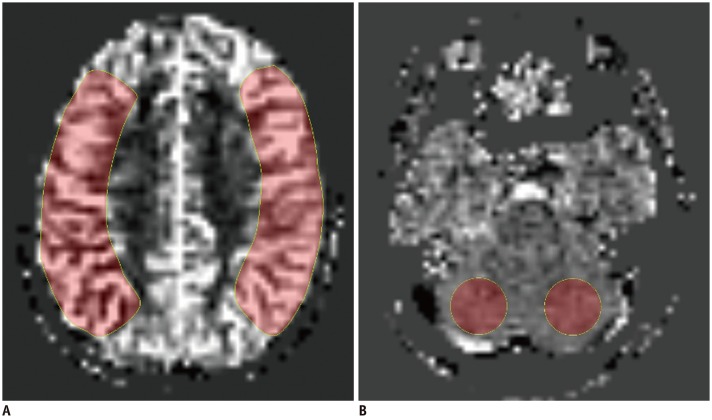 | Fig. 1Imaging example of ROI placement for CBF measurements in ASL images.
A. ROIs created manually over MCA territory along level of centrum semi-ovale on operated side and contralateral side. B. Additional ROIs drawn in cerebellum for normalization on right and left cerebellar hemispheres. Absolute CBFCbll was defined as mean of right and left CBFCbll. ASL = arterial spin labeling, CBF = cerebral blood flow, CBFCbll = CBF of cerebellum, MCA = middle cerebral artery, ROI = region of interest
|
Grading of Postoperative Revascularization in the MCA Territory on DSA
Statistical Analysis
RESULTS
Patients
Table 1
Clinical Data and Imaging Findings
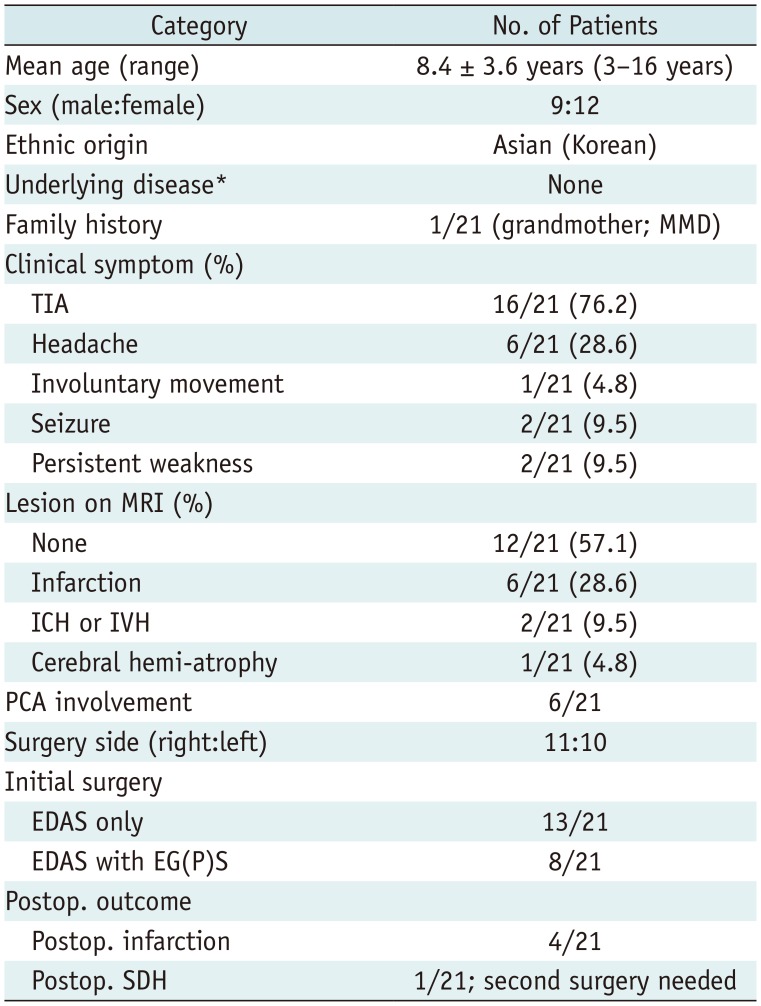
*Underlying disease such as neurofibromatosis type 1 and Down syndrome, etc. EDAS = encephaloduroarteriosynangiosis, EG(P) S = encephalogaleo (periosteal) synangiosis, ICH = intracerebral hematoma, IVH = intraventricular hemorrhage, MMD = moyamoya disease, PCA = posterior cerebral artery, Postop. = postoperative, SDH = subdural hemorrhage, TIA = transient ischemic attack
![]()
CBF Changes after Cerebral Revascularization on ASL
Table 2
Comparison between Pre- and Postoperative CBF Values in Patients (n = 21) Who Underwent Unilateral Revascularization Based on ASL Measurements for Each Reader
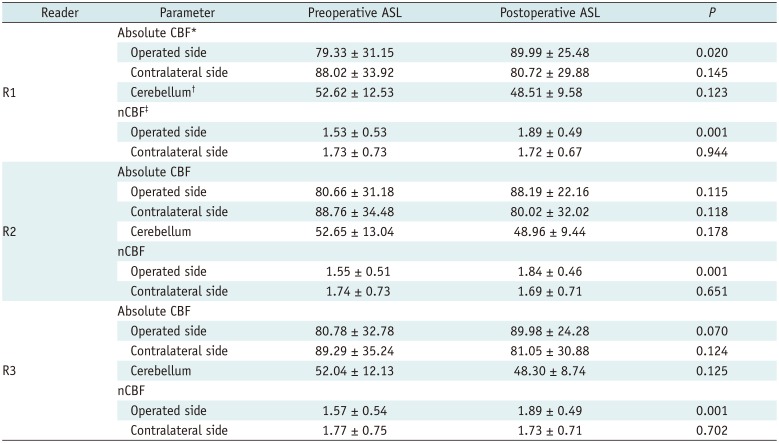
Values are mean ± standard deviation. Absolute or nCBF values were compared between pre- and postoperative ASL using paired t test. *Data are in units of mL per 100 g per minute, †Absolute CBFCbll was defined as mean of right and left CBFCbll, ‡nCBF values are calculated as follows: CBFMCA/CBFCbll. ASL = arterial spin labeling, CBF = cerebral blood flow, CBFCbll = CBF of cerebellum, CBFMCA = CBF value in the MCA territory, MCA = middle cerebral artery, nCBF = normalized CBF
![]()
Comparison between the Revascularization Degree on DSA and CBF Changes on ASL
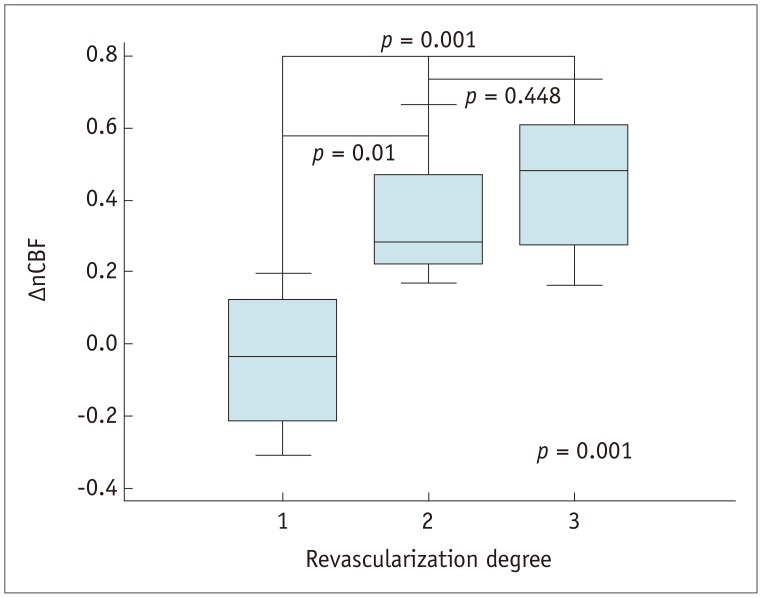 | Fig. 2Graph displaying nCBF changes measured with ASL according to angiographic revascularization degree(poor revascularization [grade 1], −0.043 ± 0.212; fair revascularization [grade 2], 0.345 ± 0.176; good revascularization [grade 3], 0.453 ± 0.182 [p = 0.001]). nCBF = normalized CBF
|
Table 3
Relationship between Angiographic Postoperative Revascularization Degree and Change in nCBF Value
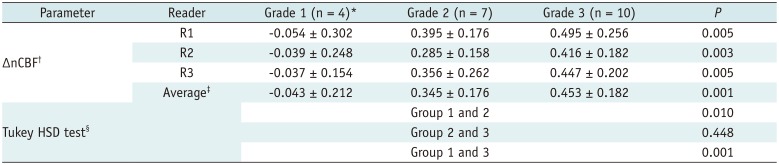
Revascularization grading was evaluated via digital subtraction angiography imaging (baseline and postoperative follow-up image) in MCA territory. *Grade 1, poor (area perfused by synangiosis is less than 1/3 of MCA territory); 2, fair (area perfused by synangiosis is between 1/3 and 2/3 of MCA territory); 3, good (area perfused by synangiosis is greater than 2/3 of MCA territory), †Change in nCBF values is calculated as follows: ΔnCBF = postoperative nCBF - preoperative nCBF, ‡Values averaged across three readers for ΔnCBF values, §Post-hoc Tukey HSD test for averaged ΔnCBF values across three readers. HSD = honestly significant difference
![]()
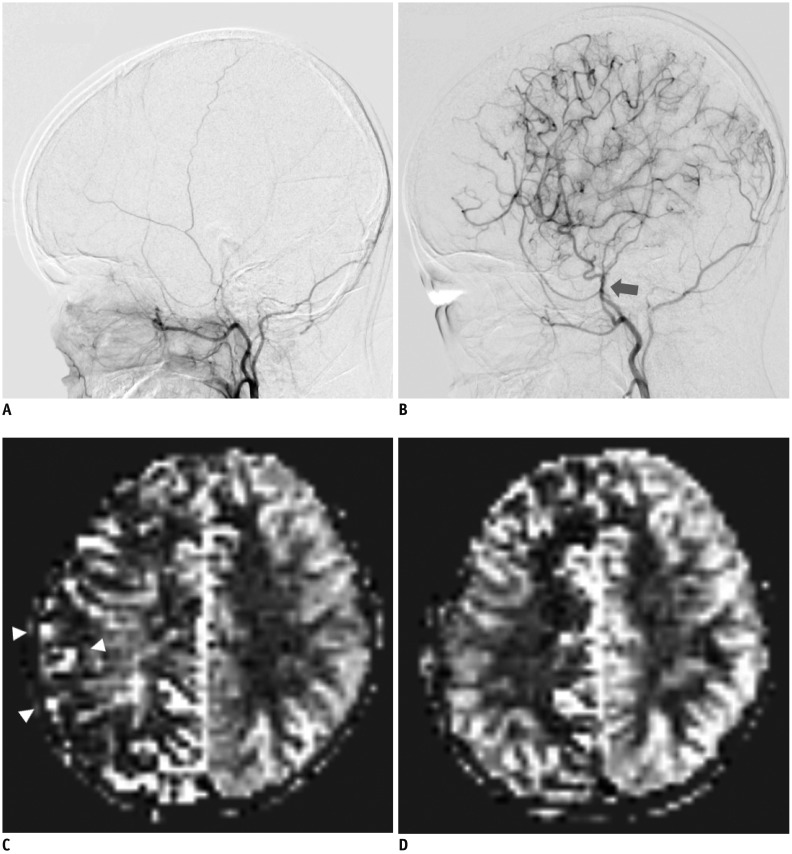 | Fig. 3Representative DSA and ASL images showing good postoperative outcome in 12-year-old girl with unilateral MMD who underwent right EDAS with right EC(P)S.
A. Baseline DSA image showing lateral projection from right external carotid injections. B. Postoperative DSA image after surgery shows superficial temporal artery hypertrophy (arrow) and abundant collateral flow at greater than 2/3 of MCA territory; grade 3, good revascularization grade. C. Baseline ASL image shows decreased perfusion and ATA signals (arrowheads) reflecting late-arriving flow via collateral pathways. D. Postoperative ASL image shows increased perfusion with decreased ATA signals in right MCA territory, corresponding to DSA results. ATA = arterial transit artifact, DSA = digital subtraction angiography, EC(P)S = encephalogaleo (periosteal) synangiosis, EDAS = encephaloduroarteriosynangios is, MMD = moyamoya disease
|
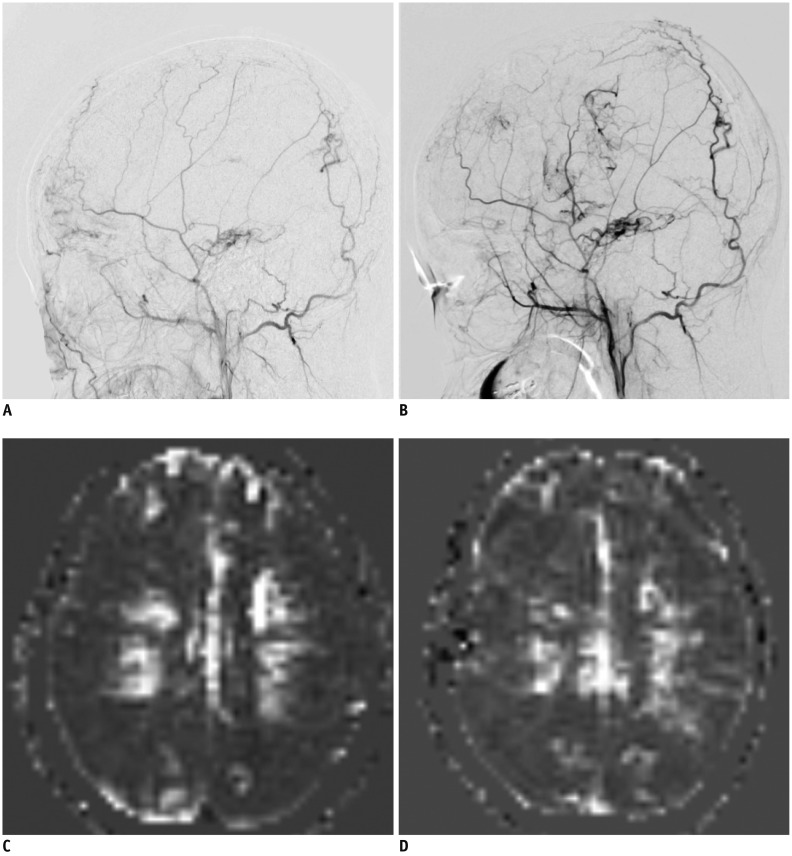 | Fig. 4Representative DSA and ASL images showing poor postoperative outcome in 16-year-old girl with bilateral MMD who underwent right EDAS with bifrontal EC(P)S.
A. Baseline DSA image showing lateral projection from right external carotid injections demonstrates preexisting transdural collaterals, indicating advanced stage of disease. B. Postoperative DSA image shows impaired collateral flow at less than 1/3 of MCA territory; grade 1, poor revascularization grade. C. Baseline ASL image shows decreased perfusion in both MCA territories. D. Postoperative ASL image shows impaired perfusion, corresponding to DSA results.
|
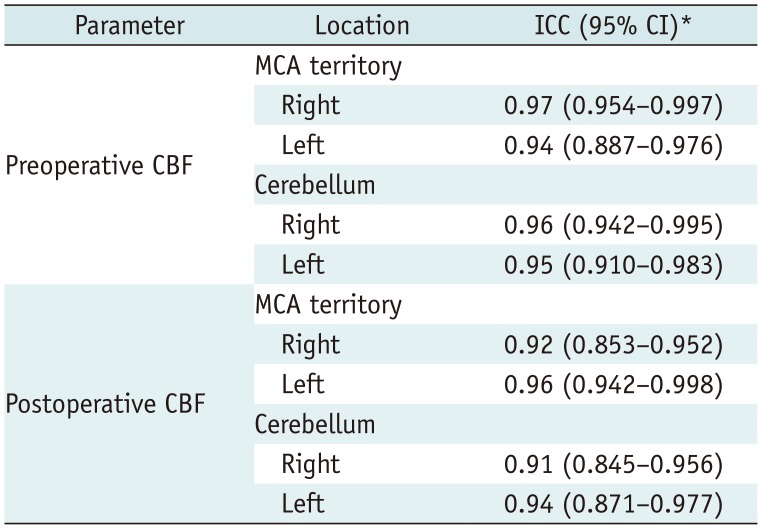
Interobserver Agreement
Table 4
Contingency Table for Interobserver Agreement of CBF Measured by Three Readers
![]()
 XML Download