

 PDF
PDF Citation
 Print
Print


INTRODUCTION
Epithelial ovarian cancer (EOC) is a leading cause of death among patients who suffer from gynecological malignancies [1]. EOC presents at a late stage in most cases, and 40%–60% of all patients and 75% of patients at an advanced stage will eventually experience recurrence [23]. The accurate estimation of survival for EOC patients is important because prognosis could be a key determinant of treatment aggressiveness.
Previously known cancer-related risk factors for EOC patients include International Federation of Gynecology and Obstetrics (FIGO) stage, histologic type, residual disease status after surgery, histologic grade, and cancer antigen 125 (CA-125) level [4567]. FIGO stage, which had been recently revised in 2013, is one of the most frequently used indicators for the prognosis of EOC patients. In the revised FIGO stage, the number of substages increased for more specific prognostications. However, due to the small number of each group, the substaging decreased the statistical power, which drew some criticism because this system eventually increased its uncertainty [48].
The gradient boosting (GB) algorithm is one of the most powerful machine learning techniques that has exhibited success in clinical applications. It is one of the ensemble methods that rely on combining a large number of weak simple predictors to obtain a stronger prediction. Therefore, the GB model is highly flexible in analyzing diverse patterns of data. GB algorithms have been applied to solve many different medical problems such as prediction of acute lower gastrointestinal bleeding and epilepsy using electroencephalogram data [910]. By applying the GB method for survival prediction, time sequential information could be used for more accurate results. In EOC, the serum level of CA-125 fluctuates according to therapeutic response of patients in addition to individual variations [1112]. Since conventional statistical models are limited to analyzing the time sequence patterns of CA-125 level with other individual variables, we could use the GB method to analyze the data to increase the accuracy of prediction.
In this study, we aimed to develop a new prognostic classification for predicting the survival of EOC patients using machine learning technology, GB. The current study also evaluated the accuracy of the prediction model with the GB method by comparing it with the conventional statistical method.
MATERIALS AND METHODS
1. Patients
For training cohort, data of all EOC patients who underwent primary treatment at Samsung Medical Center between January 2002 and December 2015 were included. We performed a retrospective review from the electric medical records. Data of 1,128 EOC patients were analyzed for the training cohort. For external validation, we used data from EOC patients who were treated in Asan Medical Center from 2004 to 2010 with sufficient clinical information as training cohort, and data of 229 patients were analyzed (Fig. 1). This study was approved by the Institutional Review Board (IRB No. of Samsung Medical Center, 2016-08-090 and Asan Medical Center, 2017-0500).
2. Treatment and follow-up
Primary surgical treatment of EOC consisted of hysterectomy, bilateral salpingo-oophorectomy, omentectomy, retroperitoneal (pelvic and para-aortic) lymphadenectomy, and any tumorectomy of metastatic lesions if applicable. Peritoneal washing was routinely carried out. If any abnormalities were identified, peritoneal biopsies from different sites were appropriately performed. After debulking surgery, patients started the first cycle of platinum-based combination chemotherapy, which was repeated every three weeks for 6 cycles. CA-125 measurements were performed at each cycle of chemotherapy. Abdominopelvic computed tomography (CT) scan was routinely performed after first three cycles of chemotherapy and after 6 cycles of first line treatment. Neoadjuvant chemotherapy was considered for patients with bulky stage II I to IV disease who were unlikely to be completely cytoreduced to no residual disease, or patients who are poor surgical candidates.
After primary treatment, patients were assessed by physical examination, complete blood count, and chemistry with serum tumor markers, including CA-125 measurements, every three months for the first 2 years and twice per year thereafter. Chest radiography and abdominopelvic CT scan (or alternatively abdominopelvic magnetic resonance imaging) were performed every 6 months for the first 3 years and every 12 months thereafter. Additional diagnostic procedures were performed according to specific clinical suspicions. If recurrence was suspected with symptoms or CA-125 elevation, additional imaging studies were performed. Recurrence may have been detected by imaging studies with or without CA-125 elevation. Response to chemotherapy was assessed and recorded according to Response Evaluation Criteria in Solid Tumors criteria.
3. Variables for analysis
Thirty-four variables of EOC patients were analyzed (Supplementary Table 1). Each variable was shown as continuous, or assigned to binary/multiple categories for descriptive purposes and statistical analysis. Age, FIGO stage, histology, grade, estimated blood loss (EBL) at primary surgery, American Society of Anesthesiologist (ASA) status for preoperative evaluation, operation site, lymphatic metastasis, and interval from surgery to chemotherapy (ISC) were obtained from the medical records. Additionally, we used the serial serum CA-125 level during primary treatment (pre-operative, post-operative, and first to sixth cycles). For describing characteristic of patients group, summary statistics were used to describe the data. Medians (range) or means (standard deviation) were used for continuous variables. After the Shapiro-Wilks test confirmed normal distributions, Mann-Whitney U test was used to compare median values and Student's t-test was used to compare mean values. Categorical variables were presented as frequencies (percentages). Fisher's exact test or χ2 test was used to analyze the distribution of characteristics. All p-values were 2-sided, and we considered p-values less than 0.05 as statistically significant.
4. Strategy for data separation and feature selection for development of the GB model
A flowchart for the construction of a new prediction model for overall survival (OS) is shown in Fig. 1. Patients from Samsung Medical Center (n=1,128) were randomly sorted into a training set (85%) and a test set (15%). Missing data were imputed using the k-nearest neighbor algorithm [13] after separating the training and test sets. The feature values were preprocessed by normalization. Five-fold cross-validation was performed with the training data to optimize the hyper-parameters of the GB machine. The base learner of our model was decision tree where the maximum depth was 6, and Friedman's mean square error was used as a decision rule in each node. GB generates an additive learner in every forward stage. In each stage, regression trees are fit by gradient descent method. In this study, the model was boosted by 1,000 stages. Learning rate which controls the contribution of each tree was limited to 0.03.
The prediction accuracy of the GB model was evaluated over the test set at the discrete time point (from the first to the fifth years after the first operation) for selection of target year. After target year with highest accuracy was selected, the area under the curve (AUC) of the GB machine was evaluated as the number of variables was reduced in order to find a model trained with optimal number of variables. Models were generated using train set with different number of variables, and AUC of the trained model was evaluated using test set. The distribution of probable AUC values in each model was generated using bootstrap resampling, where training sets (85%) and their corresponding test sets (15%) were resampled 100 times. The median AUC of each model was compared with those of other models using Wilcoxon test, and we choose an optimal model whose AUC is significantly higher than those of the others. The model was retrained using the optimal number of variables and then evaluated with an external dataset from the other institute (validation cohort, n=229).
5. Performance evaluation of the GB model by comparing with conventional cox proportional hazards model, and Kaplan-Meier curve analysis for subgroups by GB model
A Cox proportional hazards regression analysis (CoxPHR) for prediction of target-year survival was generated using the same train set for finding significant covariates for the final CoxPHR model development. We evaluated the accuracy of the CoxPHR model for predicting target-year prognosis after surgery using the train set. External validation of the CoxPHR model and GB model was performed over the validation dataset from the other hospital. Patients of external validation group were evenly divided to 4 subgroups (A, B, C, and D) according to the survival probability scores predicted by the GB model. Kaplan-Meier curve analysis was performed for 4 subgroups (A, B, C, and D), and then compared with Kaplan-Meier curves by FIGO stage (I, II, III, and IV) in test set. These analysis was executed using SAS version 9.4 (SAS Institute, Cary, NC, USA) and R 3.3.2 (Vienna, Austria; http://www.R-project.org/). AUCs by GB model and conventional cox proportional hazards model were compared using non-parametric statistical tests described by Hanley and McNeil using the MedCalc program (version 12.7; MedCalc Software, Ostend, Belgium) [14]. The Scikit-learn library was used to generate the GB model and pre-process other data [15].
RESULTS
1. Demographic analysis
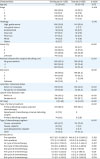
Patient demographic and clinical characteristics are listed in Table 1. We analyzed the medical records of 1,128 patients with EOC treated at Samsung Medical Center as the training cohort and of 229 patients treated at Asan Medical Center as the validation cohort. There were 607 cases of cancer recurrence and 416 cases of overall death in the median follow-up of 47 months (range of 4 to 177 months) for the training cohort. The majority of patients had FIGO stage III (56.6%) and grade 3 disease (56.8%) of high-grade serous type (61.6%). No residual disease after initial debulking surgery was observed in 469 patients (41.5%). For the validation cohort, there were 143 cases of cancer recurrence and 81 cases of overall death in the median follow-up of 63 months (range of 6 to 143 months). There were no statistically significant differences in age, FIGO stage, or histology between the training and validation cohorts. However, differences in grade, residual disease status after debulking surgery, ASA score, lymphatic invasion status, type of treatment, ISC, and post-operative CA-125 level were observed between the 2 groups.
Table 1
Patient demographics and clinical characteristics of the training cohort and test cohort
2. Target year selection and important feature selection for development of the GB model
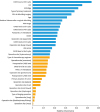
The evaluation of prediction accuracy of GB model over the train set at the discrete time point revealed that the prediction accuracy was highest at the second year (Supplementary Fig. 1). The median AUC of survival prediction at the second year was 0.74 (95% confidence interval [CI]=0.71–0.79). Therefore, we used the second-year survival data as the target year upon which the GB model was trained and validated through 100 bootstrap resampling repetitions with a gradual reduction in the number of variables. A list of the variables used in the analysis with descriptions is provided in Supplementary Table 1, and variables (n=34) by relative rank or importance of variables (result of quantifying the association with second-year OS) are shown in Fig. 2. As a result of Wilcoxon test, the highest AUC is shown at the 18th variable (0.830; 95% CI=0.802–0.853) (Fig. 3). The 18 selected variables are shown in top in Fig. 2, and the AUC of the final model validated with resampling repetitions over those features is shown in Supplementary Fig. 2.
Fig. 2
Bar graph showing clinical features by relative rank of variables to second year overall survival.
ASA, American Society of Anesthesiologist; CA-125, cancer antigen 125; EBL, estimated blood loss; FIGO, International Federation of Gynecology and Obstetrics; ISC, interval from surgery to chemotherapy; LN, lymph node.
3. Cox proportional hazards model for predicting second year OS probability
All variables of training cohort were analyzed with CoxPHR for second year OS. The CoxPHR analysis found six significant covariates for second year OS (age, cell grade, histology, postoperative CA-125 level, lymphatic metastasis in para-aortic lymph node, and estimated blood loss during surgery) (Supplementary Table 2). In the internal validation, the AUC of the receiver operating characteristic curves of the second year OS probability with CoxPHR model was 0.668 (95% CI=0.617–0.719) with six covariates (Supplementary Fig. 3).
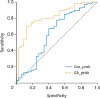
4. External validation and performance comparison in predicting second year OS probability
The performances of the CoxPHR model and the GB model were finally tested with the external validation cohort. The AUC of the second year OS probability was 0.597 (95% CI=0.474–0.719) with the CoxPHR model and 0.843 (95% CI=0.833–0.853) with the GB model (Fig. 4). The difference between the AUCs of the second year OS probability was statistically significant according to Hanley and McNell's method (p=0.0016). We also compared the final results with other machine learning models and logistic regression, and GB model outperformed the others (shown in Supplementary Table 3).
5. GB model-guided staging categorizes patients into prognostic subgroups more accurately than the FIGO staging
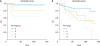
Based on the survival probability scores predicted by the GB model, patients were divided evenly into 4 subgroups (A, B, C, and D) according to the survival probability scores predicted by the GB model. Each subgroup with survival probability score is shown in Supplementary Table 4. Kaplan-Meier curves were drawn by 4 subgroups (A, B, C, and D) according to the survival probability scores predicted by the GB model of the test cohort, and Kaplan Meier curves were more discriminately classified (Fig. 5A) compared to Kaplan-Meier curves by the FIGO stage groups (I, II, III, and IV; Fig. 5B). As result of log-rank tests, the differences between the curves of subgroups A and C were significant (p=0.003, hazard ratio [HR]=11.1; 95% CI=3.60–34.57), and the curves of subgroups B and C were significantly different (p=0.015; HR=4.25; 95% CI=1.49–12.15). Also, the curves of subgroups C and D were also significantly different (p=0.0482; HR=2.1; 95% CI=1.00–4.46). However, the differences between the subgroups by FIGO stages were not clearly shown in the Kaplan-Meier survival curve compared to the GB model (Fig. 5B). There were no significant differences between the neighboring FIGO stage curves. There was a significant difference only between the FIGO stage I and IV curves (p=0.0001; HR=5.2; 95% CI=1.61–16.52).
Fig. 5
Kaplan-Meier survival curves for OS in the validation cohort based on the subgroup (A, B, C, and D) according to the second-year OS probability scores predicted by the GB model (A) and subgroup according to FIGO stage (I, II, III, and IV) (B).
FIGO, International Federation of Gynecology and Obstetrics; GB, gradient boosting; OS, overall survival.
DISCUSSION
In this study, we applied a GB model as the machine learning classifier to predict the OS of EOC patients by making use of the sequential CA-125 level during adjuvant chemotherapy after initial debulking surgery and other clinical factors. In the internal validation and external validation, we demonstrated that the GB algorithm accurately predicted the second-year OS rate in EOC patients. Moreover, GB-guided staging identified four distinct subgroups that were classified more clearly than those using FIGO stage.
Accurate prediction for individual patient is still difficult with conventional statistical methods because most of clinical characteristics show multidimensional and non-lineal relationship [16]. GB method is one of the machine learning methods that is highly flexible in detecting and recognizing complex non-linear relationships between variables. Compared to FIGO staging predicting with only factors related to tumor, the GB model can provide more individualized prediction based on various factors. To the best of our knowledge, current study is the first study to use a machine learning classifier for the prognostic prediction of endpoint of OS in EOC patients using factors including sequential CA-125 level during adjuvant treatment after initial debulking surgery. Using our model, clinicians can make more accurate predictions for individual patient.
GB model is capable for recalculating patient's prognosis by adding factors sequentially (i.e., factors indicating the compliance to ongoing therapy, such as CA-125 level). Although CA-125 is a useful marker that is closely related with the progression of disease and the treatment effect in EOC, most published survival prediction models for EOC do not employ CA-125 as a prognostic factor [1718192021]. Previous studies have demonstrated the prognostic or predictive values of CA-125 as a single value (e.g., nadirs, thresholds, or normalizations) [112223] or kinetic parameters in different time periods (e.g., percentage decrease) [2425], half-life [12], or AUC [26]. However, there have been no prediction models for estimating accurate prognosis using CA-125 level, and previous survival-predicting models failed to reflect the result of time sequential CA-125 level. The current study showed that the time sequential serum level of CA-125 can be a useful covariate for predicting OS in EOC patients. This study also showed that GB-based staging more clearly classified the prognostic subgroups compare to FIGO staging.
We noted a few potential limitations. Data were collected retrospectively, and were based on the inherent accuracy of patient records. Therefore, our study may have biases especially with incomplete data collection. For external validation, we used the data of EOC patients from other institution. However, due to the various numbers of variables required, patients without sufficient information were inevitably excluded from the test cohort. These limitations may have led to different characteristics between train and test cohort. There were differences between the training cohort and the external validation cohort except for age, stage, and histology. There were differences in type of treatment between train and test cohort. Although patients with primary debulking surgery and adjuvant chemotherapy were mostly included in both train and test cohort, there were no patients group with neoadjuvant chemotherapy in test cohort. This could lead to differences in survival, and could also affect the accuracy of analysis. However, since it is not comparison study of 2 groups, characteristics of 2 groups are not obligated to be evenly distributed. We think differences between train and test set is allowed, and it may shows generality of the model to work in various patient groups. In development of GB model, second year OS was selected as target for feature selection. It could be limitation of our analysis with expectation of predicting prognosis specifically for only second year OS. Selecting second year OS was not planned based on theoretical background, but performed in the process of obtaining more accurate results. It was selected with highest median AUC of survival prediction among other years, and finally, GB model-guided staging showed more accurate result compared to FIGO staging. Racial and national differences were not considered as the study was performed in the single nation. With regard to the generalizability of this prediction model, validation with other races or other nations may be needed. In our study we used only clinicopathologic information of EOC patients. Lack of genomic data in analysis can be our limitation. Zou et al. [27] reported algorithm of discriminating cancer types for circulating tumor cells or cell-free DNAs in blood trained and validated on a large dataset with high accuracy. In similar perspective, adding genomic data to further analysis could result in higher accuracy of prognostic prediction. With the GB model, additional clinical information would provide more accurate results compared to the currently used Cox proportional hazards regression analysis. The use of larger-scale studies could potentially yield improved prognostic predictions of the GB model in the future.
In summary, our GB model accurately predicted survival outcomes and successfully classified prognostic subgroups in patients with EOC. These may be useful for better estimation of individual outcomes and for selecting better treatment options in EOC patients.
 XML Download