

 PDF
PDF ePub
ePub Citation
 Print
Print


INTRODUCTION
Gliomas account for 29% and 81% of all primary and malignant cerebral tumors, respectively (1). Currently, structural magnetic resonance imaging (MRI) is the most commonly accepted diagnostic method for identifying gliomas. However, enhancement of low-grade gliomas (LGGs) and certain high-grade gliomas (HGGs) is sometimes not observed on post-contrast T1-weighted imaging (T1WI). This lack of enhancement occurs despite the use of contrast and additional MRI sequences, such as diffusion-weighted imaging, T2-weighted fluid-attenuated inversion recovery (FLAIR), and perfusion-weighted imaging, which may lead to potential difficulties in differentiating non-enhancing gliomas from non-tumor lesions arising from gliosis, encephalomalacia, demyelination, or inflammation (2).
To overcome these structural MRI deficiencies, metabolic imaging techniques have been used as supplementary approaches to obtain information on tissue biological processes and diagnose gliomas. Positron emission tomography (PET) and magnetic resonance spectroscopy (MRS) are metabolic imaging techniques with potential applications in cerebral tumor imaging (3). These techniques can be used to acquire information about tumor-related physiological processes, metabolic pathways, and molecular events.
MRS provides important metabolic information on N-acetylaspartate (NAA), choline (Cho), and creatine levels, which are useful for characterizing gliomas and surrounding normal brain tissue (456). A previous study reported that, at a maximum Cho/NAA index (CNImax) threshold of 2.0, tumor infiltration in HGGs and LGGs could be predicted with probabilities of 90% and 87%, respectively (7). However, when gliomas invade ventricular systems, blood vessels, scalp fat, and skull lipids can affect MRS image quality, which makes the CNImax unreliable for preoperative diagnosis.
In addition to MRS, various biological processes in gliomas can be noninvasively imaged using PET. Of the numerous radiotracers synthetized to distinguish between brain tumors, 11C-methionine (11C-MET) is highly useful (389). 11C-MET PET has relatively low background activity in normal brain tissue, which allows it to differentiate between gliomas and non-tumor lesions with high specificity and sensitivity (10). Although the sensitivity of 11C-MET PET ranges between 76–100% according to different studies, its sensitivity is comparatively lower when there is a higher percentage of non-enhancing LGGs (10).
11C-MET PET can still be reliable in areas of reduced MRS image quality, whereas MRS results can be referred to when gliomas are hypometabolic on 11C-MET PET. Considering the advantages and limitations of 11C-MET PET and MRS, we sought to assess whether a combination of these imaging techniques could facilitate accurate diagnosis of non-enhancing supratentorial gliomas.
Go to : 
MATERIALS AND METHODS
Study Population
This retrospective study included patients with non-enhancing supratentorial lesions on contrast-enhanced MRI admitted between February 2012 and December 2017. Patients who had previously undergone surgery, chemotherapy, or radiotherapy were excluded. One hundred and nine patients with non-enhanced supratentorial lesions visible on contrast-enhanced MRI were enrolled in this study. MRS and 11C-MET PET were performed for each patient. Treatment was started within a month of the latest imaging-based diagnosis. Histological diagnosis was based on biopsy or resection, depending on availability. For neurological diseases, diagnoses were made according to medical criteria by two blinded neurologists. The study was approved by the Institutional Review Board of Huashan Hospital, and informed consent was obtained from all study participants.
MRI
An 8-channel head coil 3T iMRI suite (Siemens Healthineers, Erlangen, Germany) was used to perform MRI. For imaging-based diagnosis, T1WI and T2-weighted imaging (T2WI) were obtained for each patient before performing MRS.
The conventional MRI protocol consisted of a sagittal T1 FLAIR sequence (repetition time [TR]/echo time [TE]/inversion time [TI], 2000/9/860 ms), an axial T2-weighted turbo spin-echo sequence (TR/TE, 6000–7540/95–98 ms), axial T1 FLAIR sequence (TR/TE/TI, 2000/9/860 ms), axial T2 FLAIR sequence (TR/TE/TI, 8500/94/2440 ms), and axial T1-weighted contrast-enhanced gradient-echo sequence (TR/TE, 2000/9 ms). To obtain MRI data for navigation purposes, a three-dimensional (3D) anatomic magnetization-prepared rapid-acquisition gradient-echo sequence (TR/TE/TI, 1900/2.94/900 ms; field of view [FOV], 250 × 250 mm; 1-mm isotropic resolution; 176 slices) or turbo spin-echo sequence (TR/TE, 3200/332 ms; FOV, 250 × 250 mm; slice thickness, 2.0 mm; 64 slices) was performed.
MRS Imaging
The MRS parameter settings used in this study have been previously published (7). A multivoxel point-resolved spectroscopic sequence (TR/TE, 1700/135 ms; 15-mm section thickness; FOV, 120 × 120 mm; phase encoding, 16 × 16) was used. To achieve water suppression, three chemical shift-selective pulses were used. On T2WI, the size of the chemical shift imaging slice was larger than the largest diameter of the lesion. The region of interest (ROI) was placed on the abnormal signal region on T2WI. Areas of skull lipid and scalp fat were carefully avoided because they could have compromised imaging quality. After image acquisition, the raw data were exported to a post-processing workstation.
MRS Data Processing
A Siemens Syngo workstation (syngo MultiModality Workplace, Siemens Healthineers) was used for reconstructing and analyzing the raw spectral data. The spatial distribution of the metabolite was generated by fitting a curve to the peak area. Within each volume of interest, Cho and NAA were estimated and expressed as integral ratios. The Cho/NAA index (CNI) was calculated for each voxel. A rainbow-colored look-up table comprising the CNIs was created utilizing an overlaid grid, which suggested the anatomical position of the CNIs. The MRS results were considered positive when CNImax was ≥ 2.0 and negative when CNImax was < 2.0.
11C-MET PET Imaging
Each patient underwent 11C-MET PET using a 3D PET scanner (Biograph 64, Siemens Healthineers). Data acquisition began 15 minutes after an intravenous bolus injection of 10 mCi 11C-MET at the PET Center of Huashan Hospital. Fasting was not required for 11C-MET PET because no collateral effects have been reported. Before 11C-MET PET scanning, computed tomography (CT) was performed for attenuation correction and image fusion. A 3D acquisition mode was used to acquire 11C-MET PET images during a 15-minute static scan. The spatial resolution of the CT scanner in the axial and tangential directions was 1.5 mm. By applying manufacturer workstation and post-reconstruction 3D gaussian filter smoothing, image reconstructions were achieved with filtered back projection at a maximum full width of 3.5 mm.
11C-MET PET Data Processing
The tumor to normal tissue (T/N) ratio was chosen for semi-quantitative analysis. First, 3D spherical ROIs covering the entire lesion were drawn, and the maximum standardized uptake (SUVmax) value inside the ROI was measured. For the T/N ratio, a circular ROI (7-mm diameter) was placed on the most intense lesion area and centered on the pixel with the SUVmax. Another ROI was positioned on an unaffected corresponding contralateral region. If the lesion had affected the contralateral region, the ROI was placed on an intact region of the contralateral hemisphere (11). The mean radiotracer uptake in the lesion ROI divided by the reference ROI value was defined as the T/N ratio. The 11C-MET PET results were considered positive when the T/N ratio was ≥ 1.3 and negative when the T/N ratio was < 1.3.
Final Diagnosis
For histopathological evaluation, samples were obtained by biopsy or resection based on the treatment strategy. When the lesion was resectable, maximally safe lesion resection was conducted with navigation guidance. Otherwise, needle biopsy was performed according to the 11C-MET PET and MRS results. The samples were fixed in 10% formalin and embedded in paraffin. Hematoxylin-eosin stained sections of all of the samples were reviewed by two blinded neuropathologists and categorized according to the 2016 World Health Organization Classification of Tumors of the Central Nervous System. When surgical findings were unavailable, two blinded neurologists made a definite diagnosis according to clinical evidence-based medical diagnostic criteria.
Statistical Analysis
For MRS images, a CNImax threshold of 2.0 was set as the cut-off value for distinguishing between gliomas and non-tumor tissues as previously reported (7). Meanwhile, a T/N ratio of 1.3 was applied as the cut-off threshold for 11C-MET PET images (11). These thresholds were used to calculate the sensitivity and specificity. A lesion was considered a glioma when 11C-MET PET or MRS results were positive, and a lesion was classified as non-tumor tissue when 11C-MET PET or MRS results were negative. Following this, the imaging-based diagnostic results were compared with the final diagnosis to determine their diagnostic capability. McNemar's test was performed to compare the sensitivity and specificity of the combination of 11C-MET PET and MRS as well as those of the individual techniques. A p value of < 0.05 was considered statistically significant. SPSS software (version 21, IBM Corp., Armonk, NY, USA) was used to analyze the data.
Go to :
RESULTS
Patients
Patient characteristics and clinical data are summarized in Table 1. Of 109 patients, 72 and 31 had resection- and needle biopsy-based histological diagnoses, respectively. The remaining six patients were diagnosed by two blinded neurologists according to clinical evidence-based medical diagnostic criteria. These patients were diagnosed with inflammation (n = 2), autoimmune encephalopathy (n = 1), cerebral vasculitis (n = 1), demyelination (n = 1), and epilepsy (n = 1). In the patient with epilepsy, there was abnormal signal in the limbic system on MRI; however, there was no progression during the 3-year follow-up period, leading to the diagnosis of a benign lesion. Patient pathological findings are summarized in Table 2.
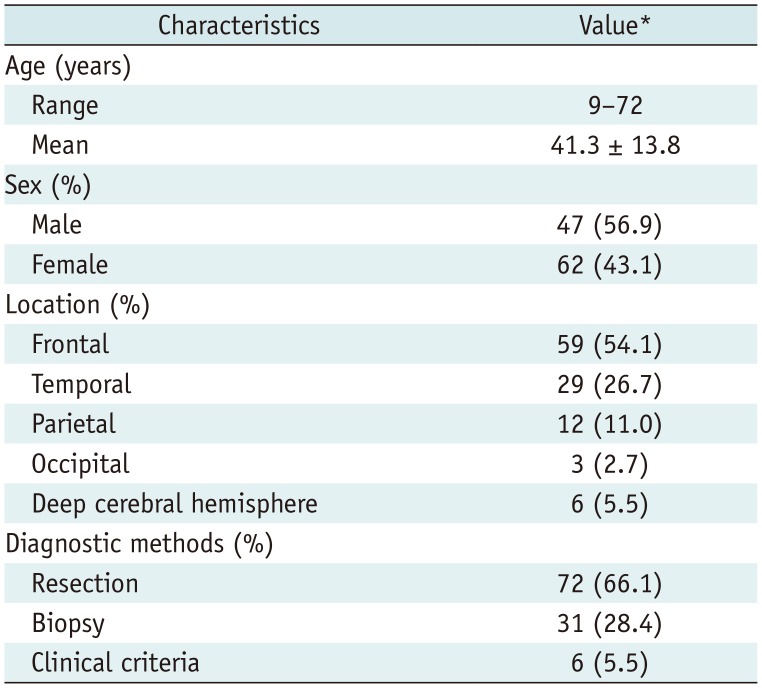
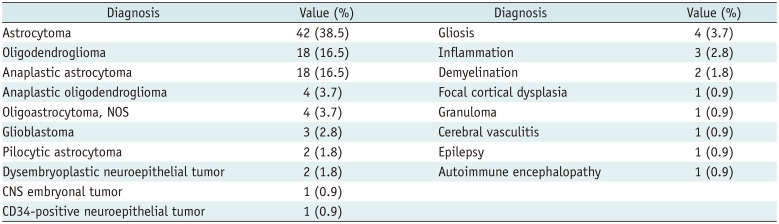
Table 1
Patients' Characteristics and Clinical Data
![]()
Table 2
Pathological Findings of Patients
![]()
Diagnostic Capability
The sensitivity, specificity, and diagnostic accuracy for glioma diagnosis were calculated for MRS images with a CNImax threshold of 2.0. For 11C-MET PET images and the combined techniques, the sensitivity, specificity, and diagnostic accuracy for glioma diagnosis were calculated with a T/N ratio threshold of 1.3. The diagnostic capabilities are summarized in Table 3.
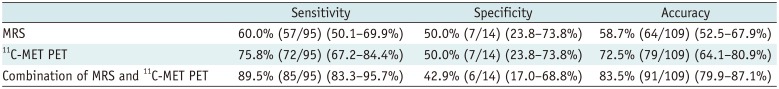
Table 3
Diagnostic Capabilities
![]()
The combination of the MRS and 11C-MET PET techniques substantially increased the sensitivity of the radiological diagnosis for non-enhancing supratentorial gliomas. The difference between the combined approach and MRS alone was obvious. Compared with the sensitivity of MRS alone, the sensitivity of the combined approach was 29.5% higher, resulting in a significant difference (89.5% vs. 60.0%, p < 0.001). Statistically significant differences in sensitivities were also observed between the combined techniques and 11C-MET PET alone (89.5% vs. 75.8%, p = 0.001). However, no statistically significant differences in specificities were noted between the combined and individual approaches (MRS alone, 42.9% vs. 50.0%, p = 1.000; 11C-MET PET alone, 42.9% vs. 50.0%, p = 1.00). Upon comparing 11C-MET PET and MRS, 11C-MET PET showed better sensitivity (p = 0.029), but equal specificity (p = 0.480) (Fig. 1).
 | Fig. 1Sensitivities and specificities of MRS, 11C-MET PET, and MRS and 11C-MET PET combined.There are significant differences in sensitivities (p < 0.05), but not specificities (p > 0.05) between three groups. *p > 0.05, **p < 0.05. MRS = magnetic resonance spectroscopy, 11C-MET PET = 11C-methionine positron emission tomography
|
The false negative cases for MRS alone were as follows: Twenty astrocytomas, seven oligodendrogliomas, six anaplastic astrocytomas, two dysembryoplastic neuroepithelial tumors, one oligoastrocytoma, one CD34-positive neuroepithelial tumor, and one anaplastic oligodendroglioma. The false negative cases for 11C-MET PET alone were as follows: Twelve astrocytomas, three oligodendrogliomas, three anaplastic astrocytomas, two dysembryoplastic neuroepithelial tumors, one oligoastrocytoma, and one anaplastic oligodendroglioma. The false positive cases for the combination of MRS and 11C-MET PET were as follows: Three gliosis, one focal cortical dysplasia, one granuloma, one demyelination, one inflammation, and one autoimmune encephalopathy. The false negative cases for the individual and combined approaches were as follows: Five astrocytomas, two oligodendrogliomas, two dysembryoplastic neuroepithelial tumors, and one oligoastrocytoma.
Effect on Clinical Management
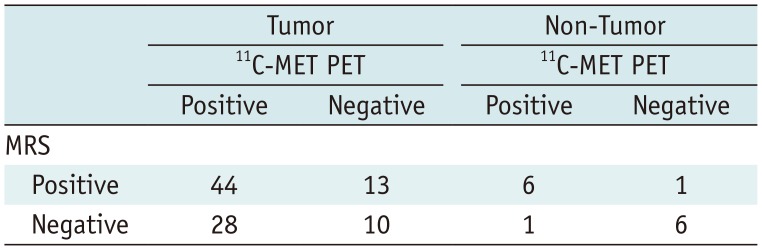
A cross table of the 11C-MET PET and MRS results are presented in Table 4. Of the recruited patients, 45 had a normal CNImax; however, 29 (64.4%; 29/45) patients were reconsidered for surgery because positive 11C-MET PET uptake (i.e., T/N ratio ≥ 1.3) was detected. The treatment of these patients could have been delayed if the results had been based on MRS alone (Fig. 2).
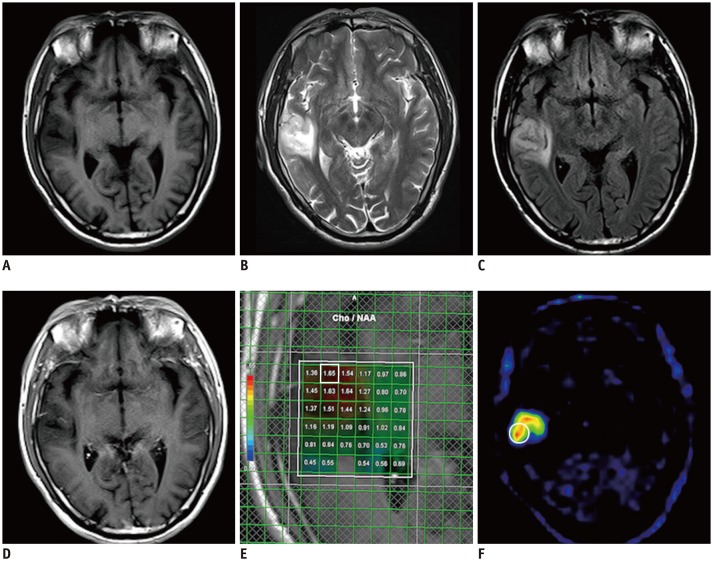 | Fig. 2Representative case of anaplastic oligodendroglioma in 53-year-old man.
A. T1-weighted MRI showing low-intensity lesion in right temporal lobe. B. T2-weighted MRI showing hyperintense lesion in right temporal lobe. C. FLAIR MRI outlining margin of lesion. D. Non-enhanced lesion on post-contrast T1-weighted MRI acquired after Gd-DTPA injection. E. MRS result showing CNImax of 1.65. F.
11C-MET PET showing strong MET uptake in lesion (SUVmax, 5.4; T/N ratio, 3.3). Surgery was performed based on combined MRS and 11C-MET PET findings, and diagnosis was confirmed as anaplastic oligodendroglioma (WHO III). White square (□) shows ROI for CNImax, and white circle (○) shows ROI for calculating T/N ratio. Cho = choline, CNImax = maximum Cho/NAA index, FLAIR = fluid-attenuated inversion recovery, Gd-DTPA = gadolinium-diethylenetriamine pentaacetic acid, MET = methionine, NAA = N-acetylaspartate, ROI = region of interest, SUVmax = maximum standardized uptake, T/N = tumor to normal tissue, WHO = World Health Organization
|
Conversely, of the 30 patients who were misdiagnosed earlier due to reliance on 11C-MET PET scans alone, 14 (46.7%; 14/30) benefited from the supplementary evidence provided by MRS (Fig. 3).
 | Fig. 3Representative case of astrocytoma in 33-year-old woman.
A. T1-weighted MRI showing low-intensity lesion in right frontal lobe. B. T2-weighted MRI showing hyperintense lesion in right frontal lobe. C. FLAIR MRI outlining margin of lesion. D. Non-enhanced lesion on post-contrast T1-weighted MRI acquired after Gd-DTPA injection. E. MRS result indicating glioma (CNImax, 3.04). F.
11C-MET PET showing no visible accumulation in lesion (SUVmax, 2.1; T/N ratio, 0.9). Surgery was performed based on combined MRS and 11C-MET PET findings, and diagnosis of astrocytoma was confirmed (WHO II). White square (□) shows ROI for CNImax, and white circle (○) shows ROI for calculating T/N ratio.
|
Go to :
DISCUSSION
11C-MET is a sensitive radiotracer for glioma detection because it can distinguish between gliomas and non-neoplastic pathologies with high sensitivity and specificity. Such differentiation is possible because of the relatively low background activity of 11C-MET in normal brain tissue. As a result, 11C-MET has been applied to the diagnosis and prognosis of gliomas (1213), differentiation of glioma recurrence from radiation injury (1415), and surgical (1116) and radiotherapy planning (1718).
Previous research has established that 11C-MET PET is more accurate for glioma diagnosis than CT (19), and other studies have suggested that 11C-MET PET is superior to MRI and 18F-fluorodeoxyglucose PET (1220). Ribom et al. (13) reported increased 11C-MET uptake in 30/32 (94%) LGGs, whereas only 12/32 (38%) showed increased 11C-MET uptake with contrast enhancement. In our study, increased 11C-MET uptake was detected in 94/109 (86.2%) gliomas. 11C-MET PET accuracy for the differential diagnosis of gliomas has been shown in several studies. In LGGs and HGGs, the overall sensitivity of 11C-MET PET ranged from 76% to 100% (10). In most studies, the T/N ratio was routinely used for calculating the sensitivity and specificity. The cut-off value was typically set as 1.3, and the sensitivity and specificity of 11C-MET PET for glioma diagnosis were 87% and 89%, respectively (11). Applying the same T/N ratio cut-off value in this study, the 11C-MET PET sensitivity reached 75.8%. This finding might be explained by the sensitivity being reduced with the inclusion of a higher proportion of gliomas (10). Moreover, clinicians are more concerned with overall 11C-MET PET accuracy in practice. Our results had an accuracy of 72.5%, whereas Herholz et al. (8) reported an overall 11C-MET PET accuracy of 79% for a large-scale study of 196 patients.
Although 11C-MET PET can provide additional diagnostic information, in clinical practice, it is not the first choice for glioma differentiation due to its use of radioisotopes, cost, and long acquisition times. Conversely, MRS can be obtained during routine MRI and is, thus, cheaper and more convenient. This technique has been widely used to acquire additional diagnostic information and reflects the histological features of gliomas. In LGGs with hypometabolic 11C-MET uptake, MRS is better than 11C-MET PET at detecting the metabolic features of gliomas. Therefore, MRS is a valuable tool for tumor differentiation, grading, and biopsy and radiotherapy planning (4212223). Previous research on the relationship between glioma metabolism and the CNI has revealed that CNI thresholds of 2.0, 1.5, 1.0, and 0.5 appeared to predict tumor-containing samples with probabilities of 90%, 79%, 60%, and 38% for HGGs and 87%, 67%, 39%, and 16% for LGGs, respectively (7).
In our study, the CNImax was > 2.0 in 79/109 patients; however, MRS indicated a diagnostic sensitivity of only 60.0%. This finding could be attributed to the limitations of MRS. First, the results depended on sequence settings. Thus, parameter optimization is crucial for securing reliable results. Second, MRS requires full patient cooperation because patient movement affects the signal-to-noise ratio and leads to an unstable baseline. Moreover, tumor heterogeneity may result in a false-negative result. Finally, the image quality will be affected when gliomas occupy or are near ventricular systems, skull lipids, or scalp fat. Thus, for lesions located in these areas, 11C-MET PET could yield a better diagnosis than that of MRS.
Considering the imaging characteristics of 11C-MET PET and MRS, we evaluated whether the combination of these techniques could overcome their individual deficiencies and lead to higher diagnostic accuracy for non-enhancing supratentorial glioma. In our study, the sensitivity differences between the combined approach and MRS or 11C-MET PET alone were significant. Compared with MRS, 11C-MET PET had enhanced sensitivity and equal specificity, which suggested its superiority to MRS. However, 11C-MET PET is radioactive, expensive, and poses practical difficulties. Thus, because MRS is more convenient, inexpensive, and non-radioactive, it may be an ideal first choice when non-enhancing glioma is highly suspected. If the CNImax is < 2.0 on MRS, then 11C-MET PET is highly recommended because it greatly reduces the rate of missed diagnoses. As a result, a combination of MRS and 11C-MET PET can substantially increase radiological diagnostic sensitivity for non-enhancing supratentorial gliomas without greatly reducing specificity.
However, the combination of MRS and 11C-MET PET may increase the number of false positives. An increased CNImax has been observed in other intracranial tumors, such as lymphoma (24), and some non-tumor lesions caused by encephalitis, demyelination, or vasculitis (2526). Demyelination, cerebral infarction, hematomas, or acute or subacute cerebral ischemia elevate 11C-MET uptake (811). In our study, the false positives associated with the combination of MRS and 11C-MET PET included gliosis, focal cortical dysplasia granuloma, inflammation, granuloma, and demyelination. However, there was no significant difference in the number of false positives between the combined and individual approaches.
The combination of MRS and 11C-MET PET led clinicians to seek further histological or clinical diagnosis rather than resort to the wait-and-watch strategy. Although the wait-and-watch strategy has led to better quality of life scores in patients with suspected LGG (27), early surgical intervention has been associated with a longer overall survival time compared with this strategy (28). Afra et al. (29) found that the overall survival of patients with LGG was adversely impacted by seizure history duration prior to surgery and, therefore, recommended surgical intervention in patients with seizures and imaging results indicative of LGG. Several studies have reported that asymptomatic LGGs were safer to resect than symptomatic LGGs. Moreover, asymptomatic LGGs were associated with better overall survival. These findings suggest the potential benefits of performing surgery before lesions become symptomatic (3031). The early interventions described were based on sensitive auxiliary imaging methods used to avoid misdiagnosis, which supports the combination of MRS and 11C-MET PET as a more practical approach in clinical contexts.
Our study has some limitations. First, there is currently no consensus in the literature concerning the pathological CNImax and 11C-MET PET cut-off values. The use of different cut-off values may lead to divergent results. Therefore, a reliable cut-off value is needed. Moreover, our study was retrospective and based on a relatively small patient sample. Therefore, to validate our findings, a prospective study with greater patient recruitment and a longer follow-up period is needed.
In conclusion, the combination of MRS and 11C-MET PET can considerably improve accurate diagnostic sensitivity for non-enhancing supratentorial gliomas without significantly lowering specificity. This finding suggests that this combined approach should be highly reliable for clinical applications.
Go to :
 XML Download