

 PDF
PDF ePub
ePub Citation
 Print
Print


INTRODUCTION
In patients with repaired tetralogy of Fallot (TOF), postoperative pulmonary regurgitation (PR) commonly leads to gradual dilation and dysfunction of the right ventricle and ultimately results in poor clinical outcomes such as exercise intolerance, ventricular arrhythmia, and sudden cardiac death (1). Therefore, pulmonary valve replacement (PVR) is performed before the chronically volume-overloaded right ventricle reaches the point of no return (2). To find the optimal timing of PVR in asymptomatic patients, imaging surveillance, generally with cardiac magnetic resonance imaging (MRI), is recommended with a time interval ranging from 2 to 4 years; however, the evaluations have been limited to adolescent and adult patients (345678910). Data characterizing the changes in ventricular volume and function as well as right ventricular (RV) volume load over the entire time course of TOF are currently lacking; however, obtaining such data is desirable to better understand the consequences of total surgical repair, especially the interaction between RV volume load and ventricular volume and function over time.
Cardiac computed tomography (CT) is increasingly being used even in small children with congenital heart disease (CHD) owing to its wide availability, short scan time, and excellent image quality (111213). With optimized CT protocols as described in a recently published guideline (14), radiation dose of cardiac CT can be reduced, e.g., median 5-year cumulative effective dose of 1.0 mSv (15), and concerns about radiation risks also can be dampened. In contrast, cardiac MRI in small children is mainly limited by long examination time requiring conscious sedation or general anesthesia and relatively low spatial resolution, which may partly explain sparse cardiac MRI data in young children with TOF in the literature. It has recently been reported that cardiac CT ventricular volumetry with semiautomatic three-dimensional (3D) threshold-based segmentation provides highly accurate and reproducible results even in newborns and infants with CHD (16171819), and can reduce measurement errors inherent in conventional two-dimensional cardiac MRI ventricular volumetry. In fact, cardiac CT was performed to evaluate cardiac function in approximately 15.4% of children with CHD in a recent multicenter study (20). As a result, cardiac CT data obtained from all treatment stages may provide better insights into the rate of detrimental effect of total surgical repair in TOF. Therefore, the aim of this study was to characterize the changes in RV volume, volume load, and function measured with cardiac CT over the entire time course of TOF.
Go to : 
MATERIALS AND METHODS
The Institutional Review Board of our hospital approved this retrospective study and waived the need for informed consent.
Study Population
Between September 2010 and December 2016, a total of 407 consecutive patients with TOF underwent two-phase (end-systolic [ES] and end-diastolic [ED] phases) cardiac CT at our institution. Of them, 33 patients with the following conditions were excluded from the study population: intraventricular baffling (n = 20), tricuspid valvuloplasty (n = 5), adults with unrepaired TOF (n = 4), placement of a right ventricle-pulmonary artery (PA) conduit (n = 2), associated Ebstein anomaly (n = 2), significant left-sided obstructive lesion or left-sided valvular regurgitation greater than grade 1 (n = 0), and severe pulmonary stenosis requiring interventional or surgical therapy (n = 0). As a result, 374 patients (median age at cardiac CT examination 10 years, range 0 day–45 years; 227 male patients, 60.7%) with 469 cardiac CT examinations were included in the study population. Follow-up studies were performed in 81 patients. Of 469 cardiac CT examinations, 138 examinations were performed before any surgical procedures; 20 examinations after palliative operation such as shunt, RV outflow tract (RVOT) stent placement, or RVOT widening; 285 examinations after total surgical repair consisting of closure of the ventricular septal defect and relief of RVOT obstruction; and 26 examinations after PVR, which comprised four treatment stages. The body surface area (BSA) at the cardiac CT examination was recorded from electronic medical records to calculate the indexed volumetric parameters. In postsurgical cases, operation dates were recorded from electronic medical records to calculate the postoperative duration (POD). From the operation records, the surgical techniques used for the relief of RVOT obstruction were specified as transannular patch repair in 87 patients and non-transannular patch repair in 54 patients.
Cardiac CT
Electrocardiography (ECG)-synchronized cardiac CT was performed with a second-generation dual-source scanner (SOMATOM Definition Flash; Siemens Healthineers, Forchheim, Germany) with 2 × 64 × 0.6-mm slices with z-flying focal spot technique, 0.28-second gantry rotation time, 75-ms temporal resolution, 0.75-mm slice width, and 0.4-mm reconstruction interval. For ECG-synchronized scanning, retrospective ECG gating (n = 268), combined prospective respiratory and ECG triggering (n = 163), or prospective ECG triggering (n = 38) was used depending on a patient's cooperativity. A combined tube current modulation (CARE Dose 4D; Siemens Healthineers) was used in all CT scans to reduce the radiation dose. Retrospectively ECG-gated spiral scan was obtained during inspiratory breath hold with an ECG-controlled tube current modulation (MinDose; Siemens Healthineers) and a biphasic chest pain protocol to reduce the radiation dose (21). For combined prospective respiratory and ECG triggering, additional respiratory triggering was applied with a pressure-sensing belt of a respiratory gating system (AZ-733V; Anzai Medical Co., Ltd., Tokyo, Japan) in free-breathing patients as previously described (2223). Free-breathing prospectively ECG-triggered sequential scanning was performed in smaller infants who were immobilized with a blanket and medical tapes as much as possible to reduce respiratory misregistration artifacts between imaging slabs that often develop in this scan mode.
The optimal CT radiation dose for each patient was based on body weight and size of the cardiac shadow on the scout image for retrospectively ECG-gated spiral scan (21) or based on the combination of cross-sectional area and mean body density for the prospectively ECG-triggered sequential scan with or without additional respiratory triggering (24). The determined radiation dose was entered before scan range adjustment to maximize the dose-saving effect of the combined tube current modulation (25). Dose-length product based on a 32-cm-sized phantom and effective dose based on dose-length product and age, sex, and tube voltage-specific conversion factors (26) of 469 cardiac CT examinations were 285.0 ± 295.9 mGy·cm and 4.2 ± 3.8 mSv, respectively.
An iodinated contrast agent (iomeprol [Iomeron 400], 400 mg I/mL; Bracco Imaging S.p.A., Milan, Italy; 1.5–2.0 mL/kg) was intravenously administered at an injection rate of 0.3–3.0 mL/s, using a dual-head power injector. To achieve uniform cardiovascular enhancement and minimal peri-venous streak artifacts from an undiluted contrast agent, a triphasic injection protocol for retrospectively ECG-gated spiral scanning and prospectively ECG-triggered sequential scanning or a quadriphasic injection protocol for combined prospectively respiratory- and ECG-triggered sequential scanning was used. In triphasic protocol, undiluted contrast agent was followed by 50%-diluted contrast agent and then by 5%-diluted contrast agent (contrast agent:saline = 5%:95%). In quadriphasic protocol, the first two phases of undiluted contrast agent were followed by a third phase of 50%-diluted contrast agent and then by a fourth phase of 5%-diluted contrast agent; injection rates were gradually diminished by 0.1–0.2 mL/s, mandatorily between the first and second phases and optionally between the other phases (23). The scan delay time was determined using a bolus tracking technique with a trigger threshold of 150 Hounsfield units in the left ventricular (LV) cavity.
Axial ES and ED CT image data with isotropic spatial resolution (approximately 0.5 × 0.5 × 0.5 mm) were reconstructed using the sinogram-affirmed iterative reconstruction (SAFIRE; Siemens Healthineers) strength 5 with a medium smooth kernel (I26f).
CT Ventricular Volumetry
The reconstructed cardiac CT image data were sent to a commercially available workstation (Advantage Windows 4.6; GE Healthcare, Milwaukee, WI, USA). A semiautomatic 3D threshold-based segmentation method allowing the exclusion of the papillary muscles and trabeculations from the ventricular cavity was used for ventricular volumetry. An optimal threshold was individually determined to separate the most compact interventricular septal myocardium from adjacent ventricular blood; then, the atrioventricular and semilunar valve planes were manually adjusted (16171819). From these ventricular volumes, the ventricular ejection fraction (EF) {= (stroke volume [SV]/end-diastolic volume [EDV]) × 100}, SV difference (= RV SV − LV SV), RV volume load fraction (= [SV difference/RV SV] × 100), and ES and ED RV/LV volume ratios were calculated. The SV difference and the RV volume load fraction have been used to quantitate PR in previous studies using cardiac MRI (2728). The measured volumes were normalized to the BSA.
Statistical Analyses
Statistical analyses were performed using SPSS statistical software version 24.0 (IBM Corp., Armonk, NY, USA). Continuous variables were expressed as mean ± standard deviation. The CT-measured variables were compared among the four treatment stages by using an unpaired t test. In the group after total surgical repair, the POD and the CT-measured variables were correlated with each other by using Pearson correlation. In the same group, the demographic and CT-measured variables were compared between the transannular patch subgroup and the non-transannular patch subgroup by using an unpaired t test. In addition, the early postoperative subgroup (≤ 2 years after total surgical repair or ≤ 1 year of age) was compared with the late postoperative subgroup and the preoperative group by using an unpaired t test. A p value of < 0.05 was considered statistically significant.
Go to :
RESULTS
No cardiac CT examinations were failed and all volumetric measurements were successfully performed.
Changes in CT-Based Measures over the Entire Course of TOF
The CT-based measures in the four treatment stages of TOF—consisting of the preoperative stage (stage 1), post-palliative surgery stage (stage 2), post-total surgical repair stage (stage 3), and post-PVR stage (stage 4)— are described in Table 1. All CT-based measures were statistically significantly different between stage 1 and stage 3 and between stage 2 and stage 3 (p < 0.001). The RV indexed end-diastolic volume (EDVi), RV EF, LV indexed end-systolic volume (ESVi), and LV EF were statistically significantly different between stage 1 and stage 2 (p ≤ 0.02), whereas other variables showed no statistically significant differences between the two stages (p = 0.056–0.840). All CT-based measures, except for RV ESVi, LV ESVi, and LV EDVi, revealed statistically significant differences between stage 3 and stage 4 (p < 0.04).
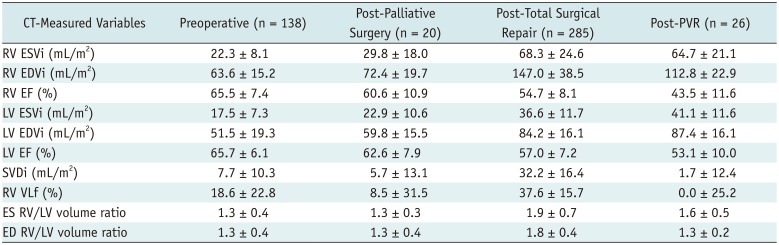
Table 1
Changes of CT-Based Measures over Entire Course of Tetralogy of Fallot
![]()
Correlations between POD and RV Measures after Total Surgical Repair
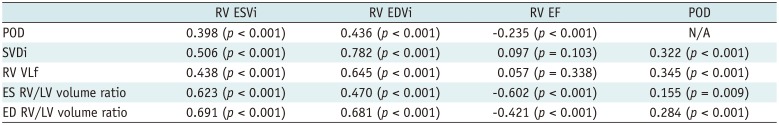
The Pearson correlation coefficients between POD and CT-based RV measures after total surgical repair are summarized in Table 2. High degrees of positive correlation (r = 0.506 and 0.782) were found between the RV volumes and the indexed SV difference (Fig. 1A), between the RV EDVi and the RV volume load fraction (Fig. 1B), between the RV volumes and the ED RV/LV volume ratio (Fig. 1C), and between the ES RV/LV volume ratio and the RV ESVi (Fig. 1D). The RV EF showed a high degree of negative correlation (r = −0.602) with the ES RV/LV volume ratio. No statistically significant correlation was found between the RV EF and the indexed SV difference, and between the RV EF and the RV volume load fraction. Others showed low-to-moderate degrees of positive or negative correlation. With increasing POD, Loess smoothed regression trend curves illustrated an early rapid increase (< 7 years after total surgical repair) followed by a slow increase and a plateau in the indexed ventricular volumes and the RV volume load parameters (Fig. 2). Interestingly, a declining trend was clearly observed in the RV volume load parameters approximately 26–27 years after total surgical repair (Fig. 2A, B). In contrast, the RV and LV EFs showed a linear decrease with increasing POD (Fig. 3).
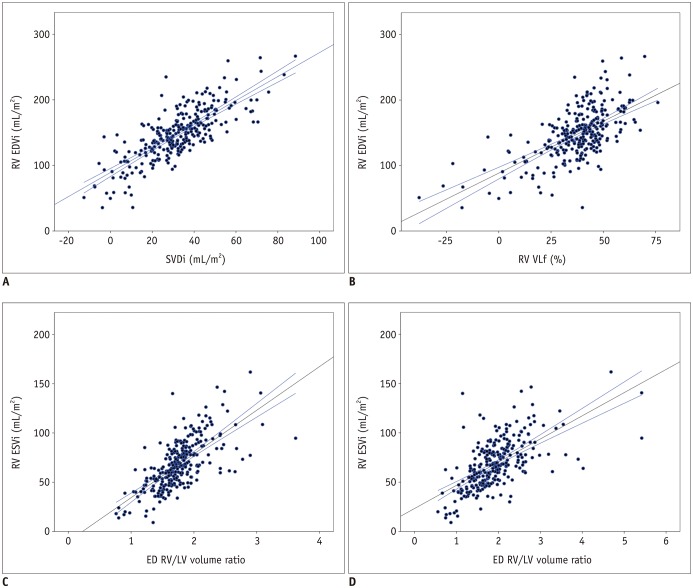 | Fig. 1Correlations between RV volumes, RV volume load parameters, and RV/LV volume ratios.
A. Scatter plot showing high positive linear correlation (r = 0.782) between SVDi and RV EDVi. B. Scatter plot showing high positive linear correlation (r = 0.645) between RV VLf and RV EDVi. C. Scatter plot showing high positive linear correlation (r = 0.691) between ED RV/LV volume ratio and RV ESVi. D. Scatter plot showing high positive linear correlation (r = 0.623) between ES RV/LV volume ratio and RV ESVi. ED = end-diastolic, EDVi = indexed end-diastolic volume, ES = end-systolic, ESVi = indexed end-systolic volume, LV = left ventricular, RV = right ventricular, SVDi = indexed stroke volume difference, VLf = volume load fraction
|
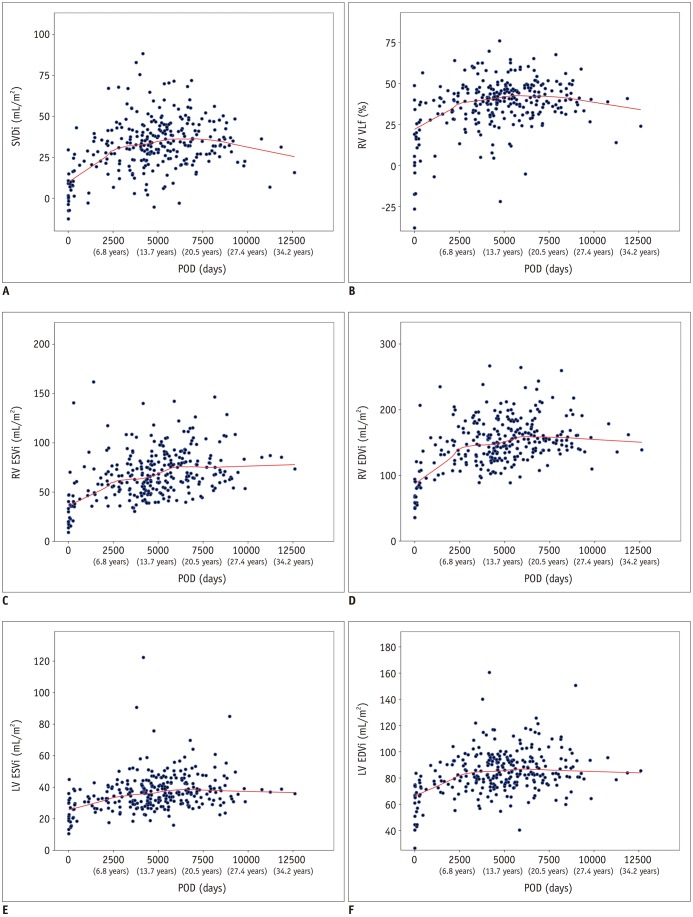 | Fig. 2Loess smoothed regression trends of RV volume load parameter and ventricular volumes with increasing POD.
A, B. SVDi and RV VLf showed staged trend characterized by early rapid increase, middle plateau, and late decline depending on POD. C–F. Indexed RV and LV volumes equally demonstrated early increase followed by plateau depending on POD. POD = postoperative duration
|
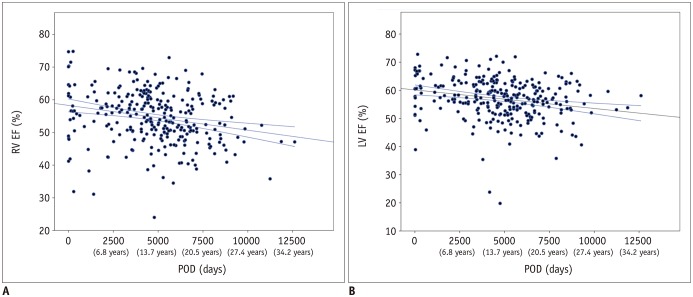 | Fig. 3Linear regression trends of ventricular function with increasing POD.
A. Scatter plot showing low negative linear correlation (r = −0.235) between RV EF and POD. B. Scatter plot showing low negative linear correlation (r = −0.229) between LV EF and POD. EF = ejection fraction
|
Table 2
Pearson Correlation Coefficients between POD and RV Measures after Total Surgical Repair
![]()
Comparison between the Transannular Patch and Non-Transannular Patch Subgroups
Comparisons of the demographic and CT-measured variables between the transannular patch and the non-transannular patch subgroups are shown in Table 3. Compared with the transannular patch subgroup, the non-transannular patch subgroup was younger at cardiac CT examination and had smaller BSA and shorter POD; however, there was no statistically significant difference in age at total surgical repair. Among the CT-based measures, only RV volume load fraction showed a statistically significant difference between the two subgroups.
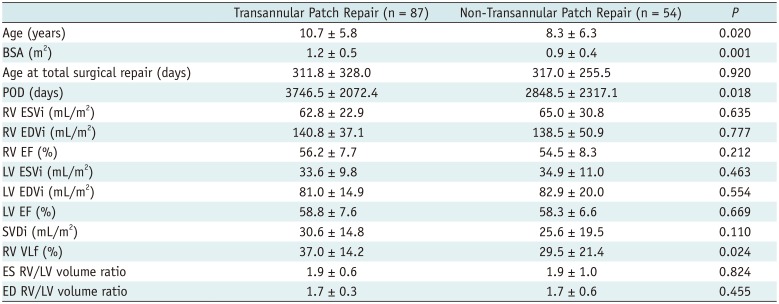
Table 3
Comparison between Transannular Patch and Non-Transannular Patch Subgroups
![]()
Comparison between the Early and Late Postoperative Subgroups
Comparisons of the demographic and CT-measured variables between the early (≤ 1 year of age or ≤ 2 years after total surgical repair) and the late postoperative subgroups are shown in Table 4. All variables showed statistically significant differences between the two subgroups (p < 0.05).
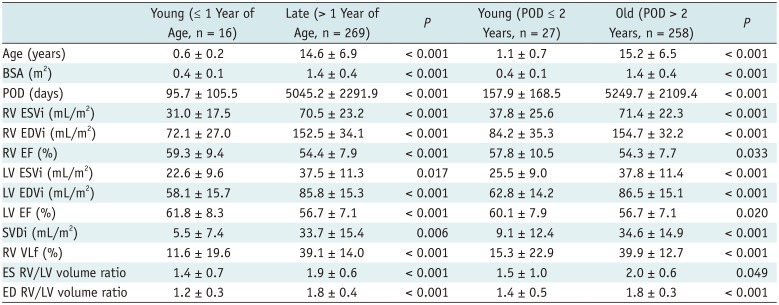
Table 4
Comparison between Early and Late Postoperative Subgroups
![]()
Comparison between the Early Postoperative Subgroup and the Preoperative Group
Compared with the preoperative subgroup, the early postoperative subgroup ≤ 1 year of age showed slightly larger BSA, slightly lower RV and LV functions, and slightly larger LV ESVi (p = 0.011–0.044) (Table 5). On the other hand, compared with the preoperative subgroup, the early postoperative subgroup ≤ 2 years after total surgical repair showed statistically significant differences in age, BSA, and volumes and functions of both ventricles (p ≤ 0.009) (Table 5). As expected, the differences were larger than those between the early postoperative subgroup ≤ 1 year of age and the preoperative subgroup. In contrast, the indexed SV difference, RV volume load fraction, and ES and ED RV/LV volume ratios revealed no statistically significant difference between the early postoperative subgroup ≤ 2 years after total surgical repair and the preoperative subgroup (p = 0.461–0.742) (Table 5).
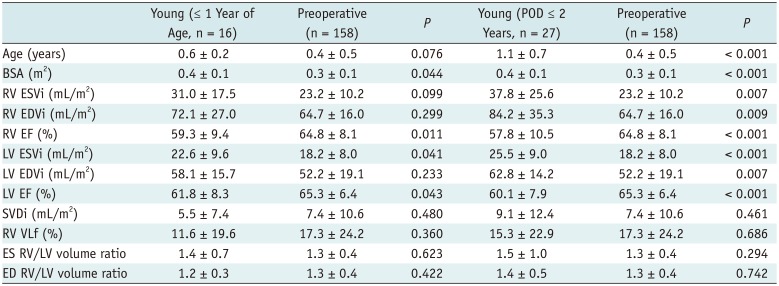
Table 5
Comparison between Early Postoperative Subgroup and Preoperative Group
![]()
Go to :
DISCUSSION
This study demonstrated the chronological changes in crucial cardiac functional parameters over the entire time course of TOF, as follows: a logarithmic increase in ventricular volumes and RV volume load and a linear decrease in ventricular function after total surgical repair, and a substantial decrease in the RV EDVi, RV volume load, RV/LV volume ratio, and ventricular EFs after PVR. These results are largely comparable to the results of previous studies based on short-term follow-up MRI data in adolescent and adult patients, which demonstrated a small annual increase (0.9–3.0 mL/m2) in RV EDVi long after total surgical repair in patients with significant PR (5678910) and marked reduction of RV volumes and PR early after PVR (2).
Compared with the preoperative values, increased ventricular volumes were found early (≤ 2 years after total surgical repair or ≤ 1 year of age) after total surgical repair in this study. This may be explained not only as a normalization process from TOF hemodynamics (represented as a small heart) after total surgical repair, but also as a consequence of PR, myocardial injury during relief of RVOT obstruction, and insertion of noncontractile materials. In a study using cardiac MRI with the feed-and-sleep technique (29), the RV and LV volumes and functions in 16 infants (≤ 1 year of age) who underwent total surgical repair showed normal values. In contrast, the results of the 16 infants ≤ 1 year of age in this study demonstrated slightly higher ventricular volumes and slightly lower RV EF than the published normal values (at the comparable BSA of 0.4) that were measured using cardiac MRI (30). These discrepant results may be resolved by future studies. It is noteworthy that 24% of cardiac MRI examinations failed in a previous study (29), but no cardiac CT examinations failed in the present study.
In 45 patients with repaired TOF who underwent two cardiac MRI examinations within 4 years, increased RV volumes and decreased RV EF were demonstrated early (POD ≤ 5 years) after total surgical repair and remained stable in the late follow-up period (POD > 5 years) (5). Similar differences in the rates of increase in RV volumes were observed in this study; however, the timing (approximately 7 years after total surgical repair) between the different rates was slightly later than the timing of 5 years reported in a previous study (5). On the contrary, RV EF linearly decreased without any noticeably different rates over the postoperative course in this study. Another striking difference between the two studies is the chronological change in PR fraction: no change in early follow-up (POD ≤ 5 years), a significant increase in late follow-up (POD > 5 years) proportional to POD in the previous study (5), and an increase in early follow-up (POD < 7 years) followed by a plateau and then by a decline (POD > 26–27 years) in this study. This late paradoxical decline in RV volume load might be due to impaired RV diastolic function resulting from longstanding severe PR. Large longitudinal follow-up studies in the same patients may elucidate these conflicting trends between the two studies. The early postoperative increase with no time lag in the ventricular volumes and the RV volume load parameters observed in this study is a new contradictory finding to the causal relationship classically postulated between PR and increased RV volume, and this needs to be further investigated.
RV volume and PR are influenced by the surgical techniques used for the total correction of TOF. Two patients with a right ventricle-PA conduit were excluded from the current study because the placement of a right ventricle-PA conduit was reported to result in different hemodynamic consequences, including less PR, smaller RV volumes, lower RV EF, and no correlation between PR fraction and RV EDVi compared with an RVOT patch (31). In this study, RVOT relief during total correction was achieved by using two different surgical techniques (i.e., transannular and non-transannular patch). Previous studies reported that transannular patch resulted in larger RV volumes and more PR than those obtained with non-transannular patch (528). Although slightly greater RV volume load fraction was observed in the transannular patch subgroup, no differences in RV volume and function were found between the two subgroups in this study. This finding might be a result of an improved surgical technique that involves limiting the size of the transannular patch.
This study has several limitations. First, this cross-sectional study comparing the different patient groups might not reflect a true longitudinal trend over the entire time course of TOF. In this respect, longitudinal studies are necessary to confirm the trends observed in this study. Second, there might be a selection bias in the study population, particularly in the post-palliative surgery and early post-total surgical repair patient groups, because cardiac CT might be more frequently requested in patients with clinical problems. Third, we should be careful to use cardiac CT as a follow-up imaging although average effective dose of cardiac CT in this study was found to be relatively low (4.2 mSv). With respect to potential radiation risks, prospectively ECG-triggered sequential scan delivering lower radiation dose than retrospectively ECG-gated spiral scan, should be used for cardiac function evaluation where appropriate.
In conclusion, that cardiac CT could provide information about the characteristic changes in RV volume, volume load, and function over the entire time course in a large cohort with TOF.
Go to :
 XML Download