

 PDF
PDF ePub
ePub Citation
 Print
Print


INTRODUCTION
The Consensus Development Conference on Osteoporosis defined osteoporosis as “a systemic skeletal disease characterized by low bone mass and microarchitectural deterioration of bone tissue, with a consequent increase in bone fragility and susceptibility to fracture” (1). Early detection and proper management are necessary for the prevention of osteoporotic fractures and complications (2). Bone mineral density (BMD), which can be measured using dual-energy X-ray absorptiometry (DXA), is the most widely used parameter for diagnosing osteoporosis and assessing fracture risk (23). Recent studies have indicated strong connections between marrow adipogenesis and osteoporosis pathophysiology. Osteoblasts and adipocytes are derived from the same progenitor cells. When the conversion of progenitor cells to adipocytes is dominant, bone formation and BMD decrease (4). Consequently, vertebral marrow fat has become a target for the diagnosis of osteoporosis. Magnetic resonance spectroscopy (MRS) is widely used as the gold standard for fat quantification (5678910), and many previous MRS studies have demonstrated a negative correlation between vertebral marrow fat content and BMD (89101112).
Various chemical shift-based water-fat separation techniques have been recently developed, and their results are consistent with those of MRS (131415). Many confounding factors affecting fat quantification when using water-fat separation techniques have been identified (141516). It is crucial to correct for the T2* shortening effect caused by the presence of trabecular bone, especially for vertebral marrow fat quantification (67). Multi-echo three-dimensional (3D) gradient echo imaging, which corrects for T1 bias and the T2* effect, allows for accurate fat fraction (FF) estimation and has the advantages of high spatial resolution and rapid acquisition (17181920). An additional advantage of this technique is that the R2* map is provided simultaneously with fat quantification since R2* is equivalent to 1/T2* (2122). To our knowledge, only a few studies have reported on the efficacy of R2* as a marker for osteoporosis (22). In the English literature, correlations between the FF, R2*, and BMD, including differences in the degree of correlation with age, have not been reported.
The purpose of our study was to investigate the relationships of T2*-corrected 6-echo Dixon volumetric interpolated breath-hold examination (VIBE) imaging-based FF and R2* values with BMD; determine their associations with sex, age, and menopause; and evaluate the diagnostic performance of the FF and R2* for predicting osteopenia and osteoporosis.
Go to : 
MATERIALS AND METHODS
Study Population
Institutional Review Board approval was obtained and informed consent was waived. This retrospective study enrolled 228 patients who had undergone DXA and lumbar spine magnetic resonance imaging (MRI) for the evaluation of lower back pain between July and December 2016. These patients underwent MRS and T2*-corrected 6-echo Dixon VIBE imaging. Patients who had previously undergone lumbar spinal surgery (n = 28) or had compression fractures at L4 (n = 21) or large osteophytes (n = 26) were excluded. Thus, the final study population consisted of 153 patients (69 men and 84 women; mean age, 63.2 ± 8.2 years; age range, 31–81 years). BMD was normal in 99 subjects. Osteopenia and osteoporosis were observed in 37 and 17 subjects, respectively. The men and women were divided into two subgroups according their age (≥ 50 years) and menopause status, respectively. Height and body weight data were collected from each subject's medical records. There were significant differences in age, vertebral BMD, and T-scores between men and women; however, there was no difference in body mass index. The demographic and clinical characteristics of the study population are listed in Table 1.
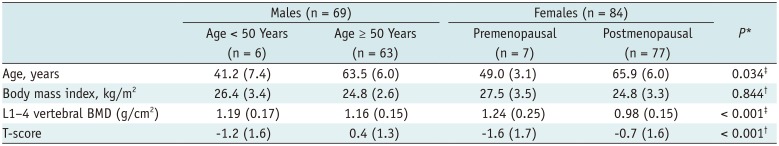
Table 1
Baseline Characteristics of Study Subjects
![]()
DXA Examination
All DXA examinations of the lumbar spine (L1-4) were performed using a Lunar Prodigy scanner (GE Medical Systems, Madison, WI, USA). The areal BMD (g/cm2) and T-scores were assessed for all enrolled patients. Normal BMD, osteopenia, and osteoporosis were defined as T-score ≥ −1.0 standard deviation (SD), −2.5 < T-score < −1.0 SD, and T-score ≤ −2.5 SD, respectively (2).
MRI Protocol
All MRI examinations were performed on a 3T MRI scanner (MAGNETOM Skyra; Siemens Healthineers, Erlangen, Germany). The mean interval between the DXA and MRI examinations was 3 days (range, 0–30 days). All images were acquired with subjects in the supine position using a standard spine array coil and an eight-channel phased array coil for the spine. Conventional MRI sequences for anatomical and morphological evaluation of the lumbar vertebrae were adopted, and the imaging parameters are summarized in Table 2.
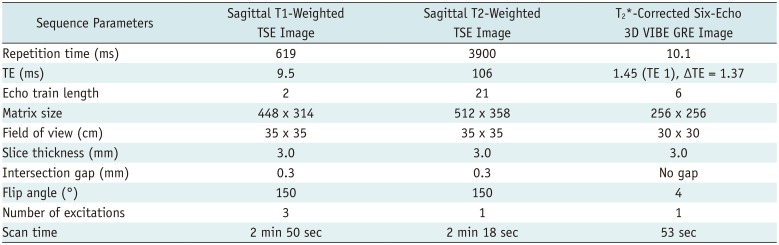
Table 2
Summary of MRI Parameters for Fat Quantification
![]()
A single-voxel high-speed T2-corrected multi-echo (HISTO) MRS sequence was performed using a stimulated echo acquisition mode with the following parameters: repetition time = 3000 ms; echo time (TE) = 12, 24, 36, 48, and 72 ms; bandwidth = 1200 Hz; flip angle = 90°; and voxel size = 15 × 15 × 15 mm3. The scan time was 45 seconds. A spectroscopic voxel was placed on the anterior aspect of the L4 vertebral body. An example of the water and fat spectral peaks at a specific TE and the automatically calculated FF from the HISTO scan are displayed in Figure 1A.
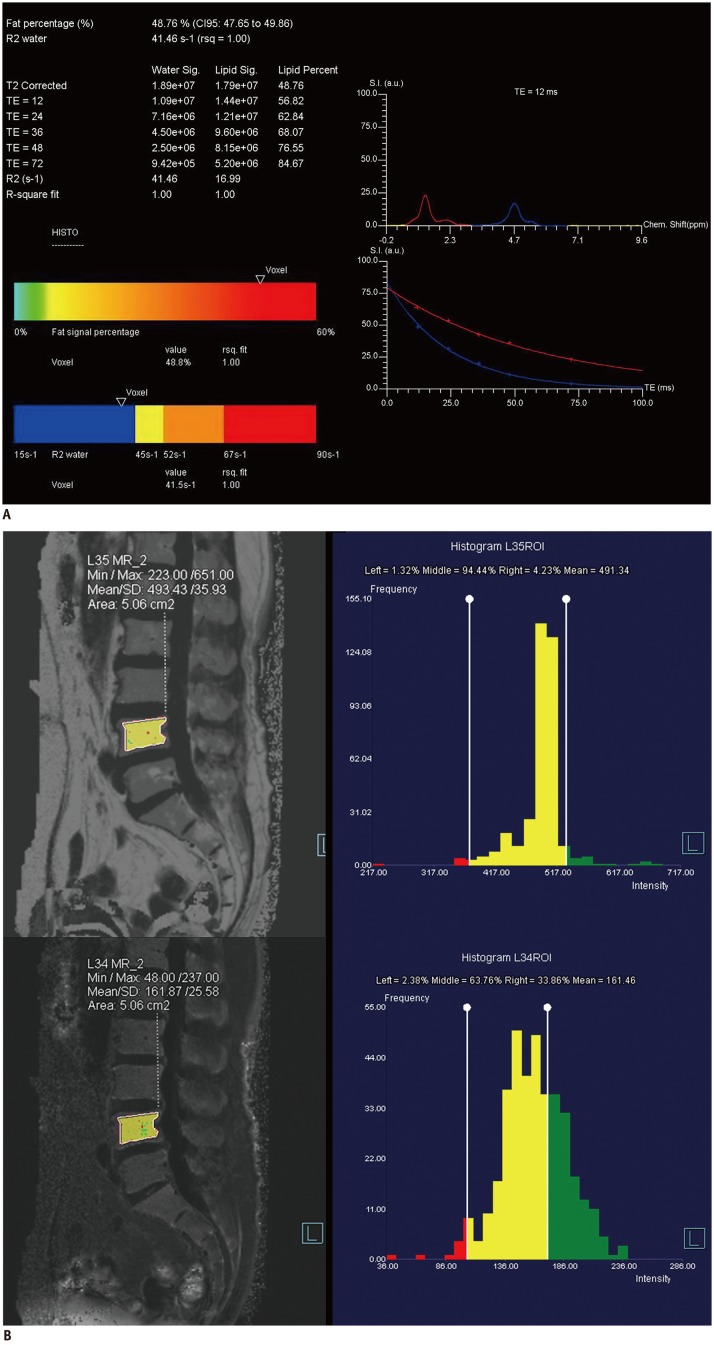 | Fig. 171-year-old female subject with lower back pain.Screen-captured images of single-voxel T2-corrected multi-echo MRS (A) and T2*-corrected 6-echo Dixon VIBE imaging (B).
A. FF of single-voxel HISTO MRS scan. Each water and fat integral at five echoes (TE = 12, 24, 36, 48, and 72 ms; top left) with estimated FF of 48.8% (bottom left). Water and fat spectral peaks at TE of 12 ms are shown. Red curve represents 1.3-ppm fat spectrum, and blue curve represents 4.7-ppm water spectrum (top right). Image on right shows T2 exponential decay curve. Chem. = chemical, CI = confidence interval, FF = fat fraction, HISTO = high-speed T2-corrected multi-echo, MRS = magnetic resonance spectroscopy, rsq = r-squared, S.I. (a.u.) = signal intensity (arbitrary units), TE = echo time, VIBE = volumetric interpolated breath-hold examination B. Measurement of FF and R2* at MR imaging workstation (Syngo software; Siemens Healthineers). Free-drawn polygonal ROIs was located at least 2 mm from endplate and excluded basivertebral plexus. ROIs were drawn on fat-only images (top left) and directly copied onto R2* map (bottom right). FF and R2* are displayed as histograms (right). FF = fat fraction, MR = magnetic resonance, MRS = magnetic resonance spectroscopy, ROI = region of interest, SD = standard deviation, VIBE = volumetric interpolated breath-hold examination
|
For water-fat separation and FF estimation, T2*-corrected 6-echo Dixon VIBE imaging was performed. The imaging parameters are summarized in Table 2. We used a small flip angle to minimize the T1 bias. Images were obtained at the L4 vertebral body in the sagittal plane. For the calculation of the FF map, multi-peak fat spectral modeling was used for more precise T2* correction. The FF and R2* maps were automatically generated from the T2*-corrected 6-echo Dixon VIBE imaging series.
Data Analysis
Two experienced musculoskeletal radiologists who were blinded to the DXA results and MRS-based FF information performed all measurements independently and estimated the FF and R2*. These parameters were calculated from automatically reconstructed FF and R2* maps loaded onto an imaging workstation (Syngo software version B17; Siemens Healthineers, Forchheim, Germany). Regions of interest (ROIs) were manually drawn on the L4 vertebral body in mid-sagittal view using a fat-only image. These ROIs were directly copied onto the FF and R2* maps. The ROIs were located at least 2 mm from the endplate, and the basivertebral plexus and focal fat deposition were excluded (Fig. 1B). ROI size varied according to the area of the spine. The mean ROI sizes were 424 ± 82 mm2 for reader 1 and 420 ± 50 mm2 for reader 2.
Statistical Analysis
All continuous variables were assessed for normality using the Shapiro-Wilk test and are presented as mean ± SD. We used the independent t test or Mann-Whitney U test to assess differences between men and women.
The interobserver agreement between the FF and R2* measurements was analyzed using the intraclass correlation coefficient (ICC) with a two-way random effects model of absolute agreement. The interobserver agreement was interpreted as follows: < 0.50, poor; 0.50–0.75, moderate; 0.75–0.90, good; and > 0.90, excellent (23).
To assess the consistency between the FF values obtained via T2*-corrected 6-echo Dixon VIBE imaging and MRS, Lin's concordance correlation coefficient (pc) and Bland-Altman plot with a 95% confidence interval (CI) were used. The pc was classified as follows: > 0.99, almost perfect; 0.95–0.99, substantial; 0.90–0.95, moderate; and < 0.90, poor (24). Pearson's correlation analysis was performed to analyze the correlation between the FF and BMD in all patients and each subgroup as well as the correlation between R2* and BMD. Pearson's correlation coefficient (r) was interpreted as follows: r = ± 1.0, perfect; ± 0.60–0.80, strong; ± 0.40–0.60, moderate; ± 0.20–0.40, weak; and 0, no correlation (25). The scatterplots are shown in Figures 2 and 3. To determine the diagnostic performance of the parameters for predicting osteopenia and osteoporosis, receiver operating characteristic (ROC) curves were constructed, and the areas under the curve (AUCs) were calculated by each reader. Using ROC curves, we compared a logistic regression model combining the FF and R2* with those including the FF or R2* alone. The AUCs were compared using the DeLong test and interpreted as follows: 0.90–1.0, excellent; 0.80–0.90, good; 0.70–0.80, fair; 0.60–0.70, poor; and 0.50–0.60, failed (26). A p value < 0.05 was considered statistically significant. All statistical analyses were performed using SPSS 22.0 (IBM Corp., Armonk, NY, USA) and MedCalc version 17.9.7 (MedCalc Software, Ostend, Belgium).
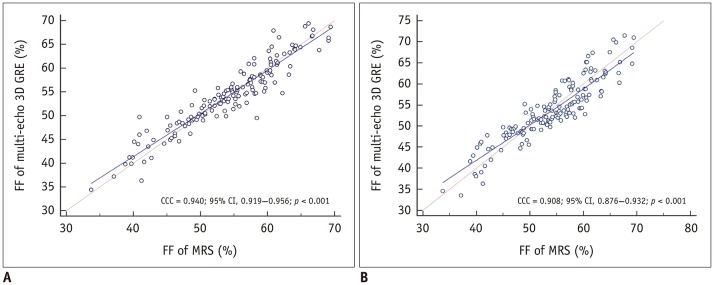 | Fig. 2Comparison between FF values measured with T2*-corrected 6-echo Dixon VIBE imaging and MRS at L4 vertebra.pc for assessment of agreement between FF values measured via MRS and T2*-corrected 6-echo Dixon VIBE imaging (reader 1, A; reader 2, B). Correlation between spectroscopic and T2*-corrected 6-echo Dixon VIBE-based FF values was statistically significant for readers 1 and 2 (both p < 0.001). pc values for readers 1 and 2 were 0.940 and 0.908, respectively. CCC = concordance correlation coefficient, GRE = gradient echo, 3D = three-dimensional
|
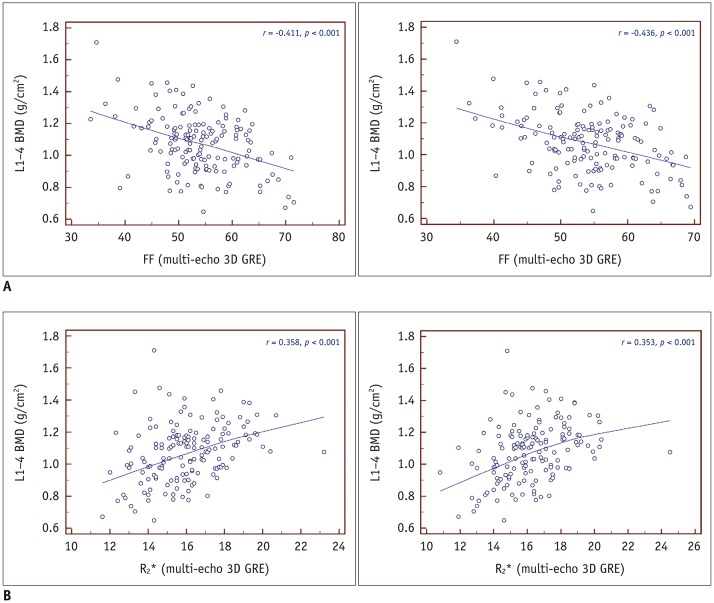 | Fig. 3Correlations between BMD and FF or R2*.
A. Scatterplot displaying correlation between FF obtained via T2*-corrected 6-echo Dixon VIBE imaging and areal BMD (g/cm2; reader 1, A-left; reader 2, A-right). Moderate negative correlation between FF and areal BMD was found (r = −0.411 [reader 1], −0.436 [reader 2]; both p < 0.001). B. Scatterplot displaying correlation between R2* and areal BMD (g/cm2; reader 1, B-left; reader 2, B-right). Weak positive correlation between R2* and areal BMD was found (r = 0.358 [reader 1], 0.353 [reader 2]; both p <0.001). BMD = bone mineral density
|
Go to :
RESULTS
Interobserver Agreement
The interobserver agreement between the two radiologists for the FF and R2* measurements was excellent. The ICC values for the FF and R2* were 0.955 (95% CI, 0.938–0.967) and 0.953 (95% CI, 0.936–0.966), respectively.
Consistency between the FF Values Obtained Via T2*-Corrected 6-Echo Dixon VIBE Imaging and MRS
Lin's pc showed a moderate correlation between the FF values obtained via T2*-corrected 6-echo Dixon VIBE imaging and MRS for readers 1 and 2 (pc = 0.940 [reader 1], 0.908 [reader 2]; both p < 0.001) (Fig. 2). Figure 4 shows the mean measurement bias with limits of agreement for the FF derived from T2*-corrected 6-echo Dixon VIBE imaging relative to the FF measured with MRS. The mean measurement biases were −0.3% (95% limits of agreement, −6.4–5.8%) for reader 1% and 0.1% (95% limits of agreement, −4.8–5.0%) for reader 2.
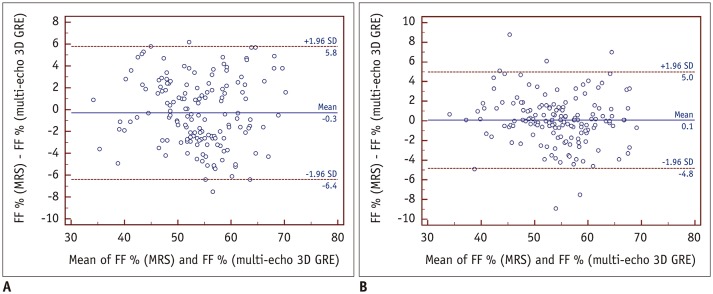 | Fig. 4Bland-Altman plots showing mean measurement bias with limits of agreement for FF derived from T2*-corrected 6-echo Dixon VIBE imaging relative to that measured with MRS.Mean measurement bias for reader 1 (A) was −0.3% (range, −6.4–5.8%), and mean measurement bias for reader 2 (B) was 0.1% (range, −4.8–5.0%). Mean bias is shown as solid line, and limits of agreement are shown as dashed lines.
|
Correlations between BMD and the FF or R2*
A moderate negative correlation was observed between the FF and areal BMD (g/cm2) for both readers (r = −0.411 [reader 1], −0.436 [reader 2]; both p < 0.001) (Fig. 3A). There was no significant difference in the degree of correlation between men and women, and the most negative correlation was observed in younger men for both readers (r = −0.831 [reader 1], −0.801 [reader 2]; p = 0.041, 0.056) (Table 3).
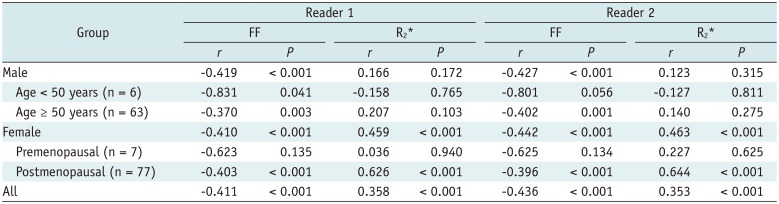
Table 3
Correlations between BMD versus or R2* in Each Group
![]()
A weak positive correlation was found between the R2* and areal BMD values (g/cm2) (Fig. 3B). The R2* and areal BMD values showed a significantly higher correlation in women than in men (r = 0.166 vs. 0.459 [reader 1]; r = 0.123 vs. 0.463 [reader 2]; p =0.048 [reader 1], 0.023 [reader 2]). For both readers, the highest correlation was found in postmenopausal women (Table 3).
Diagnostic Performance of the FF and R2* for Predicting Osteopenia and Osteoporosis
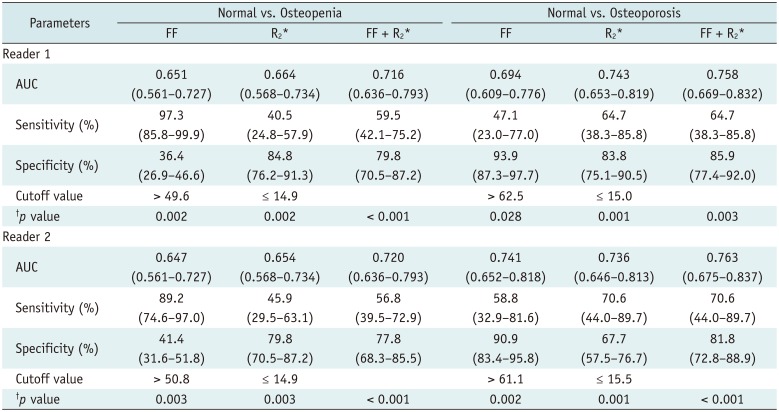
The AUCs for the FF and R2* for the prediction of osteopenic subjects were 0.651 and 0.664, respectively, for reader 1 and 0.647 and 0.654, respectively, for reader 2. Furthermore, the AUCs for normal and osteoporotic subject differentiation were 0.694 and 0.743, respectively, for reader 1 and 0.741 and 0.736, respectively, for reader 2. We found no significant differences in the diagnostic performance of the FF and R2* for predicting osteopenia and osteoporosis. The ROC analysis showed that the combination of the FF and R2* resulted in a higher AUC than that for the FF or R2*alone for predicting osteopenia and osteoporosis. The AUCosteopenia and AUCosteoporosis were 0.716 and 0.758, respectively, for reader 1, and 0.720, and 0.763, respectively, for reader 2 (Table 4, Fig. 5).
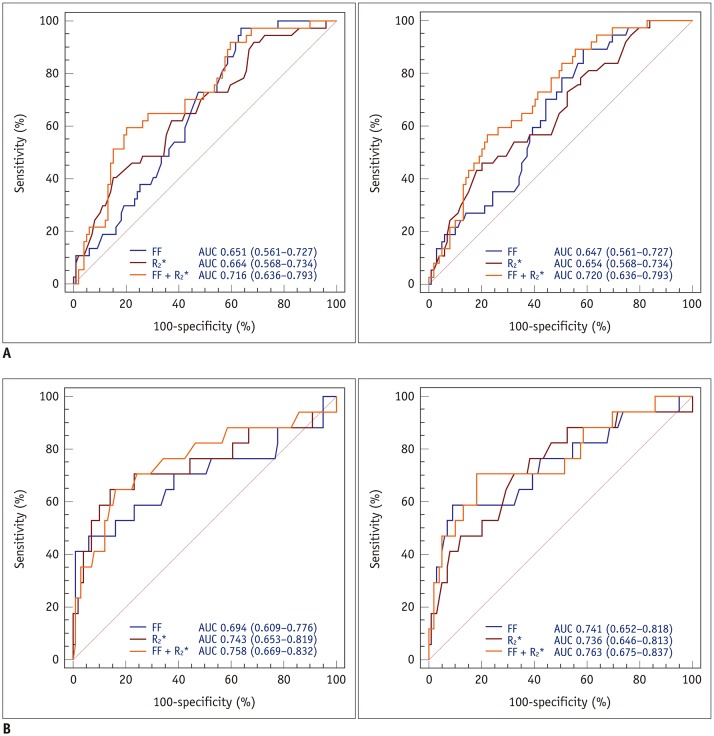 | Fig. 5Graphs showing ROC curves of readers 1 and 2 for predicting osteopenia (reader 1, A-left; reader 2, A-right) and osteoporosis (reader 1, B-left; reader 2, B-right) using FF, R2*, or combination of FF and R2*.ROC analysis demonstrated that combination of FF and R2* improved diagnostic performance for predicting osteopenia and osteoporosis for both readers. AUC = area under curve, ROC = receiver operating characteristic
|
Table 4
Diagnostic Performance of FF, R2*, and Combination of FF and R2* for Predicting Osteopenia and Osteoporosis
![]()
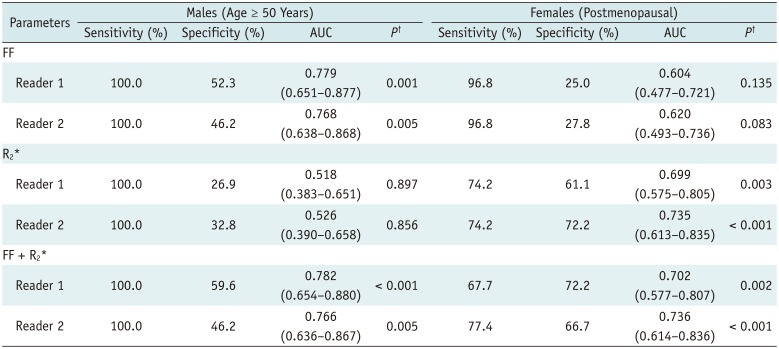
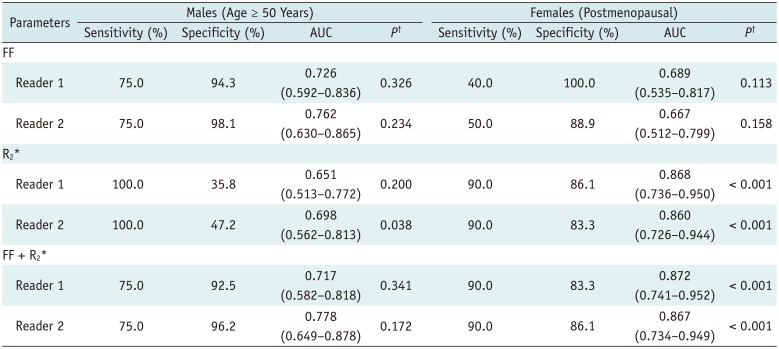
In AUC comparisons, using the FF resulted in a higher AUC than using R2* for predicting osteopenia and osteoporosis in older men; however, there were no significant differences (AUCosteopenia, p = 0.015 [reader 1], 0.198 [reader 2]; AUCosteoporosis, p = 0.620 [reader 1], 0.806 [reader 2]). In postmenopausal women, the AUCs obtained using R2* were higher than those obtained using the FF; however, significant differences were not observed (AUCosteopenia, p = 0.260 [reader 1], 0.147 [reader 2]; AUCosteoporosis, p = 0.257 [reader 1], 0.180 [reader 2]). The groups comprising younger men and premenopausal women had only one osteopenic and osteoporotic subject, which resulted in insufficient data for ROC curve analysis. In postmenopausal women, high sensitivity (90% for both readers) and excellent R2* discriminatory capacity (AUC > 0.80 for both readers, p < 0.001) between normal individuals and patients with osteoporosis were observed. The FF combined with R2* achieved a > 0.70 AUC value for predicting osteopenia and osteoporosis in older men and postmenopausal women. The AUCs for predicting osteopenia and osteoporosis in each group are summarized in Tables 5, 6 and Figures 6, 7.
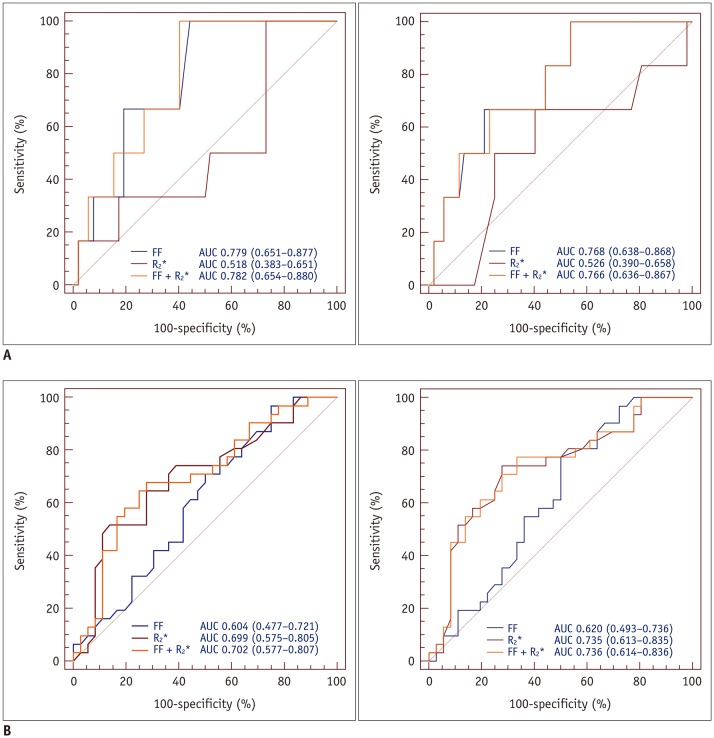 | Fig. 6ROC analysis of FF, R2*, and combination of FF and R2* for predicting osteopenia (reader 1, A-left; reader 2, A-right) and osteoporosis (reader 1, B-left; reader 2, B-right) in older men.ROC analysis demonstrated that AUCs for FF were higher than those for R2* for both readers. However, ROC curve showed only minor improvements in diagnostic performance for predicting osteopenia and osteoporosis.
|
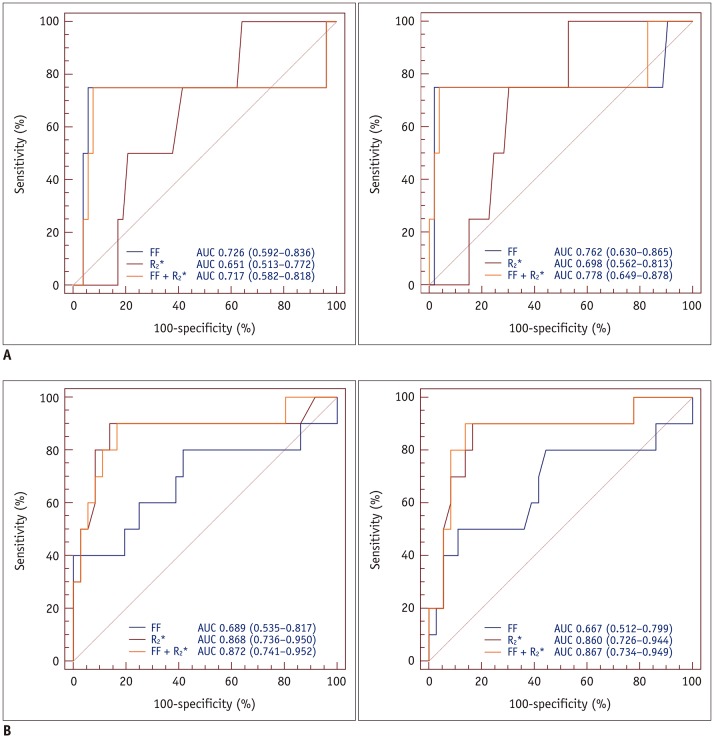 | Fig. 7ROC analysis of FF, R2*, and combination of FF and R2* for predicting osteopenia (reader 1, A-left; reader 2, A-right) and osteoporosis (reader 1, B-left; reader 2, B-right) in postmenopausal women.ROC analysis demonstrated that AUCs for R2* were excellent for both readers. However, there was no significant difference in AUCs between FF, R2*, and combination of FF and R2*.
|
Table 5
Diagnostic Performance of FF, R2*, and Combination of FF and R2* for Predicting Osteopenia in Each Group
![]()
Table 6
AUC of FF, R2*, and Combination of FF and R2* for Predicting Osteoporosis in Each Group
![]()
Go to :
DISCUSSION
Clinical interest in methods for accurately measuring vertebral marrow fat is increasing because vertebral marrow fat content is negatively correlated with BMD (810111227). Chemical shift-based water-fat separation techniques, such as iterative decomposition of water and fat with echo asymmetry and least-squares estimation and the modified Dixon technique, have a similar accuracy to MRS for fat quantification and are widely accepted as alternative techniques to MRS (1528). These techniques allow for more consistent water-fat separation by correcting for various confounding factors, such as main magnetic field inhomogeneity, multiple fat spectral peaks, and T2*, T1 relaxation, and eddy current effects (131528). The 3D T2*-corrected 6-echo Dixon VIBE technique can obtain up to 32 echoes. This technique also supports multi-peak fat modeling and can quickly produce water- or fat-only images and R2* maps using parallel acquisition and VIBE techniques (151722). Compared with two-dimensional-acquisition water-fat imaging, the 3D T2*-corrected 6-echo Dixon VIBE technique has certain advantages, including higher spatial resolution and wider coverage with a short scan time (151722). Our study used the 3D T2*-corrected 6-echo Dixon VIBE technique and simultaneously performed T1 bias and T2* corrections to more accurately quantify marrow fat.
Our results showed that T2*-corrected 6-echo Dixon VIBE imaging allows for accurate quantification of vertebral marrow fat and is comparable to MRS. We found sex-, age-, and menopause-related differences in associations between the FF, R2*, and BMD. These results indicate that various conclusions can be reached depending on which group is included. We also investigated whether these parameters can be used as biomarkers for predicting osteopenia and osteoporosis. The combination of the FF and R2* showed fair to excellent diagnostic performance for the detection of osteopenia and osteoporosis. However, compared with the FF or R2* alone, the combination of the FF and R2* showed only a minor or no improvement in performance. This finding might be due to differences in individual bone marrow composition and various microenvironmental conditions related to medical history or physical activity. Although the difference did not reach significance, it showed optimal specificity and sensitivity in postmenopausal women.
Our data indicate a moderate inverse correlation between the FF and BMD in all of the patients, consistent with the results of previous studies (272829). However, we found that the correlation was weaker in older men and postmenopausal women. Physiological changes related to aging or menopause might be considered potential causes of the relatively weak correlation between the FF and BMD in these subgroups. For example, red marrow reconversion can increase with age due to the increased risk of cancer, infection, trauma, or other stress that occurs with aging. Moreover, the prevalence of Modic changes increases with age (3031). Modic type 1 and 2 changes are uncommon in patients before 50 years of age, but they increase after the age of 50 years with type 2 changes being more common. Modic type 1 and 2 changes are most frequently encountered at L4-5 and L5-S1, and L4-5 is the most common site of such changes (3031). The mean ages of the older men and postmenopausal women were significantly higher than those of the other groups combined. Additionally, relative estrogen deficiency accelerates vertebral endplate and disc degeneration. In fact, severe lumbar disc degeneration tends to be more common in postmenopausal women than in elderly men (32). Recent studies have demonstrated that Modic type 2 change is primarily associated with severe disc degeneration (3334). Compared with Modic type 2 changes, which are associated with fatty degeneration, Modic type 1 changes are associated with increased vascularity and marrow edema (3031). However, Modic type 1 changes have been associated with higher FF values than those in normal marrow. We drew ROIs at least 2 mm from the endplate to exclude the cortical bone. Moreover, focal fat deposits were excluded. However, Modic changes were observed in both sides of the endplates as well as in large confluent areas of the vertebral body (30). The various degrees of Modic changes included in the ROIs are assumed to affect the vertebral marrow composition.
MRS is currently used as the non-invasive gold standard for the clinical assessment of vertebral marrow fat content (5678910). MRS presents no risk of exposure to ionizing radiation and adequately reflected marrow fat as demonstrated by a histopathological study (35). However, MRS has certain limitations, such as the inability to cover an entire vertebral marrow segment with a single voxel and certain technical challenges (141628). Moreover, performing fat measurements is impracticable because MRS requires the creation of a more homogeneous B0 field with shimming. In contrast to previous studies (1636), for the FF measurements, we attempted to draw ROIs including as much bone marrow as possible, while excluding the vertebral endplate and cortical bone. We confirmed excellent consistency between T2*-corrected 6-echo Dixon VIBE imaging and MRS measurements. Therefore, T2*-corrected 6-echo Dixon VIBE imaging is expected to enable accurate quantification of vertebral marrow fat in a short scan time as well as provide both quantitative and spatially-resolved information on vertebral marrow fat. Although our study only measured a single vertebra, the T2*-corrected 6-echo Dixon VIBE technique can collect data for multiple vertebral levels in one acquisition.
T2*-corrected 6-echo Dixon VIBE imaging has the additional advantage of simultaneously obtaining the R2* value with fat quantification (21). Previous studies showed that multi-peak modeling of fat signals yielded better accuracy than single-peak fat modeling, which induced an underestimation of the fat signals (2021). We also performed multi-peak fat modeling. We found a positive correlation between the R2* and areal BMD values, which is consistent with the results of a previous study, and both studies used R2* with multi-peak fat correction (22). The R2* map is a byproduct of T2*-corrected fat quantification and equivalent to 1/T2* (2021). In patients with osteoporosis, T2* decay is assumed to be delayed because of trabecular bone loss, which will decrease R2* (22). We found that there was a significant difference between men and women in the relationship of R2* with areal BMD. It is well known that quantitatively measured serum ferritin is a reliable indicator of bone marrow iron stores (37). A recent study showed a significant correlation between serum ferritin and BMD in women ≥ 45 years of age (38). This finding may be explained by the rapid loss of estrogen in these women. In agreement with that study, the highest correlation coefficient between R2* and BMD was observed in postmenopausal women in the present study.
In a previous study, the question of whether the FF or R2* alone could be used as a marker to assess osteoporosis was raised (22). Moreover, the FF and R2* are not reliable for osteopenia assessment. We found that the FF and R2*showed poor to fair performance in all subjects. Additionally, ROC curve analysis showed that the AUC of the combination of the FF and R2* was higher than those of the FF or R2* alone. We focused on differences in diagnostic performance between the FF and R2* according to sex and menopause status. The AUC of R2* was higher than that of the FF in postmenopausal women and showed good discriminatory performance in predicting osteoporosis. The FF showed good performance in older men, but poor performance in postmenopausal women. The combination of the FF and R2* showed good performance (AUC > 0.7) in older men and postmenopausal women; however, it only showed minor or no improvement in performance compared with the FF and R2* alone. Vertebral marrow fat increases sharply in postmenopausal women (39), and this disproportionate increase in marrow fat consequently contributes to the loss of trabecular bone (40). A possible explanation for our finding may be that the loss of trabecular bone eventually led to a reduction in R2*, which led to better diagnostic performance.
Our study has certain limitations. First, the sample sizes of the younger men and premenopausal women were smaller than those of the other two subgroups. Second, the MRS data were used as the reference standards for fat content quantification. True marrow fat content can only be assessed via bone biopsy; however, this was practically impossible. Third, we only used DXA to assess bone mineralization, even though bone strength is determined by various factors, including bone mass and microarchitecture; however, DXA only reflects bone mass (41). Fourth, all subjects were patients who reported low back pain. Thus, the possibility of bias cannot be ruled out. Fifth, we did not compare the diagnostic efficacy between the uncorrected FF and T2*-corrected FF. Finally, patients with severe osteophytes or degenerative changes were excluded because of the possibility of distorted BMD results, which potentially limits the applicability of the study outcomes to normal vertebrae.
In summary, T2*-corrected 6-echo Dixon VIBE imaging is feasible and can be used as an alternative technique for estimating the vertebral marrow FF. In addition, the R2* value can be obtained as a byproduct of T2* correction. The FF and R2* values obtained using T2*-corrected 6-echo Dixon VIBE imaging could potentially serve as predictors of osteopenia and osteoporosis. R2* might be useful for predicting osteoporosis, especially in postmenopausal women.
Go to :
 XML Download