

 PDF
PDF ePub
ePub Citation
 Print
Print


INTRODUCTION
Ultrasound (US) elastography is a non-invasive tool used in chronic liver disease for staging liver fibrosis or predicting portal hypertension. Among several US elastography techniques, two-dimensional shear wave elastography (2D-SWE) is the latest method using an acoustic radiation force impulse (ARFI) to cause liver-tissue deformation and eventually generate a shear wave. It provides a 2D quantitative map of liver stiffness values over a large region of interest (ROI) by placing the ARFI focus at multiple sequential locations and capturing the generated shear waves. Because 2D-SWE involves real-time imaging, both the depth and size of sampling areas can be chosen manually at desired locations with no mass, large vessels, or artifacts. 2D-SWE has been integrated into most clinical US systems with the same probes as that used in traditional US (1).
Owing to its advantages, 2D-SWE helps assess the stability of measuring and quantifying an average stiffness value in a large ROI for higher reliability (2). However, because of its relative novelty, 2D-SWE has not yet been validated and some aspects remain incompletely clarified (3). Validating a diagnostic device for clinical use involves two main processes: 1) diagnostic accuracy—the evidentiary process of linking a biomarker with clinical endpoints and biologic processes and 2) technical performance—assessment of technical success/failure and measurement variability (4).
Thus far, most clinical validation attempts have focused on the good diagnostic accuracy of 2D-SWE for the degree of liver fibrosis (1256). Nevertheless, its technical performance also needs assessment. Although 2D-SWE systems from different manufacturers have custom built-in indicators for better measurement quality and stability, the evidence supporting them are limited (7). Indeed, previous studies evaluating the technical performance of 2D-SWE were generally small-scale studies with low-level evidence (891011121314151617181920212223242526272829303132333435363738394041). To increase the level of evidence and arrive at more evidence-based results, sufficient evidence should be accumulated and summarized.
Therefore, we conducted this systematic review and meta-analysis to evaluate the technical performance of 2D-SWE for measuring liver stiffness.
MATERIALS AND METHODS
Institutional Review Board approval was not required because of the nature of our study, which was a systemic review and meta-analysis. Our systematic review and meta-analysis followed the Preferred Reporting Items for Systematic Reviews and Meta-Analyses guidelines (42).
Literature Search Strategy
We conducted an electronic literature search to identify suitable studies from the Ovid-MEDLINE (U.S. National Library of Medicine) and EMBASE (Elsevier) databases until June 30, 2018 (Supplementary Materials in the online-only Data Supplement).
Eligibility Criteria and Study Selection
We tried to evaluate the technical performance of 2D-SWE for measuring liver stiffness. Thus, we included studies and study subsets that evaluated any of the following outcomes by using 2D-SWE for measuring liver stiffness: 1) technical failure; 2) unreliable measurements; 3) interobserver reliability; and 4) intraobserver reliability.
Technical failure was the inability to obtain an adequate signal for all acquisitions, which was adopted in all studies consistently. As unreliable measurements were randomly defined across studies without consensus, we used the slightly different definitions of unreliable results employed in each of the included studies. Regarding measurement reliability, we included studies comparing the stiffness between different observers (interobserver reliability) and between different sessions by the same observer (intraobserver reliability).
The exclusion criteria were as follows: 1) studies reporting insufficient data for outcomes (i.e., an ambiguous definition of technical failure); 2) studies including pediatric populations; 3) studies using other elastography modalities (i.e., transient elastography [TE] or point shear-wave elastography); 4) partially overlapping patient cohorts; 5) case reports or series including less than 10 patients; and 6) reviews, guidelines, consensus statements, editorials, letters, comments, or conference abstracts.
Literature search and study selection were performed by one reviewer and double checked by other two reviewers.
Data Extraction
Data pertaining to the following parameters were extracted using a standardized form: 1) study characteristics: authors, institution, duration of patient recruitment, year of publication, and study design (prospective vs. retrospective); 2) patient characteristics: number of patients, male-to-female ratio, mean age, age range, and etiology; 3) technical characteristics of 2D-SWE: device, manufacturer, transducer, measurement number, representative value (mean or median), and number of observers; and 4) study outcomes: proportion of technical failure, proportion of unreliable measurements, and intraclass correlation coefficient (ICC) for interobserver and intraobserver reliability, if any. Additionally, possible factors influencing technical failure or unreliable measurements in each eligible study were evaluated.
The data extraction was performed by two reviewers independently. Any disagreements were resolved with a 3rd reviewer. There was no major controversial issue.
Quality Assessment
The methodological quality of the selected studies was assessed by one reviewers using tailored questionnaires and criteria provided by the Quality Assessment of Diagnostic Accuracy Studies-2 (QUADAS-2) (43).
Data Synthesis and Analysis
This meta-analysis assessed four main indices: 1) pooled proportion of technical failure; 2) pooled proportion of unreliable measurements; 3) pooled ICC for interobserver reliability; and 4) pooled ICC for intraobserver reliability. If the indices were obtained by two or more observers, especially for the evaluation of intraobserver reliability, representative data (i.e., mean values of all observers' outcomes) were chosen for analysis. Otherwise, data from the observer with the highest value were used.
The pooled proportions of technical failure and unreliable measurements were calculated using meta-analytic pooling via the inverse variance method for calculating weights (444546). Random-effects meta-analysis of single proportions was used to obtain an overall proportion. Logit transformation of proportion was performed. The Clopper-Pearson interval for individual studies was used to obtain the confidence intervals (CIs), and a continuity correction of 0.5 was performed in studies with zero cell frequencies. Heterogeneity among studies was determined using 1) Cochran's Q-test for summary estimates with p < 0.05 indicating heterogeneity and 2) the Higgins inconsistency index (I2), which indicates the percentage of variance in a meta-analysis (a rough guide to interpretation: 0–40%, heterogeneity might not be important; 30–60%, moderate heterogeneity may be present; 50–90% substantial heterogeneity may be present; and 75–100%, considerable heterogeneity may be present) (4748). Publication bias was assessed using funnel plots visually and Egger's test with p < 0.10 indicating significant bias (49). Publicationbias-adjusted pooled estimate was also calculated using the trim-and-fill method (50). A sensitivity analysis was conducted using a leave-one-out analysis to identify outliers and evaluate the influence of a single study. Moreover, subgroup analyses were performed on the following covariates: 1) measurement numbers (≤ 3 vs. > 3) (7); 2) manufacturer; and 3) etiology (chronic liver disease vs. liver cirrhosis). Specifically, from some of the eligible studies that included both healthy and diseased cohorts (25293638), we extracted more detailed outcomes of patients with chronic liver disease or liver cirrhosis. Thus, for subgroup analyses on different etiologies (chronic liver disease vs. liver cirrhosis), we also included these subgroup data.
To calculate the pooled ICC for interobserver and intraobserver reliability, we used the Hedges-Olkin method with Fisher's Z transformation of the correlation coefficient (51). With this method, the ICC was converted to Z transforms; thereafter, a mean transformed correlation weighted by sample size was calculated. Once a 95% CI was obtained for the pooled Z score, it was transformed back to a 95% CI for the pooled ICC with both fixed- and random-effects models. The value of ICC can be interpreted as follows: < 0.50, poor; 0.50–0.74, moderate; 0.75–0.89, good; and 0.90–1.00, excellent reliability (52). Heterogeneity and publication bias were also assessed in a similar manner to the pooled proportion of technical failure and unreliable measurement.
All statistical analyses were performed by two reviewers (with 2 and 6 years of experience, respectively, in performing systematic reviews and meta-analyses) using the “metafor” and “meta” packages in R software version 3.5.1 (R Foundation for Statistical Computing).
RESULTS
Literature Search and Quality Assessment
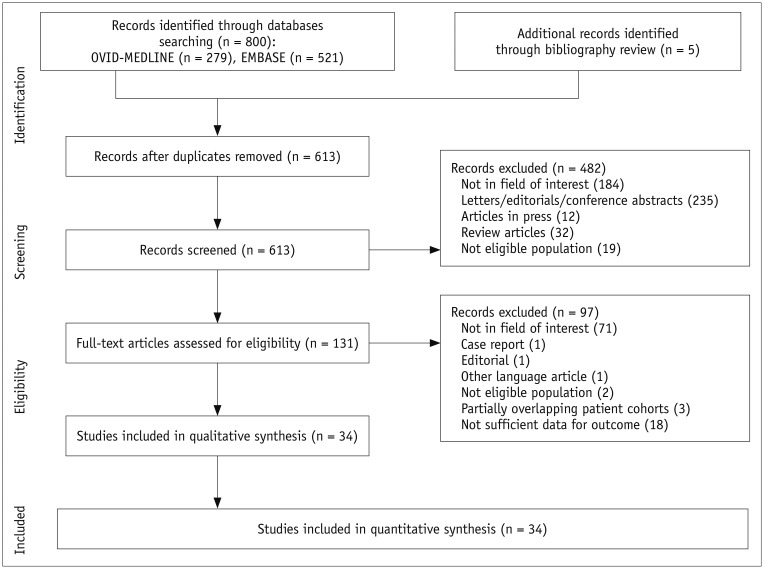
Figure 1 illustrates the flow of literature screening and selection. Finally, 34 articles were included in our systematic review and meta-analysis (891011121314151617181920212223242526272829303132333435363738394041). All studies satisfied more than half the tailored questionnaires of QUADAS-2 tool (Supplementary Materials in the online-only Data Supplement).
Characteristics of the Included Studies
The detailed characteristics of the included studies are summarized in Tables 1 and 2. Twenty-eight of the 34 studies were prospective (891011121314151718192021222324262728293133343637394041) and four were retrospective (16303238). The mean ages of subjects in the included studies ranged from 27 to 60 years old. The study populations ranged from healthy cohorts to patients with chronic liver disease/liver cirrhosis from various causes.
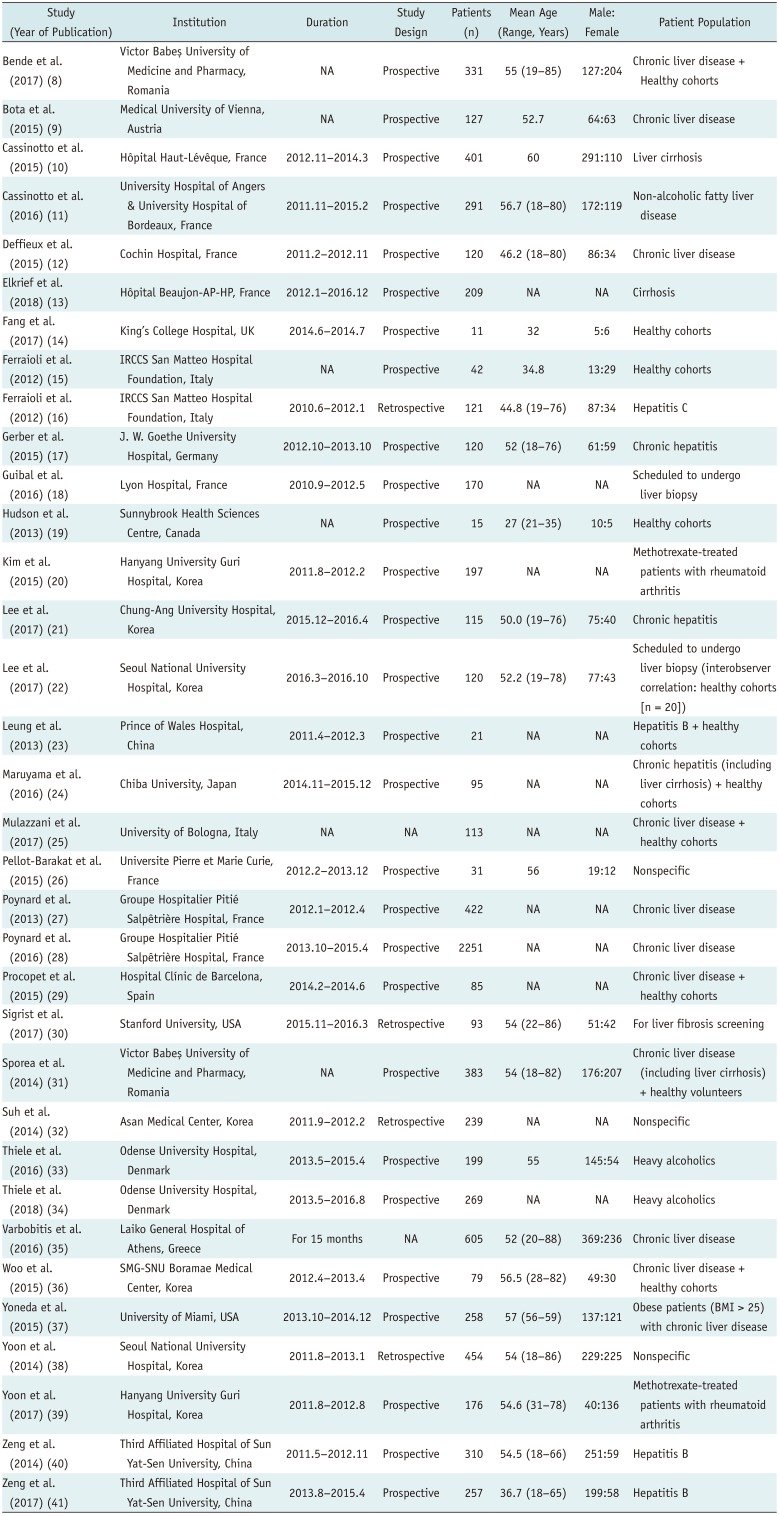
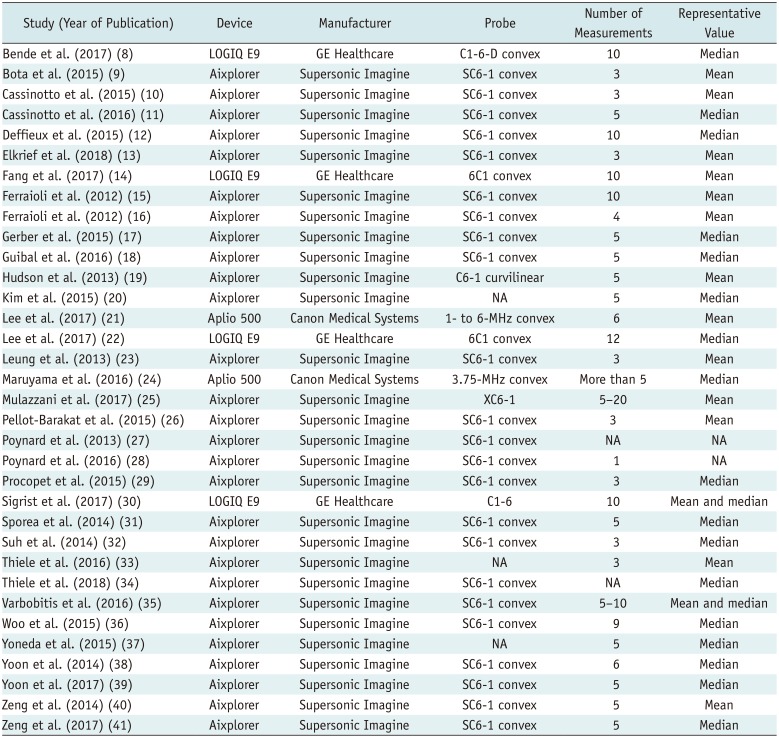
Table 1
Demographic Characteristics of Included Studies
| Study (Year of Publication) | Institution | Duration | Study Design | Patients (n) | Mean Age (Range, Years) | Male: Female | Patient Population |
|---|---|---|---|---|---|---|---|
| Bende et al. (2017) (8) | Victor Babes¸ University of Medicine and Pharmacy, Romania | NA | Prospective | 331 | 55 (19–85) | 127:204 | Chronic liver disease + Healthy cohorts |
| Bota et al. (2015) (9) | Medical University of Vienna, Austria | NA | Prospective | 127 | 52.7 | 64:63 | Chronic liver disease |
| Cassinotto et al. (2015) (10) | Hôpital Haut-Lévêque, France | 2012.11–2014.3 | Prospective | 401 | 60 | 291:110 | Liver cirrhosis |
| Cassinotto et al. (2016) (11) | University Hospital of Angers & University Hospital of Bordeaux, France | 2011.11–2015.2 | Prospective | 291 | 56.7 (18–80) | 172:119 | Non-alcoholic fatty liver disease |
| Deffieux et al. (2015) (12) | Cochin Hospital, France | 2011.2–2012.11 | Prospective | 120 | 46.2 (18–80) | 86:34 | Chronic liver disease |
| Elkrief et al. (2018) (13) | Hôpital Beaujon-AP-HP, France | 2012.1–2016.12 | Prospective | 209 | NA | NA | Cirrhosis |
| Fang et al. (2017) (14) | King's College Hospital, UK | 2014.6–2014.7 | Prospective | 11 | 32 | 5:6 | Healthy cohorts |
| Ferraioli et al. (2012) (15) | IRCCS San Matteo Hospital Foundation, Italy | NA | Prospective | 42 | 34.8 | 13:29 | Healthy cohorts |
| Ferraioli et al. (2012) (16) | IRCCS San Matteo Hospital Foundation, Italy | 2010.6–2012.1 | Retrospective | 121 | 44.8 (19–76) | 87:34 | Hepatitis C |
| Gerber et al. (2015) (17) | J. W. Goethe University Hospital, Germany | 2012.10–2013.10 | Prospective | 120 | 52 (18–76) | 61:59 | Chronic hepatitis |
| Guibal et al. (2016) (18) | Lyon Hospital, France | 2010.9–2012.5 | Prospective | 170 | NA | NA | Scheduled to undergo liver biopsy |
| Hudson et al. (2013) (19) | Sunnybrook Health Sciences Centre, Canada | NA | Prospective | 15 | 27 (21–35) | 10:5 | Healthy cohorts |
| Kim et al. (2015) (20) | Hanyang University Guri Hospital, Korea | 2011.8–2012.2 | Prospective | 197 | NA | NA | Methotrexate-treated patients with rheumatoid arthritis |
| Lee et al. (2017) (21) | Chung-Ang University Hospital, Korea | 2015.12–2016.4 | Prospective | 115 | 50.0 (19–76) | 75:40 | Chronic hepatitis |
| Lee et al. (2017) (22) | Seoul National University Hospital, Korea | 2016.3–2016.10 | Prospective | 120 | 52.2 (19–78) | 77:43 | Scheduled to undergo liver biopsy (interobserver correlation: healthy cohorts [n = 20]) |
| Leung et al. (2013) (23) | Prince of Wales Hospital, China | 2011.4–2012.3 | Prospective | 21 | NA | NA | Hepatitis B + healthy cohorts |
| Maruyama et al. (2016) (24) | Chiba University, Japan | 2014.11–2015.12 | Prospective | 95 | NA | NA | Chronic hepatitis (including liver cirrhosis) + healthy cohorts |
| Mulazzani et al. (2017) (25) | University of Bologna, Italy | NA | NA | 113 | NA | NA | Chronic liver disease + healthy cohorts |
| Pellot-Barakat et al. (2015) (26) | Universite Pierre et Marie Curie, France | 2012.2–2013.12 | Prospective | 31 | 56 | 19:12 | Nonspecific |
| Poynard et al. (2013) (27) | Groupe Hospitalier Pitié Salpêtrière Hospital, France | 2012.1–2012.4 | Prospective | 422 | NA | NA | Chronic liver disease |
| Poynard et al. (2016) (28) | Groupe Hospitalier Pitié Salpêtrière Hospital, France | 2013.10–2015.4 | Prospective | 2251 | NA | NA | Chronic liver disease |
| Procopet et al. (2015) (29) | Hospital Clínic de Barcelona, Spain | 2014.2–2014.6 | Prospective | 85 | NA | NA | Chronic liver disease + healthy cohorts |
| Sigrist et al. (2017) (30) | Stanford University, USA | 2015.11–2016.3 | Retrospective | 93 | 54 (22–86) | 51:42 | For liver fibrosis screening |
| Sporea et al. (2014) (31) | Victor Babes¸ University of Medicine and Pharmacy, Romania | NA | Prospective | 383 | 54 (18–82) | 176:207 | Chronic liver disease (including liver cirrhosis) + healthy volunteers |
| Suh et al. (2014) (32) | Asan Medical Center, Korea | 2011.9–2012.2 | Retrospective | 239 | NA | NA | Nonspecific |
| Thiele et al. (2016) (33) | Odense University Hospital, Denmark | 2013.5–2015.4 | Prospective | 199 | 55 | 145:54 | Heavy alcoholics |
| Thiele et al. (2018) (34) | Odense University Hospital, Denmark | 2013.5–2016.8 | Prospective | 269 | NA | NA | Heavy alcoholics |
| Varbobitis et al. (2016) (35) | Laiko General Hospital of Athens, Greece | For 15 months | NA | 605 | 52 (20–88) | 369:236 | Chronic liver disease |
| Woo et al. (2015) (36) | SMG-SNU Boramae Medical Center, Korea | 2012.4–2013.4 | Prospective | 79 | 56.5 (28–82) | 49:30 | Chronic liver disease + healthy cohorts |
| Yoneda et al. (2015) (37) | University of Miami, USA | 2013.10–2014.12 | Prospective | 258 | 57 (56–59) | 137:121 | Obese patients (BMI > 25) with chronic liver disease |
| Yoon et al. (2014) (38) | Seoul National University Hospital, Korea | 2011.8–2013.1 | Retrospective | 454 | 54 (18–86) | 229:225 | Nonspecific |
| Yoon et al. (2017) (39) | Hanyang University Guri Hospital, Korea | 2011.8–2012.8 | Prospective | 176 | 54.6 (31–78) | 40:136 | Methotrexate-treated patients with rheumatoid arthritis |
| Zeng et al. (2014) (40) | Third Affiliated Hospital of Sun Yat-Sen University, China | 2011.5–2012.11 | Prospective | 310 | 54.5 (18–66) | 251:59 | Hepatitis B |
| Zeng et al. (2017) (41) | Third Affiliated Hospital of Sun Yat-Sen University, China | 2013.8–2015.4 | Prospective | 257 | 36.7 (18–65) | 199:58 | Hepatitis B |
![]()
Table 2
Technical Characteristics of Included Studies
| Study (Year of Publication) | Device | Manufacturer | Probe | Number of Measurements | Representative Value |
|---|---|---|---|---|---|
| Bende et al. (2017) (8) | LOGIQ E9 | GE Healthcare | C1-6-D convex | 10 | Median |
| Bota et al. (2015) (9) | Aixplorer | Supersonic Imagine | SC6-1 convex | 3 | Mean |
| Cassinotto et al. (2015) (10) | Aixplorer | Supersonic Imagine | SC6-1 convex | 3 | Mean |
| Cassinotto et al. (2016) (11) | Aixplorer | Supersonic Imagine | SC6-1 convex | 5 | Median |
| Deffieux et al. (2015) (12) | Aixplorer | Supersonic Imagine | SC6-1 convex | 10 | Median |
| Elkrief et al. (2018) (13) | Aixplorer | Supersonic Imagine | SC6-1 convex | 3 | Mean |
| Fang et al. (2017) (14) | LOGIQ E9 | GE Healthcare | 6C1 convex | 10 | Mean |
| Ferraioli et al. (2012) (15) | Aixplorer | Supersonic Imagine | SC6-1 convex | 10 | Mean |
| Ferraioli et al. (2012) (16) | Aixplorer | Supersonic Imagine | SC6-1 convex | 4 | Mean |
| Gerber et al. (2015) (17) | Aixplorer | Supersonic Imagine | SC6-1 convex | 5 | Median |
| Guibal et al. (2016) (18) | Aixplorer | Supersonic Imagine | SC6-1 convex | 5 | Median |
| Hudson et al. (2013) (19) | Aixplorer | Supersonic Imagine | C6-1 curvilinear | 5 | Mean |
| Kim et al. (2015) (20) | Aixplorer | Supersonic Imagine | NA | 5 | Median |
| Lee et al. (2017) (21) | Aplio 500 | Canon Medical Systems | 1- to 6-MHz convex | 6 | Mean |
| Lee et al. (2017) (22) | LOGIQ E9 | GE Healthcare | 6C1 convex | 12 | Median |
| Leung et al. (2013) (23) | Aixplorer | Supersonic Imagine | SC6-1 convex | 3 | Mean |
| Maruyama et al. (2016) (24) | Aplio 500 | Canon Medical Systems | 3.75-MHz convex | More than 5 | Median |
| Mulazzani et al. (2017) (25) | Aixplorer | Supersonic Imagine | XC6-1 | 5–20 | Mean |
| Pellot-Barakat et al. (2015) (26) | Aixplorer | Supersonic Imagine | SC6-1 convex | 3 | Mean |
| Poynard et al. (2013) (27) | Aixplorer | Supersonic Imagine | SC6-1 convex | NA | NA |
| Poynard et al. (2016) (28) | Aixplorer | Supersonic Imagine | SC6-1 convex | 1 | NA |
| Procopet et al. (2015) (29) | Aixplorer | Supersonic Imagine | SC6-1 convex | 3 | Median |
| Sigrist et al. (2017) (30) | LOGIQ E9 | GE Healthcare | C1-6 | 10 | Mean and median |
| Sporea et al. (2014) (31) | Aixplorer | Supersonic Imagine | SC6-1 convex | 5 | Median |
| Suh et al. (2014) (32) | Aixplorer | Supersonic Imagine | SC6-1 convex | 3 | Median |
| Thiele et al. (2016) (33) | Aixplorer | Supersonic Imagine | NA | 3 | Mean |
| Thiele et al. (2018) (34) | Aixplorer | Supersonic Imagine | SC6-1 convex | NA | Median |
| Varbobitis et al. (2016) (35) | Aixplorer | Supersonic Imagine | SC6-1 convex | 5–10 | Mean and median |
| Woo et al. (2015) (36) | Aixplorer | Supersonic Imagine | SC6-1 convex | 9 | Median |
| Yoneda et al. (2015) (37) | Aixplorer | Supersonic Imagine | NA | 5 | Median |
| Yoon et al. (2014) (38) | Aixplorer | Supersonic Imagine | SC6-1 convex | 6 | Median |
| Yoon et al. (2017) (39) | Aixplorer | Supersonic Imagine | SC6-1 convex | 5 | Median |
| Zeng et al. (2014) (40) | Aixplorer | Supersonic Imagine | SC6-1 convex | 5 | Mean |
| Zeng et al. (2017) (41) | Aixplorer | Supersonic Imagine | SC6-1 convex | 5 | Median |
![]()
The US device used in 28 studies was Aixplorer (Supersonic Imagine, Strasbourg, France) (9101112131516171819202325262728293132333435363738394041). Either LOGIQ E9 (GE Healthcare, Chicago, IL, USA) (8142230) or Aplio 500 (Canon Medical Systems, Otawara, Japan) (2124) was used in the remaining 6 studies.
Regarding the methods of liver-stiffness measurements, 23 studies performed more than three measurements (810121415161718192021222425303135363738394041), whereas 9 studies performed three (911132326293233) or less (28) measurements. Thirteen studies used “mean” as a representative value of liver stiffness (9101314151619212325263340), 17 studies used “median” (811121718202224293132343637383941), and 2 studies used both values (3035).
Technical Failure
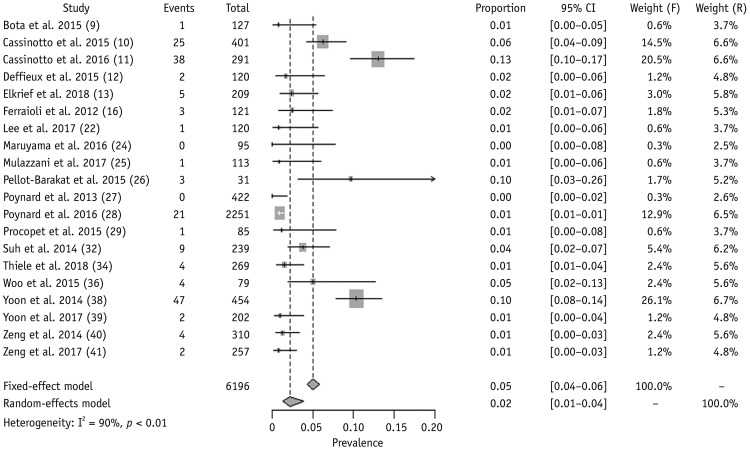
We obtained the proportion of technical failure of 2D-SWE in 20 studies including 6196 patients (910111213162224252627282932343638394041). Under the random-effects model, the pooled proportion of technical failure was 2.3% (95% CI, 1.3–3.9%) (Fig. 2). Significant heterogeneity was noted in Cochran's Q-test (p < 0.01) and Higgins I2 (90%). The funnel plot (Supplementary Fig. 1A in the online-only Data Supplement) and Egger's test (p < 0.01) revealed substantial publication bias. After using the trim-and-fill method (Supplementary Fig. 1B in the online-only Data Supplement), the publication-bias-adjusted pooled estimate was 2.8% (95% CI, 1.7–4.7%), suggesting the robustness of the result against any publication bias. No outlier was found in the sensitivity analysis.
The results of subgroup analyses for the proportion of technical failure are summarized in Table 3. No significant difference in technical failure proportion was observed between the studies with three or less measurements and those with more than three measurements. Ten studies originally targeted patients with chronic liver disease (9101112131627284041). Additionally, we could extract separate data on patients with chronic liver disease from 4 studies (25293638). Therefore, we could recalculate the pooled proportion of technical failure in patients with chronic liver disease from 14 studies (2.4%; 95% CI, 1.2–4.8%) (910111213162527282936384041). Likewise, we recalculated the pooled proportion in patients with liver cirrhosis from 3 studies (6.8%; 95% CI, 2.5–17.0%) (101338).
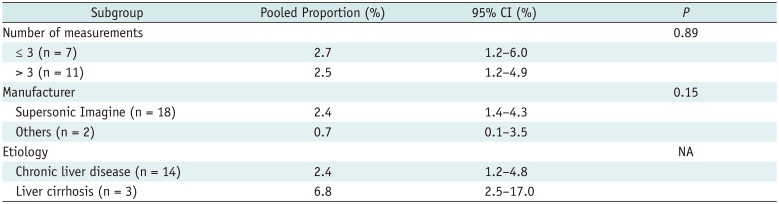
Table 3
Subgroup Analyses for Technical Failure
![]()
Unreliable Measurements
From 20 studies including 6961 patients (89111317182021222427282931333537384041), the pooled proportion of unreliable measurement was 7.5% (95% CI, 4.7–11.7%) (Fig. 3). The definition of unreliable measurements varied across the studies (Table 4). Significant heterogeneity was found in Cochran's Q-test (p < 0.01) and Higgins I2 (96%). The funnel plot and Egger's test revealed no significant publication bias (p = 0.19) (Supplementary Fig. 2 in the online-only Data Supplement). One study was an outlier in the sensitivity analysis (13), but the summary proportion was still robust (6.8%; 95% CI, 5.0–9.3%) after removing it.
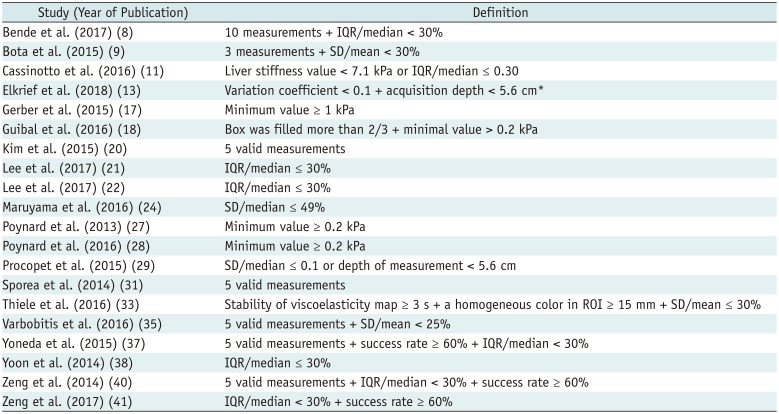
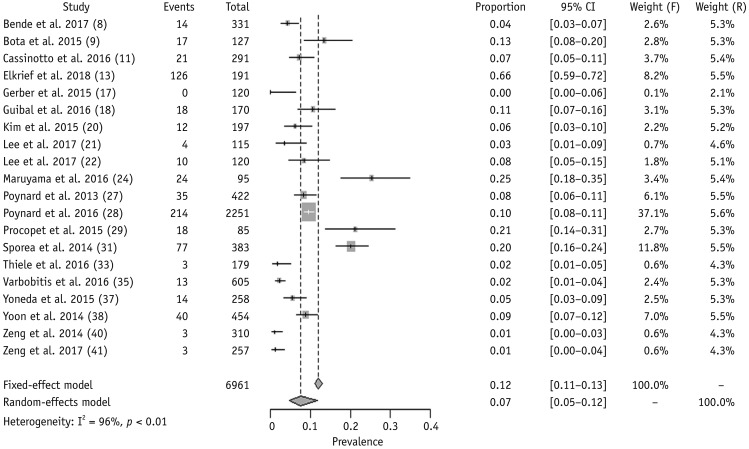
Table 4
Definition of Reliable Measurements in Eligible Studies
| Study (Year of Publication) | Definition |
|---|---|
| Bende et al. (2017) (8) | 10 measurements + IQR/median < 30% |
| Bota et al. (2015) (9) | 3 measurements + SD/mean < 30% |
| Cassinotto et al. (2016) (11) | Liver stiffness value < 7.1 kPa or IQR/median ≤ 0.30 |
| Elkrief et al. (2018) (13) | Variation coefficient < 0.1 + acquisition depth < 5.6 cm* |
| Gerber et al. (2015) (17) | Minimum value ≥ 1 kPa |
| Guibal et al. (2016) (18) | Box was filled more than 2/3 + minimal value > 0.2 kPa |
| Kim et al. (2015) (20) | 5 valid measurements |
| Lee et al. (2017) (21) | IQR/median ≤ 30% |
| Lee et al. (2017) (22) | IQR/median ≤ 30% |
| Maruyama et al. (2016) (24) | SD/median ≤ 49% |
| Poynard et al. (2013) (27) | Minimum value ≥ 0.2 kPa |
| Poynard et al. (2016) (28) | Minimum value ≥ 0.2 kPa |
| Procopet et al. (2015) (29) | SD/median ≤ 0.1 or depth of measurement < 5.6 cm |
| Sporea et al. (2014) (31) | 5 valid measurements |
| Thiele et al. (2016) (33) | Stability of viscoelasticity map ≥ 3 s + a homogeneous color in ROI ≥ 15 mm + SD/mean ≤ 30% |
| Varbobitis et al. (2016) (35) | 5 valid measurements + SD/mean < 25% |
| Yoneda et al. (2015) (37) | 5 valid measurements + success rate ≥ 60% + IQR/median < 30% |
| Yoon et al. (2014) (38) | IQR/median ≤ 30% |
| Zeng et al. (2014) (40) | 5 valid measurements + IQR/median < 30% + success rate ≥ 60% |
| Zeng et al. (2017) (41) | IQR/median < 30% + success rate ≥ 60% |
![]()
The subgroup analyses for the proportion of unreliable measurements are summarized in Table 5. Notably, studies conducting more than three measurements had fewer unreliable measurements than did those conducting three or less measurements. From 12 studies (91113172127282935384041), including 2 (2938) enabling the extraction of separate data on patients with chronic liver disease, the pooled proportion in patients with chronic liver disease was 6.3% (95% CI, 3.0–12.9%).
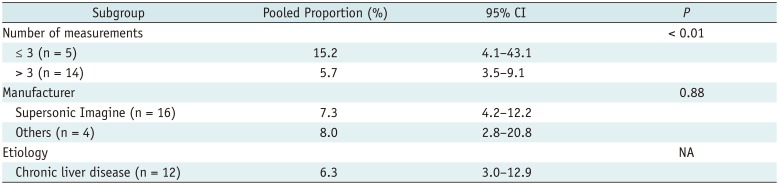
Table 5
Subgroup Analyses for Unreliable Measurements
![]()
Interobserver and Intraobserver Reliability
The interobserver reliability of 2D-SWE was obtained from 12 studies (101214151819202122233639). The study of Yoon et al. (39) was excluded because it potentially shared the population with another (20). Moreover, unlike other studies reporting the result using an ICC parameter, the study of Deffieux et al. (12) used Pearson's correlation coefficient (r = 0.87). Finally, we conducted a meta-analysis of 10 studies including 517 patients (10141518192021222336), and the pooled interobserver reliability was 0.87 (95% CI, 0.82–0.90), suggesting good reliability (Fig. 4A). Significant heterogeneity was noted in Cochran's Q-test (p = 0.01) and Higgins I2 (58%). The funnel plot (Supplementary Fig. 3A in the online-only Data Supplement) and Egger's test (p = 0.08) revealed substantial publication bias, but a publication-bias-adjusted pooled estimate suggested good reliability (ICC = 0.77; 95% CI, 0.74–0.79) under the trim-and-fill method (Supplementary Fig. 3B in the online-only Data Supplement). One outlier was present in the sensitivity analysis (20), and the pooled ICC was 0.88 (95% CI, 0.84–0.90) after removing it, thus suggesting the result was robustness.

We obtained the intraobserver reliability of 2D-SWE from 7 studies including 679 patients (10141519223638). The pooled intraobserver reliability was 0.93 (95% CI, 0.89–0.95) using a random-effects model, suggesting excellent reliability (Fig. 4B). Significant heterogeneity was noted (Cochran's Q-test: p < 0.01; Higgins I2 = 80%). The pooled reliability was still robust (0.95; 95% CI, 0.94–0.96) after removing one outlier (36). We could not calculate the publication bias for intraobserver reliability because of the small sample size (< 10 studies).
Influential Factors
Factors influencing technical performance were reported in 16 studies (8101116182022242527293335373840) (Table 6). Overall, technical failure and/or unreliable measurement was affected by patient factors, including high body mass index/wide waist circumference/thick intercostal wall suggestive of overweight or obesity, old age, inability to optimally hold breath, severe liver disease and associated complications (e.g., ascites), narrow intercostal space, and long distance between the transducer and liver capsule. Additionally, one study reported that operator experience significantly influenced the measurement reliability of 2D-SWE (28).
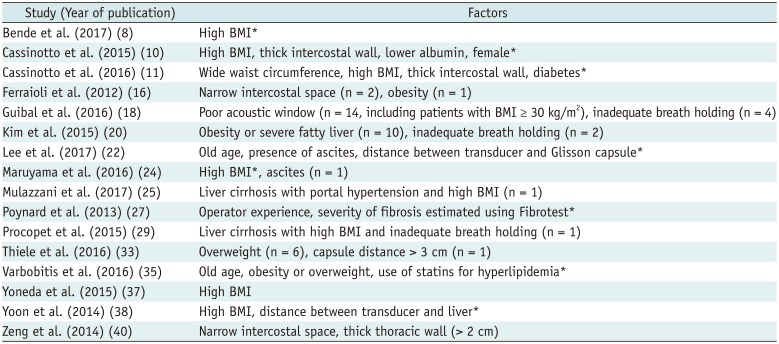
Table 6
Factors Influencing Technical Failures and/or Unreliable Measurements
| Study (Year of publication) | Factors |
|---|---|
| Bende et al. (2017) (8) | High BMI* |
| Cassinotto et al. (2015) (10) | High BMI, thick intercostal wall, lower albumin, female* |
| Cassinotto et al. (2016) (11) | Wide waist circumference, high BMI, thick intercostal wall, diabetes* |
| Ferraioli et al. (2012) (16) | Narrow intercostal space (n = 2), obesity (n = 1) |
| Guibal et al. (2016) (18) | Poor acoustic window (n = 14, including patients with BMI ≥ 30 kg/m2), inadequate breath holding (n = 4) |
| Kim et al. (2015) (20) | Obesity or severe fatty liver (n = 10), inadequate breath holding (n = 2) |
| Lee et al. (2017) (22) | Old age, presence of ascites, distance between transducer and Glisson capsule* |
| Maruyama et al. (2016) (24) | High BMI*, ascites (n = 1) |
| Mulazzani et al. (2017) (25) | Liver cirrhosis with portal hypertension and high BMI (n = 1) |
| Poynard et al. (2013) (27) | Operator experience, severity of fibrosis estimated using Fibrotest* |
| Procopet et al. (2015) (29) | Liver cirrhosis with high BMI and inadequate breath holding (n = 1) |
| Thiele et al. (2016) (33) | Overweight (n = 6), capsule distance > 3 cm (n = 1) |
| Varbobitis et al. (2016) (35) | Old age, obesity or overweight, use of statins for hyperlipidemia* |
| Yoneda et al. (2015) (37) | High BMI |
| Yoon et al. (2014) (38) | High BMI, distance between transducer and liver* |
| Zeng et al. (2014) (40) | Narrow intercostal space, thick thoracic wall (> 2 cm) |
![]()
DISCUSSION
Our meta-analysis revealed that the pooled proportions of technical failures and unreliable measurements of 2D-SWE were 2.3% and 7.5%, respectively. Moreover, the 2D-SWE measurements showed good to excellent interobserver (ICC = 0.87) and intraobserver (ICC = 0.93) reliability, suggesting the applicability of 2D-SWE for evaluating liver stiffness. Our result also revealed that the technical performance of 2D-SWE is comparable to TE, the most extensively used US elastography, reported to have failure rate of 3.1% and unreliable measurement rate of 15.8% from a study of 13379 examinations (53).
Currently, all 2D-SWE systems enable quality assessment of shear-wave measurements and adjust the display when the quality decreases by dropping the offending pixels and excluding them when calculating Young's modulus (54). Additionally, Aplio 500 shows a display of shear waves travelling, suggesting acceptable quality if consecutive lines are parallel. Other manufacturers also provide an additional vendor-specific approach to quality judgement, including confidence maps in Philips systems and the stability index in the new software version of Aixplorer (7).
However, according to the 2017 European Federation of Societies for Ultrasound in Medicine and Biology (EFSUMB) guidelines, no agreement exists on the quality criteria for 2D-SWE and unreliable measurements are randomly defined across studies (7). Naturally, the proportion of unreliable measurements were closely influenced by the definition, as shown by Elkrief et al. (13) whose proportion was substantial under the strict definition. Some authors (17182728) used minimal Young's modulus to identify invalid measurements. The Society of Radiologists in Ultrasound consensus (55) and other studies (811212237384041) recommend interquartile ranges/median values below 30% as valid measurements mimicking the TE reliability criteria. To reduce such variability and enable standardization, a collaborative effort by academia and manufacturers is required (56).
Given the significant heterogeneity in technical failure and unreliable measurements among the studies in this meta-analysis, subgroup analyses were conducted to explore potential factors influencing successful and qualified measurements. Notably, the number of measurements significantly affected the unreliable measurements; thus, multiple measurements in the same location are recommended for obtaining reliable liver-stiffness measurements (55). Because no consensus exists on the optimal measurement numbers, the included studies performed various numbers of measurements ranging from 3 to 15 (29405758). Recently, the 2017 EFSUMB guidelines recommended that three measurements suffice to obtain consistent results for assessing liver fibrosis and portal hypertension (7). However, our subgroup analyses revealed that studies conducting more than three measurements showed fewer unreliable measurements than did those conducting three measurements or less. Nevertheless, no difference was found in technical failure between the two groups. Thus, we suggest that the optimal minimum number of 2D-SWE measurements should be further verified. We believe the composition of the population also affects technical success and reliable measurements as liver disease leads to improper procedures caused by changes in liver volumes, secondary interference by an interposed colon, or other complications (38). Three studies targeting patients with cirrhosis had a higher proportion of technical failure, even though studies and study subsets targeting patients with chronic liver disease showed no difference in technical failure and unreliable measurements with the overall population.
2D-SWE helps select a ROI in a representative area of the liver, and it could be saved and followed over time. This could reduce sampling variability in repeated measurements (59). Indeed, good to excellent interobserver and intraobserver reliability in our meta-analysis supports this advantage of 2D-SWE. Conversely, 2D-SWE requires technical expertise because the operators need to consistently place the points of measurements in the liver. One study reported that intraobserver agreement between measurements on different days drops from 0.84 for experienced examiners to 0.65 for beginners (15). Therefore, measurements should be performed by experienced operators, and beginners are recommended at least 50 supervised measurements (71560).
Our study has several limitations. Despite the significant heterogeneity in the meta-analysis, we could not conduct further subgroup analyses for potential factors influencing the results and heterogeneity, especially the impact of overweight or obesity on technical performance. Second, many of the included studies used the Aixplorer system because the other manufacturers only recently released their 2D-SWE devices. However, we included all available studies and our results may be generally applied to all 2D-SWE devices. Third, significant publication bias was observed in the meta-analysis for technical failure and interobserver reliability. After using the trim-and-fill method, however, the outcomes were still robust.
In conclusion, 2D-SWE has good technical performance for assessing liver stiffness, being characterized by high technical success and reliability. Nevertheless, future studies should establish the quality criteria and optimal number of measurements.
 XML Download