

 PDF
PDF ePub
ePub Citation
 Print
Print


INTRODUCTION
Rheumatoid arthritis (RA) is a chronic autoimmune disease of the joints,1 characterized by abnormal proliferation of synovial tissue leading to destruction of periarticular bone and cartilage.2 According to statistics, approximately 30% of RA patients become permanently work disabled in the first 2–3 years due to inadequate treatment.34 Many reports have illustrated that the length of time before starting treatment affects treatment outcomes in RA.56 Hence, it is of great significance to diagnose patients with RA early in the disease. A more in-depth and accurate understanding of the pathological mechanism of RA will help with early diagnosis and treatment.
MicroRNAs (miRNAs) are non-coding single-stranded RNA molecules of approximately 22 nucleotides in length and have been indicated in the regulation of various biologic processes.789 Many abnormally expressed miRNAs have been identified in RA, although most of them have not been characterized. MiR-16,10 miR-21,11 miR-155, miR-146,912 and miR-20313 were found to be upregulated in synovial fibroblasts from RA patients. Downregulation of microRNA-34a* in RA synovial fibroblasts (RASFs) was shown to facilitate apoptosis resistance.2 In addition, the expression of miR-124 was found to be decreased in RASFs: overexpression of miR-124 in vitro decreased the expression of cyclin-dependent kinase 2 and monocyte chemoattractant protein 1.14 Meanwhile, downregulation of miR-27b has been observed in sorted CD14+ monocytes isolated from conventional disease-modifying anti-rheumatic drug (cDMARD) failure and biologic treatment resistant patients. Furthermore, IL-6 receptor isoforms were identified as direct targets of miR-27b.15 However, the biological function of miR-27b in RA remains largely unknown. Hence the present study aimed to determine the effect of miR-27b on the proliferation and apoptosis of MH7A cells stimulated by tumor necrosis factor α (TNF-α) and its possible mechanism. We discovered that upregulation of miR-27b suppressed proliferation and promoted apoptosis of TNF-α-stimulated MH7A cells, possibly through targeting IL-1α and regulating NF-κB signaling.
MATERIALS AND METHODS
Cell culture and TNF-α stimulation
The fibroblast-like synoviocyte (FLS) cell line MH7A was purchased from Jennio Biological Technology (Guangzhou, China) and cultivated in Dulbecco's Modified Eagle's Medium (DMEM; Gibco, Grand Island, NY, USA) supplemented with 10% fetal bovine serum (FBS; Gibco, Rockville, MD, USA). MH7A cells were stimulated with different concentrations of TNF-α (1, 5, or 10 ng/mL) for 24 h to simulate local inflammation.
Transfection assays
MH7A cells were transfected with miR-27b mimics and its corresponding control (NC) using Lipofectamine 3000 reagent (Invitrogen, Carlsbad, CA, USA) following the protocol provided by the manufacturer. Both miR-27b mimics and its corresponding NC were bought from RiboBio (Guangzhou, China). After transfection, cells were maintained at 37℃ for 48 h and then collected to explore the mRNA expression of miR-27b by quantitative real-time PCR (qRT-PCR). The following groups were defined: Control (ctrl), MH7A cells without any treatment; miR-27b mimics NC, MH7A cells transfected with miR-27b mimic NC; miR-27b mimics, MH7A cells transfected with miR-27b mimic; TNF-α+NC, MH7A cells treated with transfection reagent and stimulated by TNF-α; TNF-α+miR-27b mimics NC, MH7A cells transfected with miR-27b mimic NC and stimulated by TNF-α; and TNF-α+miR-27b mimics, MH7A cells transfected with miR-27b mimic and stimulated by TNF-α.
MTT assays
The proliferation of MH7A cells was evaluated by MTT assays. Cells were seeded into 96-well plates with 103 cells/well, and viability was detected at 0, 24, 48, and 72 h time points. MTT solution (20 µL) was added to each well, and plates were then incubated at 37℃ with 5% CO2 for 4 h. The plates were spun, and the supernatant was removed. Afterwards, 200 µL of DMSO was added to each well and incubated for 10 min on a shaker to dissolve the purple colored precipitates of formazan. Finally, absorbance at 490 nm was detected utilizing an ELISA plate reader. The proliferation curve was drawn using GraphPad Prism 6.0 (GraphPad Software Inc., La Jolla, CA, USA).
Flow cytometry
Cell apoptosis assay was conducted after 48 h transfection as follows. Cells were harvested and washed with pre-cooled PBS three times, followed by being re-suspended using binding buffer to a concentration of 1×10⁶/mL to 5×10⁶/mL. Next, 100 µL of cell suspension was placed into a 5-mL tube, to which 5 µL of Annexin V/FITC and 5 µL of PI were added, followed by incubating the tube in the dark for 15 min. After that, we added 400 µL of 1× Annexin V binding buffer into the tube and analyzed cell apoptosis using flow cytometry (Becton Dickinson, Franklin Lakes, NJ, USA).
qRT-PCR
Total RNA from MH7A cells was isolated utilizing TRIzol reagent (Invitrogen). We utilized the isolated RNA as a template to synthesize cDNA following the protocol of the PrimeScript RT Reagent Kit (Takara, Shiga, Japan). Next, PCR was performed with a SYBR Premix Ex Taq II (TaKaRa) kit on the ABI 7500 fast real time PCR system (Applied Biosystems, Foster City, CA, USA) to determine the mRNA expression of IL-1β. The primers of IL-1β used in PCR were: IL-1β F: 5′-CCAGC TACGAATCTCCGACC-3′, IL-1β R: 5′-GGTCGGAGATTCG TAGCTGG-3′. The expression of GAPDH was utilized for normalization.
To examine the expression of miR-27b, Mir-X™ miRNA First Strand Synthesis Kits (Takara, Ohtsu, Japan) with a special stem-loop primer for miRNAs were used for reverse transcription (miR-27b: 5′-GTCG TATCCAGTGCGTGTCGTGGAGTC GGCAATTGCACTG GATACGACTTCCGCC-3′; U6: 5′-CGCTT CACGAATTTGCGT GTCAT-3′). Afterwards, qPCR was performed to determine the expression of miR-27b using a SYBR PrimeScript™ miRNA RT-PCT Kit on a 7500 real-time PCR system. The primers were as follows: miR-27b forward: 5′-T TCACAGTGGCTA AGT-3′, miR-27b reverse: 5′- CAGTGCGT GTCGTGGAGT-3′; U6 forward: 5′-GCTTCGGCAGCACAT ATACTAAAAT-3′, U6 reverse: 5′-CGCTTCACGAATTTGCGTG TCAT-3′. The expression of U6 was considered as an internal reference. The relative expression values of IL-1β and miR-27b were all analyzed by the 2−ΔΔCt method.
Luciferase reporter constructs and luciferase assay
We predicted the targets of miR-27b on the TargetScan website (www.targetscan.org). We found that IL-1β appeared in the results as a target of miR-27b. We then conducted dual-luciferase reporter gene assay to verify this prediction. We synthesized the 3′-UTR of IL-1β containing the predicted binding sites (IL-1β-WT) and 3′-UTR of IL-1β with mutated binding sites (IL-1β-Mut). Afterwards, we sub-cloned IL-1β-WT and IL-1β-Mut into pmiR-RB-REPORTTM plasmid. Subsequently, the recombinant plasmid pmiR-IL-1β-WT or pmiR-IL-1β-Mut combined with miR-27b mimics or miR-27b mimics NC were co-transfected into MH7A cells. Total protein from MH7A cells was extracted 48 h after transfection, and then, the luciferase activity was determined using a Dual-Luciferase Reporter Assay Kit (Promega, Madison, WI, USA).
Western blot
RIPA lysis buffer (Beyotime, Jiangsu, China) was utilized to isolate total protein from MH7A cells, and the BCA method was used to test protein concentration. Western blot was performed as described previously.16 The following primary antibodies were used: BCL-2 (1:1000, 4223, CST), BAX (1:1000, 5023, CST), Active Caspase-3 (1:1000, 9664, CST), β-Actin(1:1000, 4970, CST), IL-1β (1:1000, 12703, CST), p-IκBβ (1:1000, 2859, CST), IκBβ (1:1000, 4812, CST), NF-κB p65 (1:1000, 8242, CST), and p-NF-κB p65 (1:1000, 3033, CST). The signals of the protein bands were viewed using an enhanced chemiluminescence plus detection kit (Thermo Fisher Scientific, Rockford, IL, USA). The expression of β-Actin was used as an internal reference.
Statistical analysis
The experimental data were analyzed using SPSS 22.0 (IBM Corp., Armonk, NY, USA) and GraphPad Prism 6.0 software (GraphPad Software Inc.). All the experiments were performed at least three independent times. Results are presented as a mean±standard error of measurement (SEM). Statistically significant differences between two groups were compared by Student's t test. Statistically significant differences among three or more groups were compared by one-way variance analysis followed by Dunnett's or Tukey post hoc test, as appropriate. All p values lower than 0.05 were considered statistically significant.
RESULTS
miR-27b expression decreases in TNF-α-stimulated MH7A cells
We cultured MH7A cells with or without TNF-α for 48 h and then determined the mRNA expression of miR-27b by qRT-PCR. We found that the expression of miR-27b was significantly decreased in MH7A cells treated with TNF-α at the concentrations of 5 ng/mL and 10 ng/mL, compared with the control (p<0.01) (Fig. 1A). We used cells stimulated by 10 ng/mL TNF-α for the following experiments since the expression value of miR-27b dropped the most in this group. In order to explore the role of miR-27b in FLS, we then sought to change miR-27b expression using miR-27b mimics. The results showed that miR-27b mimics increased miR-27b mRNA levels to 1.81±0.18 fold that of the miR-27b mimics NC group (Fig. 1B). In TNF-α treated MH7A cells, miR-27b mimics significantly increased miR-27b expression, compared with the TNF-α + miR-27b mimics NC group (Fig. 1C).
Upregulation of miR-27b inhibits the proliferation of TNF-α stimulated MH7A cells
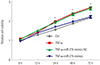
Cell proliferation tests revealed remarkably higher relative cell viability in the TNF-α group than that in the control group at 24, 48, and 72 h time points (p<0.01) (Fig. 2). Relative cell viability in the TNF-α+miR-27b mimics group was significantly lower than that in the TNF-α+miR-27b mimics NC group at 24 h, 48 h, and 72 h time points (p<0.01) (Fig. 2). These results illustrated that upregulation of miR-27b by miR-27b mimics significantly inhibits the proliferation of TNF-α stimulated MH7A cells.
Upregulation of miR-27b promotes apoptosis of TNF-α stimulated MH7A cells
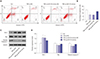
Flow cytometry analysis results showed lower percentages of apoptosis cells in the TNF-α+NC group and TNF-α+miR-27b mimics NC group than that in the control group (p<0.01) (Fig. 3A and B). Furthermore, the percentage of apoptosis cells in the TNF-α+miR-27b mimics group was dramatically increased, compared with that in the TNF-α+miR-27b mimics NC group (p<0.01) (Fig. 3A and B). We then determined changes in apoptotic-related proteins by Western blot. The protein expression levels of Bcl-2 increased significantly in the TNF-α+NC group and TNF-α+miR-27b mimics NC group, compared with the control group, whereas the levels of Bax and Caspase-3 were reduced in these two groups, compared with the control (p<0.01) (Fig. 3C and D). Moreover, the level of Bcl-2 was reduced and the expression of Bax and Caspase-3 were upregulated in TNF-α+miR-27b mimics group than those in the TNF-α+miR-27b mimics NC group (p<0.01) (Fig. 3C and D). These observations suggested that upregulation of miR-27b facilitated the apoptosis of TNF-α stimulated MH7A cells.
miR-27b directly regulates the expression of IL-1β in TNF-α stimulated MH7A cells
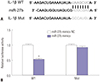
By TargetScan, we predicted that IL-1β might be a target of miR-27b, and the potential binding sites on the 3′-UTR of IL-1β are presented in Fig. 4A. Then we performed dual-luciferase reporter gene assay to confirm this relationship. The results showed that the relative luciferase activity of WT was reduced in the miR-27b mimics group, compared to that in the miR-27b mimics NC group (p<0.01) (Fig. 4B). However, for the relative luciferase activity of Mut, no significant difference was observed between the miR-27b mimics group and miR-27b mimics NC group. Afterwards, we determined the influence of miR-27b on IL-1β expression by qRT-PCR and Western blot. The outcomes showed that the expression of IL-1β was upregulated in the TNF-α+NC and TNF-α+miR-27b mimics NC groups, compared with the control group, at both the mRNA and protein level (p<0.01) (Fig. 5). Upon upregulation of miR-27b by miR-27b mimics, the mRNA and protein expression levels of IL-1β were lower than those in the TNF-α+miR-27b mimics NC group (p<0.01) (Fig. 5). These results implied that IL-1β expression is negatively regulated by miR-27b in TNF-α stimulated MH7A cells.
Upregulation of miR-27b inhibits the NF-κB signaling pathway
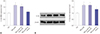
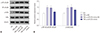
To further explore the mechanism of miR-27b-mediated FLS proliferation and apoptosis, we analyzed changes in the expression of NF-κB signaling-related proteins. The results indicated that the relative expression levels of p-NF-κB p65/NF-κB p65 and p-IκBα/IκBα were upregulated in the TNF-α+NC group and TNF-α+miR-27b mimics NC group, compared with the control group (p<0.01) (Fig. 6). Upregulation of miR-27 dramatically reduced the relative expression levels of p-NF-κB p65/NF-κB p65 and p-IκBα/IκBα, compared with the TNF-α+miR-27b mimics NC group (p<0.01) (Fig. 6). These results suggested that miR-27b possibly affected the proliferation and apoptosis of MH7A cells stimulated by TNF-α, partially by modulating NF-κB signaling.
DISCUSSION
In the present study, we aimed to investigate the effect of miR-27b on the viability and apoptosis of MH7A cells stimulated by TNF-α. We presumed that miR-27b possibly targets IL-1β and regulates NF-κB signaling to inhibit cell proliferation and to facilitate cell apoptosis.
miRNAs have been found to act as regulators in many biological processes, including cell proliferation, metabolism, differentiation, and apoptosis.17 The abnormal expression of miR-27 has been observed in various diseases. In osteoarthritis- affected chondrocytes, miR-27b expression is downregulated.1819 In breast cancer, miR-27 was markedly upregulated and correlated with poor outcomes in breast cancer patients.20 The upregulation of miR-27 has also been reported in other solid tumors, including colon, gastric, and cervical cancers.20 These phenomena suggest that miR-27 might play contradictory roles in different diseases. In neuro-blastoma cells, miR-27b showed a suppressive effect on proliferation via targeting PPARγ. Meanwhile, however, a promoting effect of miR-27 on cell proliferation has been observed in endothelial cells21 and glioma cells.22 By MTT assay, we demonstrated that the proliferation of MH7A cells is promoted by TNF-α stimulation and that upregulation of miR-27b attenuates the promotion thereof (Fig. 2). These data imply that miR-27b exerts an inhibitory role in the proliferation of TNF-α- stimulated MH7A cells. Further flow cytometry analysis indicated that upregulation of miR-27b promotes apoptosis of MH7A cells stimulated by TNF-α (Fig. 3). Collectively, we surmised that upregulation of miR-27b might attenuate MH7A inflammatory injury in RA by inhibiting cell proliferation and promoting cell apoptosis.
IL-1β, which is known to be correlated with many inflammatory pathologies, is an important proinflammatory cytokine that regulates NF-κB.23 NF-κB signaling takes vital part in most inflammatory responses and immune responses, and regulates many genes involved in cell growth. Abnormal activation of this pathway has been found to be associated with chronic inflammation, autoimmunity, and many types of tumors.2425 Our present experiments confirmed that IL-1β is a target of miR-27b (Fig. 4) and that its expression is negatively regulated by miR-27b (Fig. 5). Then, we explored changes in NF-κB signaling caused by miR-27b upregulation. From our present Western blot analysis, we observed that activation of the NF-κB signaling pathway is inhibited after upregulation of miR-27b, prompting the involvement of this pathway in miR-27b regulated MH7A cell proliferation and apoptosis. Moreover, our data suggested that miR-27 might inhibit NF-κB signaling partially by targeting IL-1β. Zhou, et al.19 previously reported that miR-27 suppresses the NF-κB signaling pathway in osteoarthritic chondrocytes by targeting leptin. More research is needed to understand the intricate regulatory mechanisms of miR-27 in NF-κB signaling.
In summary, our results demonstrated that overexpression of miR-27b inhibits the proliferation of TNF-α-stimulated FLSs by targeting IL-1β and suppressing NF-κB signaling. The present results lay a foundation for a deeper understanding of the mechanism of RA and provide a new candidate biomarker for RA therapy.

 XML Download