

 PDF
PDF Citation
 Print
Print


INTRODUCTION
Many commercial depth of anesthesia (DOA) monitors have been developed since the bispectral index (BIS) monitor was released in 1997.1 Although the performance of electroencephalogram (EEG)-derived DOA monitors is known to be limited, these devices are often recommended to help reduce the risk of intraoperative awareness.2
Many DOA monitors are based on analysis of the power of distinct EEG frequency components.1 The most widely validated DOA monitor, BIS, conducts an additional bispectral analysis that relies on the correlation of the phase between different frequency components from single channel EEG.3 Many studies have demonstrated that BIS allows titration of hypnotic agents and improves anesthetic delivery, as well as postoperative recovery.34 However, a few recent studies have suggested that altered consciousness during anesthesia is the consequence of reduced communication between brain regions,567 therefore, DOA monitors that reflect functional connectivity of different brain regions may be more appropriate.8
Phase Lag Entropy (PLE) monitoring (PLEM100; InBody Co., Ltd, Seoul, Korea) has recently been certified for clinical use in Korea. PLE is a 4-channel EEG monitoring device that uses a unique PLE algorithm. As a new measure, PLE reflects the complexity of communication by calculating the diverse connectivity of temporal patterns of the phase relationships between 2 EEG signals from prefrontal and frontal montages.6 It provides a measure of level of consciousness expressed as the PLE score, which ranges from 0 (burst suppression or deeply sedated) to 100 (awake), similar to the BIS scale. The recommended PLE score for general anesthesia is also the same as BIS: 40–60.
DOA indices based on processed EEG may produce misleading values in the presence of pathophysiological EEG patterns (e.g., beta or delta arousal, epileptiform pattern and electromyographic [EMG] activity) or externally-generated artifacts (e.g., improper electrode contact, electrocautery, and surgical device).910 Nerve monitoring devices used during certain types of operations to detect nerve injury generate large electrical signals that may also interfere with EEG-based monitors, producing inaccurate values. Case reports have been published describing interruption of BIS monitoring during facial nerve monitoring and electrocautery.1112 As the PLE algorithm differs from that of BIS, PLE may be interrupted less than BIS during nerve integrity monitoring (NIM). BIS considers the power spectrum from single channel EEG, high frequency signals that may be generated by electric stimulation for NIM can be reflected in calculation of BIS value. However, PLE obtains phase relationship between EEG signals from frontal and prefrontal channels and electric noise can be removed by phase relationship during calculation of entropy.
In the present study, we hypothesized that the performance of PLE could be better than BIS for assessing DOA during target-controlled propofol and remifentanil infusion. The primary objective of this study was to compare PLE and BIS values as anesthetic depth indicator and predictive power of PLE and BIS for the loss of consciousness (LOC) or the recovery of consciousness (ROC). The second objective was to analyze whether the PLE could be a more reliable indicator than BIS for adequate level of anesthesia during NIM in patients undergoing thyroid surgery and to check the difference of PLE and BIS values during the whole anesthetic period.
METHODS
Patients
Thirty-five patients scheduled for elective thyroid surgery with intraoperative NIM from July 2018 to October 2018 were enrolled in this prospective study. All patients were between 20 and 80 years of age and had an American Society of Anesthesiologists physical status of I–III. Patients were excluded if they were receiving medications affecting the central nervous system or if they had cerebrovascular disease, uncontrolled cardiovascular or pulmonary disease, a psychiatric disorder, or a previous allergic reaction to any of the planned anesthetic medications.
Study protocol
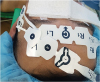
All patients were premedicated with intramuscular glycopyrrolate 0.2 mg 30 minutes before induction of anesthesia. Basic monitoring, including electrocardiography, noninvasive blood pressure measurements, and pulse oximetry, was begun upon arrival in the operating room. BIS VISTA™ version 3.0 (Aspect Medical System, Inc., Norwood, MA, USA) and PLE (PLEM100) electrodes were placed on the left temporal-frontal area of the forehead simultaneously (Fig. 1), after which preoxygenation was initiated.
Fig. 1
Placement of BIS and PLE electrodes. BIS electrodes are located on the upper forehead (lower area of the photograph) and correspond to the 10–20 International System bipolar montages of Fz (Fpz or Afz: lead 1) to F7 (F9 or FT9: lead 3) and F3 (AF3: lead 2) to F7. Lead 4 is the ground electrode. PLE electrodes are located on the lower forehead (upper area of the photograph): Fp1 (L1), AF5 (L2), Fp2 (R1), AF6 (R2), and ground (C).
BIS = bispectral index, PLE = phase lag entropy.
Propofol and remifentanil were administered via a target-controlled infusion (TCI) system using a TCI device (Orchestra Base Primea®, Fresenius Kabi, Bad Homburg vor der Höhe, Germany). After recording of the initial PLE and BIS values, propofol was begun to achieve a target effect site concentration (Ce) of 2 µg/mL and the propofol Ce increased sequentially at a rate of 1 μg/mL when the Ce and plasma concentration of propofol was equal according to the modified Marsh model. BIS and PLE values were recorded when the calculated Ce reached 2.0, 3.0, 4.0 and 5.0 μg/mL. The time point of LOC and the PLE and BIS values at LOC were also recorded. LOC was defined as loss of response to verbal stimuli and loss of eyelash reflex. After propofol Ce reached 5 μg/mL, remifentanil infusion was begun at a target Ce 4.0 ng/mL according to the Minto model, and rocuronium 0.6 mg/kg was administered. After 90 seconds, the trachea was intubated with an electromyograph endotracheal tube (EMG ETT); (Medtronic ENT; Medtronic, Jacksonville, FL, USA), and controlled ventilation was initiated with a tidal volume 6–8 mL/kg, inspiratory/expiratory ratio 1:2, inspired oxygen concentration of 0.5 and respiratory rate titrated to maintain end-tidal CO2 of 35–40 mmHg. Propofol Ce and remifentanil Ce were titrated to maintain BIS values within the target range of 40–60 and the mean arterial pressure within 20% of baseline throughout surgery.
NIM was conducted using NIM-Response® Nerve Integrity Monitoring System (Medtronic) at 1.0 mA during the operation. The EMG stimulating probe was applied at 4 time points for NIM, and we noted PLE and BIS values at the time points: after exposure of platysma muscle, after exposure of the thyroid, after exposure of the recurrent laryngeal nerve, and before closure of the subcutaneous tissue.
Fentanyl 0.5 µg/kg was administered 15 minutes before the end of surgery for postoperative analgesia. Propofol and remifentanil infusion were discontinued at the conclusion of skin suturing. During emergence from anesthesia, the ROC was defined as the time point when the patient responded with eye opening to verbal stimuli. PLE, BIS and propofol Ce were recorded at the time point of endotracheal extubation, the time point when patient responded to simple commands, and the time point when the patient was fully oriented. After full recovery of orientation, the patient was discharged to the postanesthetic care unit. All monitored parameters and raw waveform were recorded electronically using vital sign recorder software (VitalDB, https://vitaldb.net)13 from the time of monitor application to the time of full recovery of orientation. All values were saved as Excel (Microsoft Corporation, Redmond, WA, USA) files at 4-second intervals. Abnormally increased BIS or PLE values > 70 or the skipped record due to poor signal quality during NIM were checked.
PLE analysis
The EEG for PLE was continuously recorded at frontal (AF3, AF4) and prefrontal (FP1, FP2) montages with a preamplifier bandwidth of 0.5 to 45 Hz and sampling frequency (fs) of 128 Hz. The PLE between 2 EEG signals from frontal and prefrontal montages (AF3-FP1, AF3-FP2, AF4-FP1, AF4-FP2) was calculated, as proposed by Lee et al.6 Direct current offset was performed by subtracting the average amplitude of every 4-second epoch data. Eye blink and high amplitude (> 75 μV) artifacts were removed from the EEG signals.14 The temporal phase differences between 2 EEG signals (Δt, t = 1, 2, …, N) in the pre-processed data were binarized, with N being the number of data points sampled from 4- or 8-second epoch data.
The vector, Φt, representing the temporal pattern of the phase relationship between 2 EEG signals was determined by this formula: Φt = {Δt, Δt+τ, …, Δt+(m−1)τ}, t = 1, 2, …, N−(m−1)τ, in which τ represents the time lag with a resolution of 1/fs and m is the number of dimensions for extracting the temporal pattern of the phase relationship. If the first signal is phase leading the second signal, the temporal phase difference is positive, and Δt = 1. When first signal is phase lagging the second signal, the temporal difference becomes negative, and Δt = 0. For example, with an m = 3, 2m patterns of Φt can be generated: {0, 0, 0}, {0, 0, 1}, {0, 1, 0}, {1, 0, 0}, {0, 1, 1}, {1, 0, 1}, {1, 1, 0}, and {1, 1, 1}. PLE was calculated by applying the standard Shannon entropy formula to the distribution of the phase patterns as follows:

Pj is the probability of the jth pattern in a given epoch and is calculated using this equation:

PLE is comprised of 3 sub-parameters: PLE1 (m = 3), PLE2 (m = 5), and burst-suppression ratio (BSR). PLE1 and PLE2 are calculated in alpha (8–13 Hz) and beta (13–30 Hz) bands for 4-second epoch data without overlap, and slow frequency (0.1–1 Hz) and gamma (30–45 Hz) bands for 8-second epoch data with 50% overlap, respectively, as described in equation 1 and 2. PLE1 reflects a light hypnotic state, whereas PLE2 represents a surgical hypnotic state. BSR includes 2 types of burst-suppression detection (portions of isoelectric EEG and/or very low power frequency) for 60 seconds. The final PLE is calculated by combining PLE1, PLE2, and BSR with appropriate weights and linearly scaling to generate a range extending from 0 (no EEG activity) to 100 (awake). EMG activity is calculated using extracted signals > 45 Hz.
BIS analysis
The BIS value is a dimensionless number between 100 (awake) and 0 (no EEG activity). The BIS monitor consists of 4 electrodes placed on the forehead, corresponding to the bipolar montage F3-F7 and Fz-F7 in the 10–20 International System.3 The BIS value is computed from a proprietary combination of several sub-parameters (beta ratio [βR], BSR, QUAZI suppression, and synchronization fast-slow [SynchFS]) from the EEG time and frequency domains. BSR is computed as the fraction of epoch length in which the EEG was suppressed (|EEG| < 5 µV) for more than 0.5 seconds. QUAZI suppression index is calculated to detect burst suppression when baseline voltage is wandering. It includes information about slow wave form < 1.0 Hz to detect burst activity overlapped in slow waves. βR is calculated using this equation:

SynchFS is computed as follows15:
BIS values are calculated using these sub-parameters in a multivariate model based on a prospectively collected database of EEG matched to corresponding states of hypnosis and hypnotic drug levels.3 The BIS smoothing rate was set at 15 seconds.
Statistical analysis
For sample size calculation, we referred to a previous study16 comparing two DOA monitors and power analysis based on the difference in prediction probability (PK) while anesthesia induction was performed. We considered that the difference of PK in PLE and BIS less than 0.05 would not be of clinical importance and the effect size was computed as 0.45. To detect a difference of PK during anesthesia induction between PLE and BIS in a paired study design with a significance level of 5% (α = 0.05) and a power of 80%, at least 32 patients had to be included. Allowing for a drop-out rate 10%, a total of 35 patients were required.
Continuous variables were analyzed with Student's t-test or paired t-test. The relationship between PLE and BIS values during induction and emergence was analyzed by determining the correlation coefficient (r). The PK17 was calculated to assess the ability of PLE or BIS to predict propofol Ce during the induction and emergence. A PK value of 0.5 indicates that the parameter has no better than a 50:50 chance of correctly predicting an event, whereas a PK value of 1.0 indicates that the parameter correctly predicts an event 100% of the time. To analyze the estimated bias and paired-index agreement between PLE and BIS during anesthesia, we compared PLE and BIS using the Bland-Altman plot of (BIS+PLE)/2 for BIS−PLE, with estimated bias and standard deviation (SD). The 95% limits of agreement are expressed as estimated bias ± 1.96 × SD.18 We selected the paired-point indexes during anesthesia from preanesthetic state (awake) to full recovery of orientation.
All statistical analyses were performed using SPSS version 24.0 (SPSS Inc., Chicago, IL, USA) for Windows (Microsoft Corporation, Redmond, WA, USA). P values < 0.05 were considered statistically significant.
Ethics statement
The study protocol was approved by the Institutional Review Board (IRB) of Hallym University Sacred Heart Hospital (IRB approval No. 2017-I078) and was registered on the Clinical Research Information Service of the Korea National Institute of Health (CRIS, http://cris.nih.go.kr, identification number: KCT0003490). Written informed consent for participation and publication of this study was obtained from all of the patients prior to any study-related procedures.
RESULTS
Patient characteristics
A total of 35 subjects were initially enrolled in the study; one subject was excluded because of malfunction of the NIM device. Therefore, 34 subjects completed the study according to protocol. There were 15 men and 19 women, with a mean (± SD) age, weight, height, and body mass index of 50.1 ± 11.1 years, 70.6 ± 14.5 kg, 164.8 ± 8.5 cm and 25.9 ± 3.9 kg/m2, respectively. The types of operations were hemithyroidectomy (n = 16), lobectomy (n = 4), and total thyroidectomy (n = 14). The mean duration of anesthesia was 184 ± 55 minutes.
DOA measurements during anesthetic induction and start of operation
As propofol Ce increased from 0, 2, 3, 4, to 5 μg/mL, median (minimum-maximum) PLE values gradually decreased from 95 (90–100) to 86 (69–95), 78 (52–89), 70 (34–88) and 40 (34–88). Likewise, BIS values gradually decreased from 97 (93–98) to 86 (75–94), 81 (53–90), 68 (39–89) and 46 (27–83) (Fig. 2A). As shown in Table 1, PLE and BIS values at LOC were comparable. There were no significant differences between PLE and BIS values from baseline (preanesthetic value) to 3 minutes after skin incision. The mean PLE value was approximately 5 higher than the BIS value at 5 minutes after skin incision; this difference was statistically significant. SD and coefficient of variation (CV) of PLE were comparable to those of BIS at LOC, but lower than those of BIS at the other time points (Table 1).
Fig. 2
Box and whiskers plots of PLE and BIS values during anesthesia induction and emergence. (A) Both PLE and BIS values decrease progressively with increasing propofol Ce during anesthetic induction. (B) Both PLE and BIS values increase by stages during emergence from anesthesia. The upper and lower limits of the box indicate the 75th and 25th percentiles of the sample, and the horizontal line inside each box indicates the median. The upper and lower notches indicate the 90th and 10th percentiles of the sample. Values below and above the notches are drawn as individual points.
PLE = phase lag entropy, BIS = bispectral index.
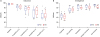
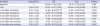
Table 1
BIS and PLE values during induction and the start of surgery
During induction, the PK values, with 95% confidence interval (CI) and standard error (SE), of PLE and BIS for detecting propofol Ce change was 0.750 (95% CI, 0.725–0.775; SE, 0.013) and 0.756 (95% CI, 0.732–0.780; SE, 0.012) respectively. Correlation analysis revealed an r of 0.98 (P < 0.001) between BIS and PLE during induction.
PLE and BIS were compared when the median value for 1 of the monitors was at the upper limit of the target range for surgical anesthesia (60 [59.5–60.5]). The median (25%–75%) PLE value was 58 (53–62) when the median BIS value was 60 (59.5–60.5), and the median value (25%–75%) of BIS was 55 (46–61) when PLE value was 60 (59.5–60.5).
DOA measurements during nerve integrity monitoring
No aberrant BIS or PLE values were observed in any patient during NIM. PLE and BIS values differed significantly from each other at platysma muscle exposure, thyroid exposure, and subcutaneous tissue closure; the PLE value was approximately 4–5 higher than the BIS value (Table 2). BIS-EMG values were significantly higher than PLE-EMG values at recurrent laryngeal nerve exposure and subcutaneous tissue closure.
Table 2
BIS and PLE values during nerve integrity monitoring

DOA measurements during emergence from anesthesia
Both PLE and BIS values increased progressively with decreasing propofol Ce, from the time of cessation of anesthetic medications to full recovery of orientation. As shown Fig. 2B, median (minimum-maximum) PLE values increased from 48 (33–65) to 70 (58–91), 88 (69–94), 90 (73–94), and 92 (80–94) over this time period. BIS values increased from 43 (27–64) to 74 (62–85), 80 (75–86.6), 80 (70–99), and 83 (77–94). As shown in Table 3, there was no significant differences between PLE and BIS values at discontinuation of anesthetic medications or ROC. Both PLE and BIS values were higher at ROC than at LOC. During the time from discontinuing anesthetic medications to ROC, BIS and PLE values increased by approximately 30 and 25, respectively. However, PLE values were significantly higher than BIS values from the time of endotracheal extubation to full recovery of orientation. In contrast to PLE, the mean BIS value did not reach the baseline value at full recovery of orientation. BIS and PLE values at full recovery of orientation were approximately 12 and 4 lower than baseline values, respectively (Tables 1 and 3). Nevertheless, PLE correlated well with BIS during emergence (r = 0.92, P < 0.001). The PK values of PLE and BIS for detecting propofol Ce change were 0.749 (95% CI, 0.710–0.788; SE, 0.020) and 0.746 (95% CI, 0.704–0.788; SE, 0.021), respectively, during emergence.
Table 3
BIS and PLE values during emergence

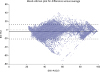
Bland-Altman analysis
Fig. 3 presents the Bland-Altman plots for (BIS+PLE)/2 vs. (BIS−PLE), which contained 70,282 points of index pairs from baseline to full recovery of orientation. The estimated bias was −4.16, and the SD was 8.7. The 95% limits of agreement were −21.21 to 12.89.
Fig. 3
Bland-Altman plot for (BIS+PLE)/2 vs. (BIS−PLE) containing 70,282 paired-index points recorded for 34 patients, reflecting the agreement between BIS and PLE values. The thin dotted line indicates the similarity of the 2 indices, the thick solid line indicates the estimated bias of the 2 indexes, and the thick dotted lines show the 95% limits of agreement.
BIS = bispectral index, PLE = phase lag entropy.
DISCUSSION
In this study, we compared the performance of PLE with BIS in patients undergoing thyroid surgery using NIM. We found that PLE and BIS comparably predicted propofol Ce during induction and emergence. PLE value was significantly higher than BIS value at full recovery of orientation, could reach the preanesthetic value. The 2 monitors correlated positively with each other during induction and emergence. Neither PLE nor BIS values were affected by NIM. Although BIS and PLE were not identical in the Bland-Altman analysis, they showed good agreement during the anesthetic period.
The ideal DOA monitor accurately distinguishes between different states of anesthesia, such as awake, LOC, and ROC, and reflects the effects of anesthetic medications. Many studies have established that BIS values correlate well with the degree of sedation/hypnosis, regardless of the type of anesthetic, and reduces the risk of intraoperative awareness in patients at high risk of awareness.34 The complete BIS algorithm remains unpublished, but known parts of the algorithm indicate that BIS is calculated from several EEG-derived parameters. These parameters include a time domain (burst suppression and QUAZI suppression), frequency domain (relative beta ratio), and bispectral domain (SynchFastSlow).3 However, Miller et al.15 suggested that bispectral analysis does not imply interfrequency phase coupling, and bicoherence is independent of signal amplitude, so BIS monitoring provides no more information than simple power spectral-based analysis. Moreover, some studies reported discrepancies between the observed state of consciousness and BIS values.819
Recent studies have revealed that complexity or diversity of communication between brain regions is directly related to consciousness.6 During anesthesia, diversity of communication in brain regions decreases and phase coherence of the anterior brain region increase. Therefore, quantifiable techniques are required that can accurately measure the complexity of communication in the frontal region. Most of DOA monitors, including BIS, are based on temporal characteristics of a single-channel EEG and, therefore, cannot provide spatial or connectivity information.20 The PLE algorithm calculates Shannon entropy after extracting phase relationship patterns from multiple channels, including prefrontal and frontal channels. Shannon entropy is an instrument for quantifying how the extracted pattern distributes and, thereby, enables prediction of the complexity of communication between brain regions.6
There have been no reports previously published in the peer-reviewed literature describing the performance of a PLE monitor in a clinical setting. One preliminary study reported that the dynamics of the phase relationship between frontal channels became progressively less diverse and more stereotyped during unconsciousness in patients undergoing propofol anesthesia, quantified as a reduction in PLE.6 Lee et al.6 demonstrated that PLE showed stronger agreement with level of consciousness than did other DOA indicators, such as BIS and approximate entropy. They also showed that PLE changes during anesthesia were consistent across subjects.6 The present study confirms the results of Lee et al.6 regarding the performance of PLE as a measure of anesthetic depth during induction and emergence.
Reliable monitors exhibit good correlation between measured values and physiologic responses, as well as minimal interpatient variability. BIS and PLE values have the same range and recommended values for general anesthesia. Despite major differences in their algorithms, we observed only minor differences during anesthesia, as shown in the Bland-Altman analysis, and PLE and BIS values were strongly correlated with each other during induction and emergence. Although there were some time points when the differences between PLE and BIS values reached statistical significance, the values were clinically comparable. Interpatient variability or baseline variation can be judged with CV and SD. Baseline variability can profoundly affect EEG-based pharmacodynamic estimation of parameters assessing DOA. In the current study, baseline variation may have differed between the 2 monitors because of their different smoothing times: 15 seconds with the BIS monitor and approximately 8 seconds with the PLE monitor.
In this study, we compared PLE and BIS values during changes in propofol Ce values. To accurately detect decreases in level of consciousness during slow induction of anesthesia, we avoided the use of a sedation scale such as Observer Assessment Alertness/Sedation (OAAS) scale, as this assessment could awaken the patient, interrupting the smooth transition to unconsciousness. Instead, we used progressive increases in propofol Ce (in 1 μg/mL-increments) to identify the stages of anesthetic induction. Propofol Ce has been previously shown to correlate strongly with OAAS scale and BIS.2122 Predicted propofol Ce can also be used as a guide for administering propofol, similar to the use of minimal alveolar concentration for guiding volatile anesthetic administration.23 Therefore, we assessed the ability of PLE to predict changes in propofol Ce, which should reflect its ability to detect changes in DOA. We found that both PLE and BIS values incrementally decreased as propofol Ce increased. Using PK17 to investigate their accuracy in distinguishing different states of anesthesia, we found that the PK values for PLE and BIS were 0.750 and 0.756, respectively, and the 95% CI did not include 0.5 for either monitor. These findings indicate that both monitors are good predictors of DOA during induction. We also noted that propofol Ce at LOC was 3.78 ± 0.72 μg/mL, which was similar to the results of other studies.2223 Various values have been previously reported for BIS at LOC, depending on the methods of assessing LOC and the patients’ characteristics,2425 but they generally ranged between 60 and 80. We found similar values for both BIS and PLE in the current study. When considering the BIS level for surgical anesthesia, our results showed that, at a BIS value of 60 (the upper limit of the range for surgical anesthesia), the median PLE value was 58.
During anesthesia, many artifacts can influence EEG-based DOA monitors, which can lead to inappropriate titration of anesthetics. Although BIS monitors reject artifactual signals from epochs and rejected data can be estimated by interpolation, case reports have described artifactual signals producing BIS values that did not correlate with DOA.1226 Other case reports noted that NIM using EMG ETT influenced the quality of EEG signals, falsely increased BIS values.2627 EMG ETT is an endotracheal tube containing paired wire electrodes, which contact the vocal cords at the glottic level and allow surgeons to confirm the site of the recurrent laryngeal nerve with a stimulating probe. When electric current was given through the stimulating probe, a resulting EMG response was detected. However, the electric current from an EMG stimulating probe may be interpreted as EEG activity by a BIS monitor because this electric current can be directly leaked to BIS electrodes or generate EMG signals. The BIS value is calculated using EEG signals in the 0–47 Hz range, and the BIS-EMG value is computed using a logarithmic scale of the total power of signals between 70 and 110 Hz. During general anesthesia, an acceptable BIS-EMG value is < 55 dB and an optimal value is < 30 dB.3 However, because EMG signals can exist in the 30–300 Hz range, 30–47 Hz EMG signals can be interpreted as an EEG signal, yielding a falsely elevated BIS value and a low BIS-EMG value.3 Furthermore, a volunteer study reported that BIS values decreased after neuromuscular blockade by decreasing the beta ratio, despite unchanged consciousness.28 In the current study, we found that 1-mA NIM of the anterior neck and recurrent laryngeal nerve did not produce any aberrant PLE nor BIS values. EMG parameters during NIM were within the acceptable ranges of 20–30 dB with both monitors. The electric current used for NIM entered through vocal cord and flowed towards the chest where the grounds were located. Even though the electric current was relatively high as 1-mA, it flowed distant from forehead, and generated EMG signals that may not be large enough to affect BIS or PLE. PLE calculates the EMG parameter using signals > 45 Hz and PLE2 is computed by EEG signals with ranges 0.1–1 and 32–45 Hz. Theoretically, PLE could also interpret 30–45 Hz EMG as an EEG signal, and electric current emerged from stimulating probe can be flowed in PLE electrodes. However, PLE obtains phase relationship between EEG signals from 2 channels simultaneously and phase relationship is binarized to calculate entropy. Even if the electrical artefacts are flowed in 2 EEG channels, they are removed during the process of binarization. Nevertheless, further research is required to determine whether PLE is less affected by other factors, such as facial nerve monitoring, lengthy electrocautery use, or atypical or pathological EEGs when compared with other DOA devices.
Emergence from anesthesia is a crucial period, during which severe adverse effects or prolonged recovery may occur. Adequate assessment of the stages of anesthetic emergence may improve patient safety and reduce these risks. BIS has been shown to improve quality of recovery from anesthesia by reducing times to eye opening, extubation, and orientation, when compared with clinical signs assessment.4 Previous studies of DOA monitors assessed the period until ROC,1629 but we extended our evaluation to include all stages of awakening until full recovery of orientation. We found that BIS values rose faster than PLE values from the time of discontinuation of anesthetic medications to ROC, and both BIS and PLE produced higher values at ROC than at LOC. The latter finding may reflect a lower propofol Ce at ROC than at LOC. However, PLE values rose faster than BIS values from ROC to full recovery of orientation, and at full recovery of orientation, the PLE value reached the preanesthetic value, whereas the BIS value remained approximately 12 lower than baseline. These results are consistent with those of an earlier study, which reported that the BIS value reached approximately 85% of the preoperative baseline value at awakening.30 Failure of BIS to return to the preanesthetic value at full recovery of orientation suggests a potential difference between PLE and BIS with respect to their sensitivity to residual concentrations of anesthetics. Propofol Ce was approximately 1 μg/mL at full recovery of orientation. Although we did not assess PLE or BIS at propofol Ce 1 μg/mL during induction, the median BIS value at propofol Ce 2 μg/mL was 86, which was higher than that at full recovery of orientation. PK values of PLE and BIS for detecting propofol Ce during emergence were similar, but PLE reflected the emergence stages more reliably than BIS.
This study has a few limitations. First, the PLE electrodes were placed lower on the forehead than the BIS electrodes. Frowning or eye movement during recovery may have therefore affected PLE more than BIS and led to a more rapid rise in PLE values after ROC. However, the PLE monitor does not compute a PLE value when the signal quality index is < 40 because of an eye blink.14 Movements of the eyelids and frontalis muscles can exert very high voltage signals that do not affect PLE or BIS values. Second, we did not analyze the raw EEG data. The raw EEG may have detected more subtle effects of NIM on the EEG waveform and may have allowed us to understand the reasons for the difference between monitors during emergence. Interpreting raw EEG data requires specialists and is time-consuming, which is impractical in the usual clinical setting. As most anesthesiologists depend intuitionally on the values of the processed EEG monitors, we focused on simply comparing BIS and PLE values. Third, only propofol was used as the hypnotic agent in the study. Because performance of a DOA monitor should be independent of the type of anesthetic agent, assessing the performance with other anesthetic agents is necessary. Other limitations of the present study included the lack of diversity of operations and the limited number of patients. The accuracy of PLE remains to be validated in other surgeries and larger groups of patients.
In conclusion, PLE would be a reliable monitor for assessing DOA during the induction and emergence from general anesthesia via target-controlled propofol and remifentanil infusion. PLE values may better reflect recovery of consciousness than BIS values during emergence from anesthesia. Both PLE and BIS were not affected by electrical stimulation for NIM in patients undergoing thyroid surgery using EMG ETT. Despite major differences in their algorithms, there were minor differences in the PLE and BIS values during anesthesia. Additional studies are required to further validate the performance of PLE in the clinical arena.
 XML Download