

 PDF
PDF ePub
ePub Citation
 Print
Print


INTRODUCTION
Coronary artery calcium (CAC) is a robust marker of coronary atherosclerosis and correlates closely with the overall coronary atherosclerotic plaque burden.1)2) CAC scoring by cardiac computed tomography (CT) is a reliable tool for predicting adverse cardiovascular events, and is widely performed in the asymptomatic population to improve cardiovascular risk prediction.3)4)5) Notably, the absence of CAC confers a very low risk of future cardiovascular events, not only in western populations, but also in non-western populations.3)6)7)8) However, even in individuals with a CAC score of zero, the all-cause mortality risk increases as the presence of conventional risk factors increases.8)9) Thus, the clinical value of a CAC score of zero may vary according to the conventional risk factors.
Additionally, atherosclerosis is a dynamic process. Although a baseline CAC score of zero signifies a very low risk of adverse cardiovascular events, a subset of this population will experience CAC progression. Risk should be reassessed in individuals with CAC progression, as the most recent CAC score has a superior predictive value for future risk.10) However, to date, few studies have investigated CAC progression in individuals with a CAC score of zero. Thus, it remains unclear which subset of this population is prone to CAC progression. Furthermore, data in Asian countries is particularly lacking. Therefore, using a large cohort of asymptomatic Korean adults, we aimed to assess CAC progression in individuals with a baseline CAC score of zero, and to elucidate CAC progression according to a conventional risk stratification algorithm. In addition, we identified independent clinical factors associated with CAC progression in individuals with a CAC score of zero.
METHODS
Study population
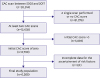
We utilized data from The Korea Initiatives on Coronary Artery Calcification (KOICA) registry, which is an observational, retrospective, single-ethnicity, multicenter registry of individuals who underwent cardiac CT for CAC scoring as a part of a health checkup at six healthcare centers in South Korea in a self-referral setting. Between April 2003 and March 2017, a total of 93,914 individuals enrolled in the registry (Figure 1). Of these, 12,638 individuals underwent at least two CAC scans; 6,799 individuals had an initial CAC score of zero. Of these, 6,268 had complete data for the ascertainment of risk factors (see below) and were included. The responsible institutional review board committees of each participating healthcare center approved this retrospective study and waived the need for informed consent.
Ascertainment of risk factors
During the health checkup, a detailed interview regarding sociodemographic factors and risk profiles was administered. All participants underwent clinical examinations, including a laboratory test after a minimum 8-hour fast. The predicted 10-year atherosclerotic cardiovascular disease (ASCVD) risk was estimated by using the pooled cohort equation, which was developed by the American College of Cardiology/American Heart Association.11) The 10-year ASCVD risk takes into account the patient's age, sex, ethnicity, total cholesterol level, high-density lipoprotein cholesterol level, treatment for hypertension, systolic blood pressure, smoking status, and the presence of diabetes. The study participants were classified into three groups according to the 10-year ASCVD risk: <5%, ≥5% but <7.5%, and ≥7.5%.12)
Cardiac computed tomography acquisition and analysis
The CAC score was acquired using greater than 16-slice multidetector CT scanners. The specific CT scanner types differed by center and included the Philips Brilliance 256 iCT (Philips Healthcare, Cleveland, OH, USA), Philips Brilliance 40 channel MDCT (Philips Healthcare), Siemens 16-slice Sensation (Siemens, Forchheim, Germany), and GE 64-slice Lightspeed (GE Healthcare, Milwaukee, WI, USA). Calcium scoring was calculated using the Agatston score, with a threshold of 130 Hounsfield Units (HU) on pre-contrast CT images.13) To obtain an accurate calcium score, the observer performed a modification procedure to remove calcium from the aortic wall and valve, which are located outside the coronary arteries. Patients with stents were excluded because of the risk of overestimating the calcium score.14) Furthermore, the square root-transformed difference between baseline and follow-up CAC scores was calculated [√CAC score (follow-up) − √CAC score (baseline)], and CAC progression was defined as a square root-transformed difference >2.5 to minimize the effect of interscan variability.15) For participants with more than 2 CT scans, the square root-transformed difference was calculated for each follow-up CT scan, and the date of the earliest follow-up scan demonstrating CAC progression was recorded. The CAC progression rate was calculated as the annualized square root-transformed difference between the baseline and last follow-up CAC scores.
Statistical analysis
Continuous variables are expressed as means±standard deviation (SD); categorical variables are expressed as proportions. Continuous variables were compared between groups using the Student's t-test for normally distributed data and the Wilcoxon rank-sum test for non-normally distributed data. Categorical variables were compared between groups using the χ2 test or Fisher's exact test, as appropriate. Group differences in the CAC progression rate were evaluated using a 1-way analysis of variance with Tukey post hoc comparisons. The Kaplan-Meier method was used to visualize the CAC progression rate. The date of the earliest scan in which CAC progression was detected was assigned as the date of the occurrence of an event. The Kaplan-Meier curves were also used to estimate the distribution of the time to CAC progression according to the 10-year ASCVD risk, and differences among groups were evaluated with the log-rank test.
Univariable and multivariable linear regression analyses were performed to determine the effects of various coronary risk factors on the annualized progression of the CAC score; the results are expressed as beta coefficients (βs) and the corresponding 95% confidence intervals (CIs). Collinearity among the included variables was tested using variance inflation factors (VIFs), and values less than 4.0 were considered to indicate non-collinearity. The variables included in the linear regression analyses were as follows: age, male sex, body mass index (BMI), waist circumference, hypertension, dyslipidemia, diabetes, current smoking, hemoglobin, low-density lipoprotein cholesterol (LDL-C), triglyceride, creatinine, estimated glomerular filtration rate, fasting glucose, and glycated hemoglobin. Stepwise regression under Akaike's Information Criterion was performed to determine the appropriate multivariate linear regression model.
All reported p values are 2-tailed, and a p≤0.05 was considered statistically significant. All statistical analyses were performed using R Statistical Software/Environment (version 3.4.3, The R foundation for Statistical Computing, Vienna, Austria).
RESULTS
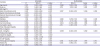
Table 1 summarizes the baseline characteristics. Of the 6,268 included participants with a baseline CAC score of zero, 4,552 (72.6%), 867 (13.8%), and 849 (13.5%) had a 10-year ASCVD risk of <5%, ≥5% but <7.5%, and ≥7.5%, respectively.
Table 1
Baseline characteristics
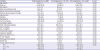
Values are presented as number of patients (%) or means±standard deviation.
ASCVD = atherosclerotic cardiovascular disease; BMI = body mass index; CAC = coronary artery calcium; eGFR = estimated glomerular filtration rate; HDL-C = high-density lipoprotein cholesterol; hs-CRP = high-sensitivity C-reactive protein; LDL-C = low-density lipoprotein cholesterol.
![]()
During follow-up (median duration between the first and last scan, 109 months; interquartile range, 78–208 months), CAC progression was observed in 719 participants (11.5%), and the average time to CAC progression was 218±8 months. Although the duration between the first and last scan was significantly longer in participants with CAC progression (median: 156 vs. 109 months; p<0.001), this difference was associated with the finding that additional follow-up scans were more likely to be performed in those with CAC progression (3.1 vs. 2.3 scans; p<0.001). Therefore, the interval between each scan was not significantly different between participants with and without CAC progression (52 vs. 52 months; p=0.477). Participants with CAC progression showed higher proportions of cardiovascular risk factors and were more likely to have a higher 10-year ASCVD risk than that in participants without CAC progression (Table 1).
The median duration between the first and last scan according to ASCVD risk group was 109, 120, and 125 months for participants with a 10-year ASCVD risk of <5%, ≥5% but <7.5%, and ≥7.5%, respectively (p<0.001). Interestingly, the interval between each scan was shorter in the lower 10-year ASCVD risk groups than in the highest ASCVD risk group (52, 55, and 56 months; p=0.002). The absolute increase in the CAC score was 4.4±23.4 for the total study population. In terms of the ASCVD risk groups, the absolute increase in the CAC score was 2.8±13.6, 6.9±23.2, and 10.1±49.4 for participants with a 10-year ASCVD risk of <5%, ≥5% but <7.5%, and ≥7.5%, respectively (Figure 2A). The mean CAC progression rate was 0.92 ± 5.08 events/year for the total study population, and was 0.64±3.62, 1.29±5.10, and 2.04±9.58 events/year for participants with a 10-year ASCVD risk of <5%, ≥5% but <7.5%, and ≥7.5%, respectively (Figure 2B).
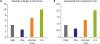 | Figure 2CAC progression in individuals with a baseline CAC score of zero according to the 10-year ASCVD risk score. (A) Absolute changes in CAC score between the first and last scan are shown. (B) Annualized CAC progression rate is presented.ASCVD = atherosclerotic cardiovascular disease; CAC = coronary artery calcium.
|
The cumulative proportion of CAC progression in the total study population is shown in Figure 3A. CAC progression was observed in a non-linear manner during follow-up, with CAC progression proportions of 0.3%, 1.9%, 4.3%, 8.6%, and 16.7% in years 1-5, respectively. Furthermore, participants in higher ASCVD risk groups had a significantly higher chance of CAC progression compared to that in participants in lower ASCVD risk groups (Figure 3B). The chance of CAC progression at 5 years was 13.1%, 22.0%, and 27.9% for participants with a 10-year ASCVD risk of <5%, ≥5% but <7.5%, and ≥7.5%, respectively.
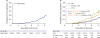 | Figure 3The cumulative proportion of CAC progression. (A) The Kaplan-Meier curve for the total study population is depicted. (B) CAC progression is stratified by the 10-year ASCVD risk.ASCVD = atherosclerotic cardiovascular disease; CAC = coronary artery calcium.
|
Table 2 describes the results of the univariable and multivariable linear regression analyses of the CAC progression rate. In the univariate analyses, age, male sex, BMI, waist circumference, hypertension, diabetes, dyslipidemia, current smoking, hemoglobin level, total cholesterol level, LDL-C level, triglyceride level, creatinine level, estimated glomerular filtration rate, fasting glucose level, and HbA1c level were associated with the CAC progression rate. As expected, the 10-year ASCVD risk had the strongest effect on the CAC progression rate (β=14.75; 95% CI, 11.80–17.70; p<0.001). All clinical variables that were significant in the univariable analyses, except 10-year ASCVD risk, were initially entered into the multivariable model; however, the estimated glomerular filtration rate was further excluded because of multicollinearity. In the multivariable analysis, age, male sex, waist circumference, diabetes, and LDL-C level were revealed as independently associated with the CAC progression rate.
Table 2
Results of the univariate and multivariate analyses
ASCVD, atherosclerotic cardiovascular disease; BMI = body mass index; CI, confidence interval; eGFR = estimated glomerular filtration rate; HDL-C = high-density lipoprotein cholesterol; hs-CRP = high-sensitivity C-reactive protein; LDL-C = low-density lipoprotein cholesterol.
![]()
DISCUSSION
The present study is the first to demonstrate the nature of CAC progression in asymptomatic Asian individuals with a baseline CAC score of zero. The probability of CAC progression in this population was very low during the early stages but increased nonlinearly over time. In addition, the probability of CAC progression increased as the 10-year ASCVD risk increased. Furthermore, an examination of the clinical risk factors associated with CAC progression in this population revealed age, male sex, waist circumference, diabetes, and LDL-C level as independent predictors of the CAC progression rate.
The CAC score itself, as shown in multiple previous studies, is strongly associated with atherosclerotic burden and predicts adverse cardiovascular events.3)16) However, a single measurement of atherosclerosis may not encompass the disease's dynamic nature. Therefore, the quantitative assessment of CAC progression has been proposed as a method to track changes in total atherosclerotic burden.17) Multiple studies have demonstrated that CAC progression is associated with cardiovascular outcomes, independent of clinical risk factors and the baseline CAC score.10)18)19) Although a recent study by Radford et al.10) reported that the association between CAC progression and adverse cardiovascular outcomes did not remain significant when the follow-up CAC score was included in the model, the importance of the serial evaluation of CAC was still supported, as the last CAC score was the strongest independent predictor for adverse cardiovascular events.
Data regarding CAC progression in the general population is currently accumulating.18)19)20) However, only sparse data regarding the CAC progression rate in individuals with an initial CAC score of zero are available.21)22) Gopal et al.22) retrospectively evaluated 710 individuals with a baseline CAC score of zero; 62% of the study participants did not have any CAC progression during an average follow-up period of 4±2 years, and the CAC progression rate of the total study population was 3±3 changes/year. In a subsequent study, Min et al.21) prospectively followed up 422 individuals with a baseline CAC score of zero with yearly CT scanning for 5 years; conversion to a CAC score >0 occurred in a non-linear manner, reaching 11.6% in 5 years, with an average time to conversion of 4.1±0.9 years. However, both of these previous studies were conducted in the United States. Given the ethnic differences in coronary atherosclerosis and calcification,14)23) it is important to understand the nature of CAC progression in Asian individuals with an initial CAC score of zero. The present study adds to the literature by demonstrating how CAC progresses over time in a large sample of exclusively asymptomatic Asian individuals with a baseline CAC score of zero.
Previous studies defined the development of any CAC (CAC >0) as conversion to CAC progression.21)22) However, reducing variability between scans is paramount to accurately quantifying CAC progression. Therefore, to minimize the effect of interscan variability, we defined CAC progression as a square root-transformed difference >2.5.13)15) Thus, the average time to progression in the present study cohort (4.2±1.7 years) cannot be directly compared to that in previous studies. However, as in a previous study,21) the present study cohort demonstrated non-linear CAC progression, with the proportion of CAC progression increasing from only 0.3% at 1 year to 16.7% at 5 years.
While most conventional coronary risk factors are known to be generally related to both CAC incidence and progression,23)24) CAC progression in asymptomatic individuals has never been compared according to the clinical risk profile. Thus, we aimed to elucidate the risk of CAC progression according to the 10-year ASCVD risk as calculated using the pooled cohort equation.11) Given that current guidelines recommend statin and anti-hypertensive medication according to the 10-year ASCVD risk,12)25) it is important to evaluate whether the risk stratification algorithm is able to differentiate the cohort prone to CAC progression, even among those with a baseline CAC score of zero. The present study showed that even in individuals with a CAC score of zero, the probability of CAC progression at 5 years was >2-fold higher in individuals with a 10-year ASCVD risk ≥7.5% than in those with a 10-year ASCVD risk <5% (27.9% vs. 13.1%). As the CAC progression rate gradually increased with greater 10-year ASCVD risk, the present results further suggest the usefulness of the pooled cohort equation in stratifying the risk of CAC progression, even among those with a baseline CAC score of zero. At the same time, interestingly, the scan interval was significantly longer in individuals in the highest 10-year ASCVD risk group than in the lowest risk group, reflecting our current practice pattern regarding repeated CAC scanning. Although no guideline currently advocates for repeated scanning according to the CAC score, especially in individuals with zero CAC score, we believe that the present findings support and expand the literature, setting the stage for prospective randomized trials, which are required to identify a subset of individuals who may benefit from repeated CAC scanning.
Min et al. previously reported that age >40 years, diabetes, and smoking independently increased the risk of conversion to a CAC score >0 in individuals with a baseline CAC score of zero.21) Although age and diabetes were independent predictors in both the present and previous cohorts, smoking did not remain an independent predictor of CAC progression in the present study. Instead, waist circumference and LDL-C were revealed as independent predictors for CAC progression in individuals with an initial CAC score of zero. Given that differential effects for CAC progression exist according to ethnicity, as reported by Multiethnic Study of Atherosclerosis (MESA) investigators,23) this difference in results may derive from ethnic differences between the two studies. However, the 2 studies also differ in the data included in the models. In the previous study by Min et al.,21) only age, sex, dyslipidemia, hypertension, diabetes, and smoking were included in the analysis, whereas we additionally utilized data from the physical examination and laboratory tests. In addition, while the previous study by Min et al.21) defined smoking history as both past and current smoking use, we only included current smokers. Therefore, it is difficult to interpret the difference in the results between the two studies as solely due to ethnic differences. Nevertheless, considering that the MESA study only distinguished white, Chinese, black, and Hispanic ethnic groups, the present study, which focuses exclusively on Korean individuals with a CAC score of zero, provides valuable information regarding the risk factors associated with CAC progression in Korean individuals. Certainly, the predictability of waist circumference and LDL-C need to be examined in other ethnic groups.
The main limitation of the present study is its observational retrospective design. Furthermore, all participants in the present study were self-referred and underwent cardiac CT as a part of a general health evaluation; follow-up CT scans were also performed through a self-referred mechanism. The present study cohort of self-referred, healthy individuals may not be fully representative of the general population, and the risk of a selection bias should be considered. However, as previous studies on individuals with a CAC score of zero were designed as single-center studies and confined to physician-referred patients,21)22) an important advantage of the present study is that it is a large multi-center study of asymptomatic individuals. Although data regarding medication history, including the use of statins, was not available in the present study, we were able to collect physical examination data, including blood pressure, body weight and height, and waist circumference, and laboratory data, including the levels of creatinine, HbA1c, and cholesterol, as we included individuals who underwent a health checkup program. As a result, we could calculate the 10-year ASCVD risk using the pooled cohort equation and evaluate its predictability for CAC progression. Finally, in the present study, follow-up CT was not guided by a specific study protocol; thus, the interscan duration varied among study participants. However, such effects are inevitable in studies that observe the clinical diagnostic and treatment pathway. Furthermore, to minimize the effect of variations in the interscan duration, we calculated annualized CAC progression (CAC progression rate).
In conclusion, the present study results demonstrate that a baseline CAC score of zero is associated with a very low probability of CAC progression in Korean individuals. However, the probability of CAC progression increases nonlinearly over time. In addition, even among those with a CAC score of zero, the probability of CAC progression increases as the 10-year ASCVD risk increases. Furthermore, among conventional clinical risk factors, age, male sex, waist circumference, diabetes, and LDL-C level independently predict the CAC progression rate in Korean individuals with a CAC score of zero.
 XML Download