

 PDF
PDF ePub
ePub Citation
 Print
Print


INTRODUCTION
Infection with Mycobacterium tuberculosis (M. tb) causes tuberculosis (TB), which remains a serious global health problem, with an estimated incidence of 10.4 million cases per year.1 Early diagnosis and successful treatment have prevented millions of people from TB deaths each year. However, TB remains the leading infectious cause of death worldwide, accounting for about 1.3 million deaths among HIV-negative people in 2016.1 Once individuals are infected with M. tb, approximately 5% develop active TB diseases, while 95% remain healthy without any clinical manifestation of TB.2 However, individuals with latent TB infection (LTBI) have a 5–15% lifetime risk of developing active TB.1 Therefore, it is imperative to screen and treat those with LTBI in order to effectively control TB by decreasing the number of active cases.
The absence of a gold standard for identifying LTBI remains a challenge although two tests are widely used for this purpose: a tuberculin skin test (TST) and the IFN-γ release assay (IGRA). TST, a traditional method for detecting LTBI, measures the size of skin induration after an intradermal injection of 0.1 mL tuberculin (purified protein derivative; PPD).2 It is simple and economical, but false positives are frequently reported in individuals with recent BCG vaccination or exposure to nontuberculous mycobacteria.2 To overcome the disadvantages of TST, an IGRA, more specifically the QuantiFERON-TB Gold In-Tube (QFT-GIT) test, was developed to differentiate LTBI by assessing the amount of IFN-γ induced by M. tb-specific antigens, including ESAT-6, CFP-10, and TB7.7.3 The IGRA has been reported to have higher specificity and sensitivity for detecting LTBI than TST. However, its utility is restricted in low- and middle-income countries with limited resources, and as such, TST continues to be recommended for diagnosis of LTBI by World Health Organization (WHO) guidelines.4
The global need for a rapid, accurate, and inexpensive point-of-care test (POCT) has led to efforts to improve current TB diagnostics, including the development of Xpert MTB/RIF.15 A sensitivity and specificity greater than 90% were observed with the lateral flow POCT, which detects antibodies to epitopes of M. tb cell wall proteins in TB patients,6 and a serological POCT using the microchip-based TB enzyme-linked immunosorbent assay (ELISA) had better sensitivity than sputum smear microscopy (72% vs. 56%).7 Another POCT determines M. tb lipoarabinomannan with 55.6% sensitivity and 100% specificity in patients with both TB and HIV.8 Unlike active TB diagnostics, the diagnostic tests for LTBI are not able to detect M. tb itself, but rather mostly rely on assessing adaptive immune responses against M. tb antigens. A novel skin test, C-Tb, uses recombinant ESAT-6 and CFP-10 antigens instead of the PPD antigen, and it is not affected by BCG vaccination.9 It showed a similar safety profile to the traditional TST.9 A POC molecular test that measures IFN-γ or IP-10 mRNA has been reported as well.1011 However, limited accuracy and lack of international standards remain primary challenges to developing a POCT.12
In South Korea, TB is still a major infectious disease, with an estimated incidence of 77 cases per 100000 people in 2016.13 Most cases of TB are reported as pulmonary TB, and 68% of cases were bacteriologically confirmed.13 More than 70% of TB patients had Beijing genotypes in clinical isolates, and the Beijing/K strain was identified as the predominant strain during school outbreaks.1415 The treatment success rate was 84% in 2015, but new and recurrent cases are still noted, despite an overall decline in prevalence.13 In addition, approximately one third of the Korean population is at risk of developing TB due to LTBI and TB outbreaks, which often lead to an elevated number of individuals with LTBI. In order to avoid potential progression to active TB, a national program for preventive treatment of LTBI has not only targeted high risk groups, but also enacted strategies to eliminate and control TB through early diagnosis and treatment since 2017. A nationwide test for LTBI has been performed in high school students, and it has been an obligatory requirement for workers in medical and educational facilities and for army conscription. Anyone who has a positive response to PPD by TST has their LTBI status confirmed by a second QFT-GIT test before initiating treatment for LTBI.
In this study, we aimed to assess the IFN-γ performance of the POC ichroma™ IGRA-TB cartridge, which was developed by Boditech Med Inc. in South Korea. We determined IFN-γ responses in whole blood samples, which were incubated with M. tb-specific antigens. We used the same QFT-GIT test antigen tubes and measured the IFN-γ responses using two different assays: QFT-GIT IFN-γ ELISA and the ichroma™ IGRA-TB test. We analyzed rates of IFN-γ positive responses in each assay, and evaluated the diagnostic value of the test using the POC ichroma™ IGRA-TB cartridge. In addition, the feasibility of the ichroma™ IGRA-TB cartridge for identifying LTBI was evaluated by the total concordance of positive and negative IFN-γ responses between the two tests and by the association of quantitative values of IFN-γ released.
MATERIALS AND METHODS
Enrollment of study participants
From April to September 2017, a total of 60 normal, healthy subjects, including 10 recent TB contacts (≥18 years of age) with no clinical symptoms of active TB, were enrolled at Hallym University Hospital. Three active pulmonary TB patients who were diagnosed by clinical and radiological features and by microbiological identification of M. tb, were also recruited at the same hospital during the study period as a positive control of M. tb infection. Subjects who had prior history of TB were excluded, as were those who had HIV, cancer, or diabetes. The study protocol was explained to the 63 subjects, and informed written consent was obtained for clinical examinations and blood sampling for immunological testing. Ethical permission for this study was granted by the Hallym University Hospital Ethics Review Committee (IRB number 2017-27).
Preparation of blood samples
Heparinized blood samples were collected in three QFT-GIT blood collection tubes (QuantiFERON-TB Gold In-Tube; Qiagen, Hilden, Germany) and incubated upright at 37℃ for 18–24 hours. Harvested plasma was divided into two aliquots and stored at −70℃ until the end of subject recruitment.
QFT-GIT tests
IFN-γ ELISAs were performed with harvested plasma according to the manufacturer's protocol (Qiagen). Briefly, 50 µL of freshly prepared enzyme-conjugate solution was added to the wells of the microplates. IFN-γ standards were reconstituted based on the protocol, and 50 µL of standards and harvested plasma samples were loaded into the 96-well microplates. The microplates were incubated at room temperature for two hours after mixing the conjugate and standard plasma samples. The microplates were washed six times using the diluted wash buffer, and 100 µL of enzyme substrate solution was added to each well. Following a 30-minute incubation at room temperature, 50 µL of enzyme stopping solution was added, and the optical density of each well was measured at 450 nm.
ichroma™ IGRA-TB tests
The ichroma™ IGRA-TB test was performed according to the manufacturer's protocol (Boditech Med Inc.). Briefly, detection buffer was prepared by adding 150 µL of diluent into the dried detection buffer containing anti IFN-γ and anti-chicken IgY, which were both fluorescently labeled. After confirming complete dissolution of the detection buffer, it was mixed with 100 µL of culture supernatants, which were harvested from the QFT-GIT antigen tubes. Then, 75 µL of the mixture was loaded onto the nitrocellulose membrane in a cartridge. After incubation at room temperature for 15 minutes, the cartridge was scanned, and fluorescence intensity was measured at 613 nm using the ichroma™ II reader (Boditech Med Inc.).
Statistical analysis
An optimal cut-off point for positive IFN-γ responses in the ichroma™ IGRA-TB test was selected based on the Youden's index.16 The diagnostic accuracy of the ichroma™ IGRA-TB test was evaluated by the value of the area under the receiver operating characteristic curve (AUC) using GraphPad Prism 6 (GraphPad Software Inc., La Jolla, CA, USA). Agreement of positive and negative results between the ichroma™ IGRA-TB and QFT-GIT tests was examined using Kappa statistics, and the association between IFN-γ values measured by the two tests was analyzed by Spearman's rank correlation coefficient, using Stata 13 (StataCorp LP., College Station, TX, USA).
RESULTS
Characteristics of the study participants
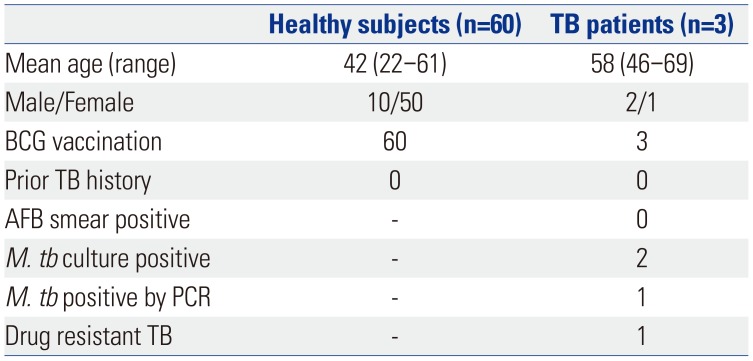
The healthy subjects included 10 TB contacts who did not exhibit any clinical symptoms. Among the 60 enrolled subjects, there were 50 females and 10 males, and the mean age was 42 years (range, 22–61). The three active pulmonary TB patients (two males and one female) were enrolled during the same period. None of the three patients had sputum samples that were positive for acid-fast bacillus (AFB) staining, but the presence of M. tb was confirmed by culture in two of the patients and by polymerase chain reaction (PCR) in one patient. All study subjects received BCG vaccinations at a young age, and no subjects had a history of TB prior to enrollment (Table 1).
Determination of M. tb infection using QFT-GIT IFN-γ ELISA and its POC platform
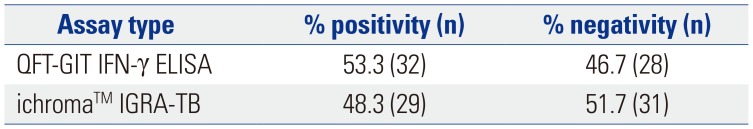
Based on the outcomes of commercially used diagnostic QFT-GIT tests, 32 normal, healthy subjects were confirmed to have LTBI. Positive IFN-γ responses were observed in 53.3% of healthy subjects (n=32), while 28 subjects (46.7%) showed negative IFN-γ responses to the QFT-GIT antigens including ESAT-6, CFP-10, and TB7.7 (Table 2). The QFT-GIT also detected positive IFN-γ responses in two TB patients whose M. tb growth was confirmed by culture. However, it was not able to detect M. tb infection in another patient who was diagnosed with M. tb by PCR.
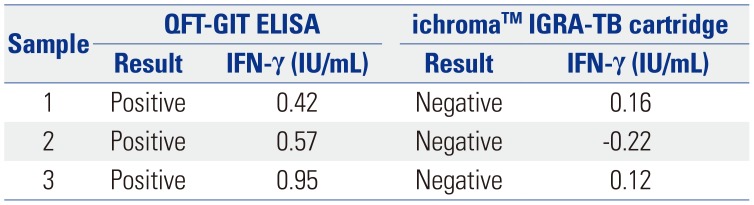
Meanwhile, the IFN-γ values determined by the POC platform, the ichroma™ IGRA-TB cartridge, were relatively lower than those measured by QFT-GIT. The calculated cut-off value for IFN-γ positivity was >0.21 IU/mL with a sensitivity of 91.2% [95% confidence interval (CI), 76.3–98.1%] and 100% specificity (95% CI, 88.1–100%) in the ichroma™ IGRA-TB test (p<0.001). Based on the cut-off point, the ichroma™ IGRA-TB cartridge identified 29 subjects as having LTBI (48.3%) among the 60 healthy subjects (Table 2). The rate of positivity was slightly lower with the ichroma™ IGRA-TB test than with the QFT-GIT test (48.3% vs. 53.3%, respectively), although the difference was not statistically significant (p>0.05). Among the 32 positive IFN-γ responders, as determined by the QFT-GIT test, five subjects showed weak positive IFN-γ responses (<1.0 IU/mL). Among the five weak positive responders, three subjects were responsible for the difference in the rates of positivity between the two tests, as the weak positive IFN-γ values (below 1.0 IU/mL) in the QFT-GIT test were not sufficient for positivity with the ichroma™ IGRA-TB cartridge (Table 3). All other positive IFN-γ responders with values above 1.0 IU/mL on the QFT-GIT IFN-γ ELISA also exhibited positive results with the ichroma™ IGRA-TB test. In three TB patients, the ichroma™ IGRA-TB cartridge also detected positive IFN-γ responses in two culture-confirmed patients. However, neither test was able to detect M. tb infection in another patient who was diagnosed with M. tb by PCR.
Diagnostic value of the ichroma™ IGRA-TB test
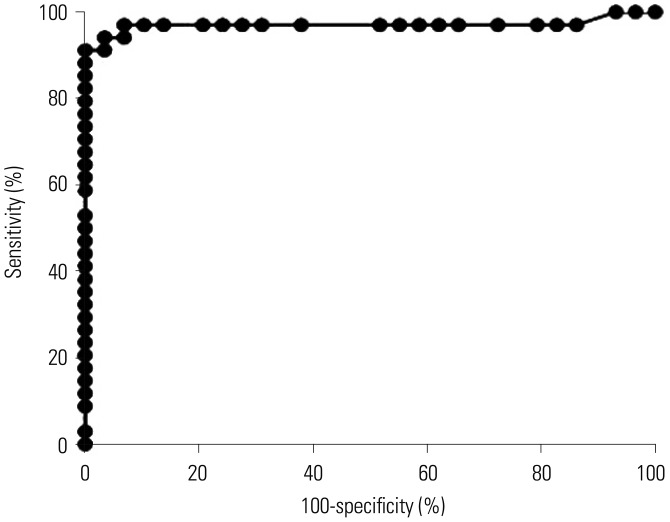
To examine the diagnostic value of the ichroma™ IGRA-TB test, AUC was measured in all 63 study participants, including both healthy subjects and TB patients. The AUC value of the test was 0.9706 (95% CI, 0.92–1.00, p<0.001), indicating the usefulness of the ichroma™ IGRA-TB test in differentiating the individuals who are infected with M. tb from non-infected healthy controls (Fig. 1).
Comparative analyses between the two tests for detecting M. tb infection
The overall pattern of IFN-γ responses was similar between the two tests, although the QFT-GIT test showed higher responses with greater individual variance than the ichroma™ IGRA-TB test (data not shown). Although the median IFN-γ response value was significantly lower in the ichroma™ IGRA-TB test than in the QFT-GIT IFN-γ ELISA (0.18 vs. 0.66 IU/mL, p<0.001), there was no significant difference in the rates of IFN-γ positivity between the two assays (p>0.05). Positive IFN-γ responders, as determined by the QFT-GIT IFN-γ ELISA, also showed positive responses with the ichroma™ IGRA-TB test, except for the three individuals who had weak positivity (IFN-γ <1.0 IU/mL).
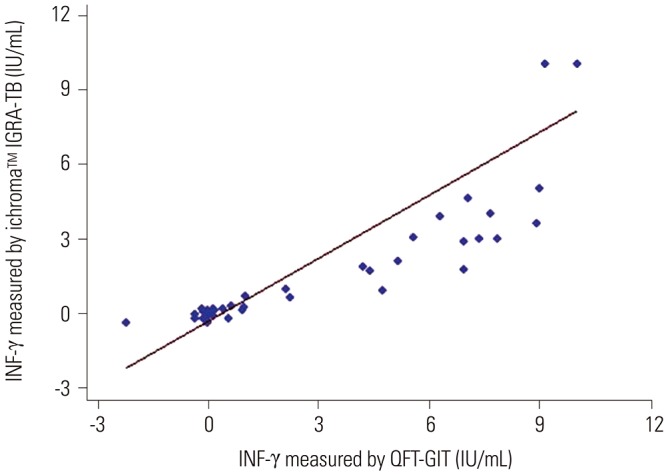
We investigated the statistical significance of diagnostic accuracy for the ichroma™ IGRA-TB test by analyses of agreement and Spearman's rank correlation coefficient in all 63 study subjects. This was performed to determine if it is feasible to replace the commercial IGRA test with the ichroma™ IGRA-TB test. Our data showed excellent agreement in the total concordance of positivity and negativity between the two tests (95.2%, κ=0.91, p<0.001). The individual IFN-γ response values between the two assays did not perfectly match, however, there was a very strong positive correlation between the IFN-γ values of the two tests (r=0.91, p<0.001) (Fig. 2). The diagnostic accuracy of the ichroma™ IGRA-TB test suggests that it may be useful to identify LTBI in clinical settings.
DISCUSSION
In this study, we assessed the feasibility of the newly developed ichroma™ IGRA-TB POC platform for diagnosis of LTBI in healthy subjects and in TB patients. The ichroma™ IGRA-TB test exhibited diagnostic value in identifying M. tb infection, and the assay procedure was much simpler with a small cartridge and faster than QFT-GIT IFN-γ ELISA (total incubation time: 15 minutes vs. 150 minutes). The test performance was evaluated by assessing concordance of differences between the tests,17 and comparative analysis revealed excellent agreement and a very strong positive correlation in IFN-γ performance.
The quantitative IFN-γ response values measured by the ichroma™ IGRA-TB cartridge were relatively lower than those measured by the QFT-GIT test. However, the individual responses of positivity and negativity were well matched between the two tests, with the exception of three subjects who showed weak positive responses below 1.0 IU/mL by the QFT-GIT test. In this study, all differences in positivity between the two tests were observed near cut-off points below 1.0 IU/mL. The three individuals showed negative IFN-γ responses with the ichroma™ IGRA-TB cartridge in contrast to the QFT-GIT IFN-γ ELISA (0.42–0.97 IU/mL). Several lines of evidence showed variability in diagnostic outcomes near the cut-off point in QFT-GIT tests, and retesting has been recommended for subjects whose IFN-γ values are in a borderline range (0.20–0.99 IU/mL).1819 A recent study in South Africa has shown that both conversions and reversions in IGRA test responses can be detected, and such repeated testing has also suggested that the current cut-off for IGRA-positivity in the QFT-GIT test may be too low.20 Raising the cut-off value to >1.0 IU/mL in confirmatory serial QFT-GIT tests reduced the percentage of false positives in healthcare workers in low-incidence settings.21 These reports indicate that weak positive responses below 1.0 IU/mL by the QFT-GIT test may cause an error in interpretation of the outcome, which necessitates further testing to confirm false positive or true negative responses. In this study, we could retest the initial outcomes in three of the five subjects with weak positivity (<1.0 IU/mL) by the QFT-GIT, and observed that the positive IFN-γ responses (0.66 and 0.42 IU/mL) were changed to negative results (0.13 and 0.11 IU/mL, respectively) in two of the subjects. This tells us that the outcome of the QFT-GIT test at below 1.0 IU/mL is unstable to determine positive predictive values, which might cause a discrepancy in positivity between the two tests in our study. A cut-off point for LTBI by the current QFT-GIT test should be adjusted in future studies.
South Korea is an upper middle-income country with an intermediate TB burden, and screening for LTBI has primarily been performed in high-risk groups, including close TB contacts, students, military personnel, and immunosuppressed patients, based on the TST and QFT-GIT test. The IGRA is considered a better indicator for identifying LTBI than the TST in South Korea, where BCG vaccination is mandatory in infancy. A prospective study performed from 2004 to 2005 suggests a higher specificity of the IGRA for identifying LTBI, compared with the TST.22 Approximately 51% of individuals without risk of M. tb infection showed positive responses to the TST (>10 mm induration cutoff), whereas 4% of healthy subjects were positive by IGRA. For recent contacts, positive responses were observed in 60–71% by the TST, while fewer subjects (10–44%) were IGRA positive. Another study, carried out from 2010 to 2014, showed that the QFT-GIT test was superior to the TST at ages younger than 30, although neither the TST nor the QFT-GIT could differentiate LTBI between healthy controls and contacts due to the high prevalence of LTBI.23 A higher sensitivity of the IGRA was also found in immunocompromised patients, compared with the TST,24 and no significant changes in IFN-γ release were observed in children.25 These reports suggest the usefulness of an IGRA for those with impaired immune systems, as well as for healthy subjects with LTBI, in South Korea.
One challenging issue for developing TB diagnostics in resource-limited settings is convenience with reduced infrastructure and technical skills. The ichroma™ IGRA-TB used in this study is a new diagnostic POC platform that contains a set of detection antibodies, buffer, a small cartridge containing a nitrocellulose membrane, and a mobile instrument for reading (ichroma™ II). The incubation time for samples and detection antibodies is 15 minutes, and the test may be completed within a total of 20 minutes. It is therefore less time-consuming compared to the QFT-GIT IFN-γ ELISA, and a professional expert or fully equipped laboratory is not required for the test. Moreover, data from our study demonstrated the diagnostic accuracy for the ichroma™ IGRA-TB based on comparison with the commercially used QFT-GIT test. Excluding the three individuals with weak positivity by the QFT-GIT test, the ichroma™ IGRA-TB and QFT-GIT tests showed 100% agreement in positivity and negativity rates based on the same interpretation of the outcome. These findings suggest that ichroma™ IGRA-TB may be a feasible POCT for identifying LTBI and might aid in TST interpretation in areas that lack clinical and laboratory materials.
Our study limitation is that there were a few patients identified at diagnosis during our study period although we focused on testing TB latency in healthy controls, including those with known TB contact. Thus, additional comparative studies considering the state of M. tb infection (latent vs. active, culture confirmed TB vs. non-TB) will be followed by a long-term study with a larger sample size. Although the excellent agreement of the results was proven between the alternative tests, the sensitivity and specificity of the ichroma™ IGRA-TB should be further confirmed by its own cut-off value in a cohort including positive and negative controls of M. tb infection.
In conclusion, the strong correlation and agreement in IFN-γ performance between the ichroma™ IGRA-TB and QFT-GIT tests suggest that the ichroma™ POC platform could be a promising application of the IGRA in clinical settings. In particular, the ichroma™ IGRA-TB is advantageous over the QFT-GIT for its speed, convenience, and cost-effectiveness. Therefore, it may be reasonably used for LTBI diagnostics as a confirmatory test for TSTs in regions where laboratory supplies are restricted.
 XML Download