

 PDF
PDF ePub
ePub Citation
 Print
Print


INTRODUCTION
METHODS
Study population and samples
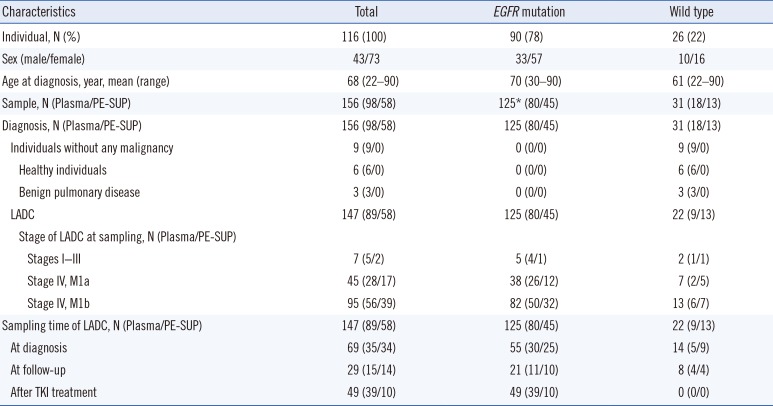
Table 1
Characteristics of the 156 clinical samples from 116 individuals, including 107 LADC patients
![]()
DNA extraction
Detection and semi-quantification of EGFR mutations
Definition of overall/sample-specific data and modified approach for reference genotypes
Statistical analysis
RESULTS
Comparison of kits using clinical samples
Accuracy, sensitivity, specificity, and concordance
Table 2
Comparison of EGFR mutation presence/absence rates between the two assay kits in 156 clinical samples
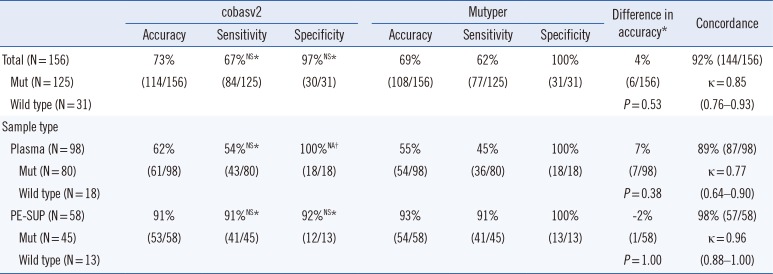
*Comparison between cobasv2 and Mutyper; †The value was not available as Fisher's exact test can be performed on only a 2×2 table (100% of specificities in both groups imply that an entire column or row of cells in the table contain zeros).
Abbreviations: EGFR, epidermal growth factor receptor; cobasv2, cobas EGFR Mutation Test v2; Mutyper, PANAMutyper-R-EGFR; Mut, mutation; NS, not significant; NA, not available; PE-SUP, pleural effusion supernatant.
![]()
Detection rates for paired liquid samples
Table 3
Comparison of EGFR mutation presence/absence rates between plasma and PE-SUP using 31 paired clinical samples
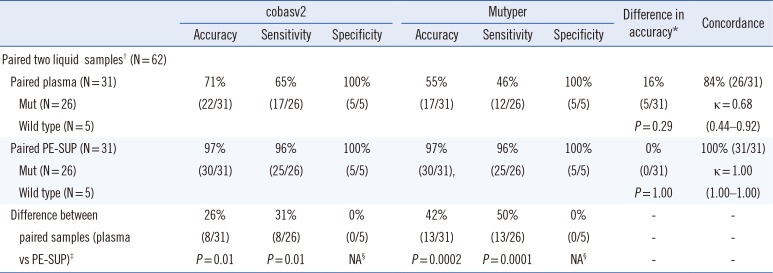
*Comparison between cobasv2 and Mutyper; †Paired plasma and PE-SUP samples collected on the same day from the same patient; ‡Comparison between plasma and PE-SUP samples; §The value was not available as Fisher's exact test can only be performed on a 2×2 table (100% of specificities in both groups imply that an entire column or row cells in the table contain zeros).
Abbreviations: EGFR, epidermal growth factor receptor; PE-SUP, pleural effusion supernatant; cobasv2, cobas EGFR Mutation Test v2; Mutyper, PANAMutyper-R-EGFR; Mut, mutation; NA, not available.
![]()
Comparison of kits according to EGFR-mutant genotype
Table 4
Comparison of the two assay kits for 156 clinical samples according to mutant genotype
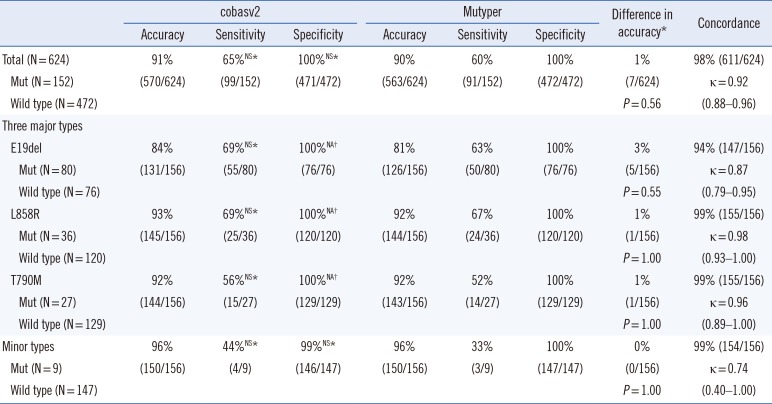
*Comparison between cobasv2 and Mutyper; †The value was not available as Fisher's exact test can be performed on only a 2×2 table (100% of specificities in both groups imply that an entire column or row cells in the table contain zeros).
Abbreviations: cobasv2, cobas EGFR Mutation Test v2; Mutyper, PANAMutyper-R-EGFR; Mut, mutation; NS, not significant (P>0.05); E19del, an in-frame deletion in exon 19; NA, not available; L858R, p.Leu858Arg mutation; T790M, p.Thr790Met mutation.
![]()
Comparison of kits using SDC samples
Sensitivity based on EGFR-mutant abundance
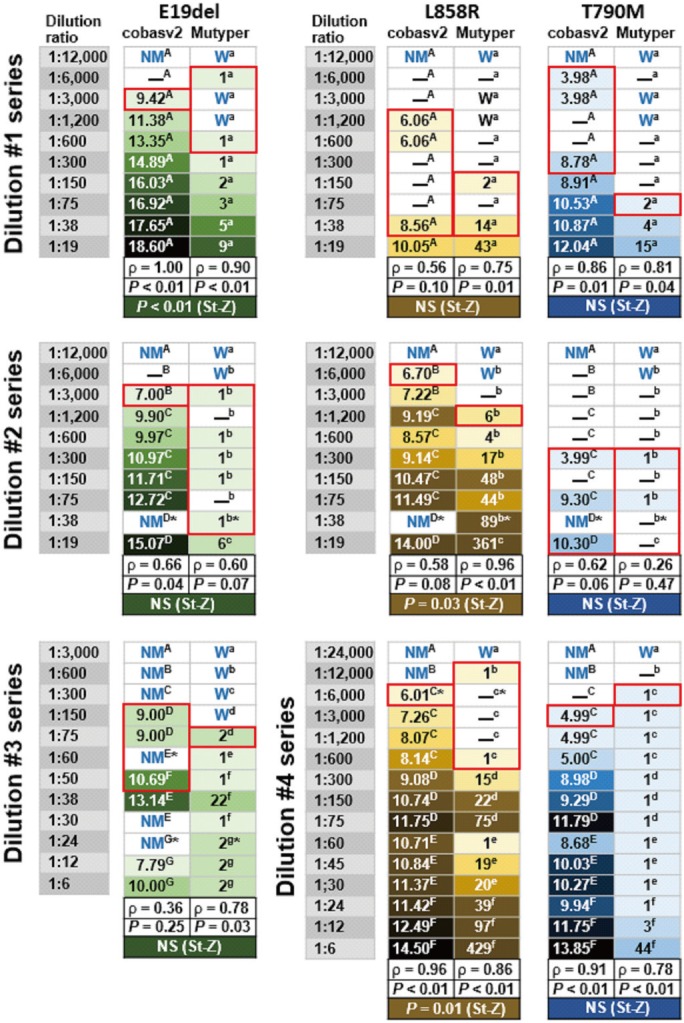
Fig. 1
Mutation detection and semi-quantification using two plasma EGFR mutation assay kits with 47 serially diluted contrived samples. The numbers in the green-, yellow-, and blue-tinged boxes indicate the SQIs of the mutation-detected samples and the color tone indicates the SQI rank (light tones indicate lower SQIs and dark tones indicate higher SQIs). The en dash (–) in each white-colored box (except for the en dash indicating EGFR-mutant genotype) indicates that at least one of the EGFR mutations was detected in the corresponding sample using the corresponding plasma assay kits. NM (no mutation detected by cobasv2 analysis) or W (wild type by Mutyper analysis) written in blue in each white box indicates that no EGFR mutations were detected in the corresponding samples. The red-bordered boxes indicate the predicted limit of detection values of the two kits for the three major EGFR-mutant genotypes. The same upper-case or lower-case superscript letter in each dilution series box indicates the same batch analysis. The asterisk in each box indicates that the same mutant was observed following replicate analysis using the remaining aliquots of the extracted DNA samples. The correlation coefficients (ρ) between the dilution effect and SQI rank and P written in black were obtained using Spearman's rank correlation analysis. P or not significant (NS; P>0.05) written in white was obtained using Steiger's Z-test (St-Z), which served to calculate the difference between the two correlation coefficients (cobasv2-ρ vs Mutyper-ρ).
![]()
Table 5
Comparison of the two assay kits using 47 serially diluted contrived samples according to mutant genotype
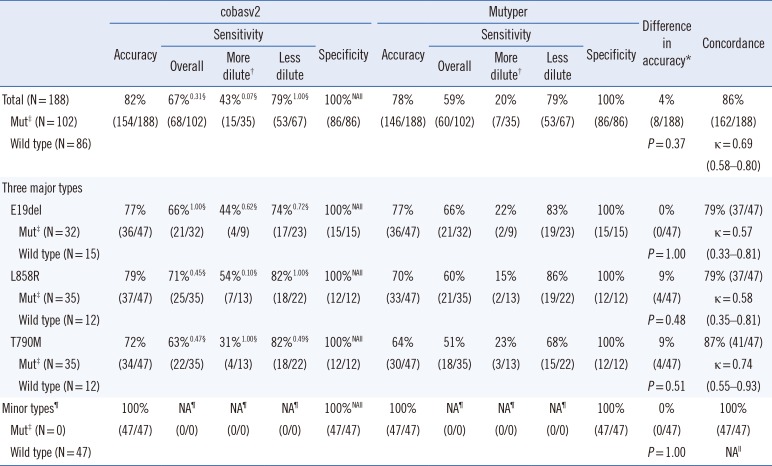
*Comparison between cobasv2 and Mutyper; †The dilution ratios of samples were ≥1:1,000; ‡Status was defined as the EGFR-mutant genotypes of four stock solutions; §Superscript numbers indicate P from the comparison between cobasv2 and Mutyper; llThe value was not available as Fisher's exact test or κ calculation can be performed on only a 2×2 table (100% of specificities or accuracies in both groups imply that an entire column or row of cells in the table contain zeros and all negative results in both groups indicate an insufficient number of categories to calculate the κ value); ¶None of the 47 serially diluted samples contained any minor types of EGFR-mutants.
Abbreviations: cobasv2, cobas EGFR Mutation Test v2; Mutyper, PANAMutyper-R-EGFR; Mut, mutation; NA, not available; E19del, an in-frame deletion in exon 19; L858R, p.Leu858Arg mutation; T790M, p.Thr790Met mutation.
![]()
 XML Download