

 PDF
PDF ePub
ePub Citation
 Print
Print


INTRODUCTION
In the past few years, great achievements were gained especially in prosthetic dentistry regarding computer-aided design (CAD) / computer-aided manufacturing (CAM) technology. Currently, various esthetic CAD/CAM restorative materials including ceramic-, polymer-, or resin-based materials are available.1 The milling process of CAD/CAM restorations does not create a smooth surface ready for cementation.2 To create a smooth and biocompatible surface of the restoration, ceramic materials such as lithium disilicate glass ceramics, leucite-reinforced glass ceramics, feldspathic glass ceramics, aluminum-oxide, and yttrium tetragonal zirconia polycrystals require additional processing after milling, necessitating specialized equipment for sintering or firing and glazing.3 On the other hand, resin composite materials do not necessarily require those steps and can generally be finished with a readily available armamentarium in the dental office.4 Clinically, the insertion of the prosthesis requires verification and adjustment of the occlusion. In this context, subsequent polishing should be done following these adjustments for a long-term success.4
Although numerous advantages of resin-based materials, some disadvantages such as water absorption (WSP) and solubility (WSO) were previously reported. Water molecules, smaller than the interchain space in the resin, might diffuse through resin structure.5 The water uptake by the resin structure could cause filler-matrix debonding or even filler degradation.6 As a result, mechanical properties of the restorative material may be compromised.7 Therefore, WSP might play an important role in long-term stability of resin based CAD/CAM materials in an aqueous environment such as in the oral cavity.8
The physical degradation evidenced by material loss or uptake as a result of sorption, dissolution, and extraction, accompanied by material softening, stress cracking, and fatigue fracture have been extensively studied in dentistry.9 The hydrolytic degradation may cause dissolving or leaching out of unreacted monomers or fillers.10 The release of these components may influence not only the aesthetic aspect of the restoration, but also the clinical performance5 and the biocompatibility of the material.11 As one of the most important properties is the material hardness, which correlates well to compressive strength and abrasion resistance of resin based CAD/CAM materials,12 evaluation of WSP, WSO, and microhardness characteristics of current resinbased CAD/CAM materials become an important clinical issue especially after different polishing applications.
Therefore, the purpose of this study was to determine the WSP, WSO, and microhardness of different resin-based CAD/CAM materials and to evaluate the effect of different surface finishing and polishing procedures on these properties. The major null hypotheses were threefold: 1. There would be no difference in WSP and WSO properties of the tested materials; 2. Surface finishing and polishing procedures would not affect WSP and WSO properties of the tested CAD/CAM materials. 3. Surface microhardness of the tested CAD/CAM materials would not differ following finishing and polishing procedures.
MATERIALS AND METHODS
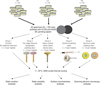
Schematic study design is presented in Fig. 1. Fifty disc shaped specimens (Ø = 10 mm, h = 1.5 mm) of each of the three CAD/CAM materials were prepared (N = 150). Tested materials, group codes, and their compositions are given in Table 1. Each specimen was polished with metallographic SiC papers (FEPA-P #1200 and 4000) in order to achieve a similar degree of surface roughness in all specimens at the baseline under water cooling. Then the specimens were divided into 5 subgroups according to the applied polishing procedure (n = 10 per group).
One experienced operator carried out the finishing and polishing sequences simulating clinical procedures in accordance with the manufacturer's instructions for rpm and pressure. The same straight hand-piece and electric motor was used to control the rpm setting for each step.2
In this study, the specimens in Group I presented the control and no additional treatment was applied. Other groups received the following polishing procedures. The specimens in Group II were polished with diamond impregnated two-stage spiral polishing system (EVE Diacomp Plus Twist, EVE Ernst Vetter GmbH; Pforzheim, Germany). Pink and grey polishing wheels were sequentially applied in a mounted low speed handpiece under 10,000 rpm speed and light pressure for 15 seconds. In Group III, polishing was done with yellow colored rubber-based silicon abrasives (Polydentia, Polydentia SA, Mezzovico, Switzerland) using a low-speed handpiece with light pressure rotating at approximately 10,000 rpm for 15 seconds. The specimens in Group IV received final polishing by using diamond polishing paste (Diapolisher Paste, GC Dental Products Europe, Leuven, Belgium), goat-hair brushes and cotton buffs (Renfert GmbH, Hilzingen, Germany) in a mounted low speed handpiece (Kavo Duratec 2068, Biberahc/Riss, Germany) on the specimen surface at 10,000 rpm speed and light pressure for 15 seconds. Finally, the specimens in Group V were sequentially polished with aluminum oxide abrasive discs (Sof-Lex XT Pop on, 3M ESPE, St. Paul, MN, USA), light orange (Fine - 24 µm) to yellow (Superfine - 8 µm) in a mounted low speed handpiece under light pressure for 15 seconds.
Polishing procedures selected for this study was applied on the top surface of each specimen and the specimens were rinsed with running water after each polishing step. All of the abrasives (abrasive papers, abrasive discs, rubbers, wheels and brushes) were discarded after every four specimens. The final thickness (± 0.01 mm) was measured with a digital caliper (Mitutoyo Corp, Kanogawa, Japan). The specimens were ultrasonically cleaned (Quantrex 90, L&R Ultrasonics, Kearny, NJ, USA) for 10 min in deionized water in sequence and allowed to air dry for 24 hours at room temperature before testing. Thereafter, all of the specimens were submitted to thermocycling for 5000 cycles in a 5 – 55℃ water bath with a dwell time of 30 seconds and a transfer time of 5 seconds.
Water absorption (WSP) and solubility (WSO) were calculated in µg/mm3 in accordance with ISO 4049:200913, for 24 hours, 7 days, and 30 days of water immersion time. The specimens were stored in a desiccator maintained at 37 ± 1℃. After 22 hours, specimens were removed and stored in a second desiccator maintained at 25 ± 1℃ for 2 hours and weighed in a digital balance (Precisa XB 220A, Precisa Instruments AG, Dietikon, Switzerland). This desiccation cycle was repeated until a constant mass (m1) was obtained. Following final drying, the diameter and height of each specimen were measured to calculate the volume.
After the initial desiccation procedure, specimens were immersed in 20 mL distilled water in glass containers and remained there at 37℃ ± 1℃ for 24 hours, 7 days, or 30 days. Then, the discs were removed and washed with water. Thereafter, they were gently dried with absorbent paper and weighed again to obtain m2. Finally, the specimens were reconditioned to constant dry mass (m3) in the desiccators using the cycle described above.
WSP and WSO were calculated by using the following equations provided by ISO 4049:2009 standard13:

where m2 is the mass of the specimen after the period of immersion in water for 24 hours, 7 days, or 30 days; m3 is the final mass after drying the specimen; and V is the initial volume of the specimen.

where m1 is the mass obtained after the initial drying and before the immersion in water of the specimen; m3 is the final mass of the specimen, and V is the initial volume of the specimen.
For the surface microhardness measurements, a Vickers microhardness tester with microscopic lens (Shimadzu HMV; Shimadzu Corporation, Tokyo, Japan) with a 200 g of load and 10-s dwell time. Five indentations were taken on the polished surface of each specimen and averaged to determine the hardness value of each specimen at the following time periods: before water immersion, after 24 hours, after 7 days, and after 30 days.
Vicker's hardness values were converted into microhardness values by the machine. All measurements were performed by the same operator in the laboratory conditions.
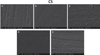
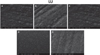
Two specimens from each polishing group from each tested CAD/CAM material were selected for scanning electron microscopy (SEM) analyses. The specimens were gold-coated with a high-vacuum metal sputter coater (EMS 550X, Electron Microscopy Sciences, Hatfield, PA, USA). Then, SEM analyses were performed with Zeiss Evo 50 analytic microscope (Carl Zeiss, Oberkochen, Germany). The images were taken with × 4000 magnification.
Two datasets for the statistical analyses of WSP, WSO, and microhardness values were created for statistical analyses. Shapiro-Wilk test was applied to each dataset for the evaluation of the normal distribution of variables. Then, Levene test was used for testing the homogeneity of variances. Data were analyzed using statistical software SPSS version 16 (Statistical Package for Social Science, SPSS, Chicago, IL, USA). Two-way Analysis of Variance (ANOVA) taking such following factors as CAD/CAM materials (3 levels - LU, CS, VE) and polishing methods (5 levels, Group I, Group II, Group III, Group IV, and Group V) was applied since the pooled data of WSP and WSO were distributed normally. Additionally, post hoc Tukey's tests were performed when the effect of the main factors or the interaction reached significance.
The statistical differences in microhardness data among tested materials and polishing procedures were compared by Kruskal-Wallis tests. Further, when the P value from Kruskal-Wallis test statistics are statistically significant among the groups, Mann-Whitney U tests were conducted for multiple pairwise comparisons.
The results of statistical analyses with P-values less than .05 were interpreted as statistically significant. But, for all possible multiple comparison tests, Bonferroni Adjustment was applied to control Type I error.
RESULTS
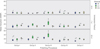
According to the statistical analysis, CAD/CAM materials exhibited different WSP values (P < .05; Fig. 2). The order of overall WSP values amongst the tested materials were as follows: LU (15.02 µg/mm3) > CS (11.62 µg/mm3) > VE (9.96 µg/mm3).
Additionally, surface finishing and polishing procedures tested in this study significantly affected the WSP of the materials (P < .05). The specimens in Group III (polished with yellow colored rubber-based silicon abrasives) had the highest WSP values whereas the specimens in Group IV (polished with diamond polishing paste) had the lowest. Furthermore, immersion period had significant effect on WSP values. Statistical analysis exhibited that the highest WSP results were obtained in the 30 days storage, while 24 hours results were the lowest.
Statistically significant differences were also found when two-factor interactions between CAD/CAM materials and polishing procedures (P < .05) and CAD/CAM materials and immersion periods (P < .05) were evaluated.
Box-plot diagram of WSO values of the tested materials were given in Fig 3. The tested materials demonstrated significantly different WSO according to the statistical analysis (P < .05). When overall WSO values are evaluated, the materials were ranked as: LU (12.7 µg/mm3) > CS (7.2 µg/mm3) > VE (3.87 µg/mm3).
Besides, surface finishing and polishing procedures had statistically significant effect on the WSO results (P < .05). The order of WSO values respective to the polishing procedures were as follows: Group III (polishing with yellow colored rubber-based silicon abrasives) > Group II (polishing with diamond impregnated two-stage spiral polishing system) ≥ Group IV (polishing with diamond polishing paste) ≥ Group I (polishing with #1200 and #4000 grit SiC grinding papers) ≥ Group V (polishing with aluminum oxide abrasive discs).
Furthermore, WSO data were significantly affected by immersion periods (P < .05). Statistical analysis showed that the highest WSO values were observed after 24 hours period (9.12 µg/mm3), whereas the lowest values were seen after 30 days (6.87 µg/mm3).
Each material represented heterogeneous hardness level. According to the statistical analyses, independent from the finishing and polishing procedures, the ranking amongst the materials were as follows: VE > LU > CS (X2 = 154.928; P < .001). Besides, significant differences were found amongst the finishing and polishing procedures (X2 = 13.448; P < .05). The specimens in Group IV (polished with diamond polishing paste) had the highest surface microhardness results whereas other groups had similar values (P < .01). Additionally, non-significant differences were observed amongst the measurement periods (P > .05). Inter-group comparisons revealed that the diamond impregnated two-stage spiral polishing system yielded the highest surface microhardness values for CS and VE when the multiple effects of materials and finishing and polishing procedures were taken into consideration (P < .001).
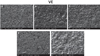
SEM results clearly demonstrated the influenced surface morphology created by the tested polishing procedures when compared to baseline. Fig. 4, Fig. 5, and Fig. 6 show the representative SEM images of the specimen's baseline surfaces of tested materials and of the tested polishing groups. CS had smooth surface textures with uniformly dispersed small particles (Fig. 4A). LU revealed larger cluster filler particles protruding from the surrounding surface (Fig. 5A). VE displayed brighter areas that belong to the ceramic network and darker parts that demonstrate the continuous polymer network (Fig. 6A). Polishing with diamond polishing paste resulted in the most regular and smoothest surfaces for all of tested materials (Fig. 4D, 5D, and 6D). Control (Fig. 4A, 5A, and 6A) and aluminum oxide abrasive (Fig. 4E, 5E, and 6E) groups followed this group. These groups showed small scratch lines and large areas of smooth surfaces. Conversely, the tested materials treated with diamond impregnated two-stage spiral polishing system (Fig. 4B, 5B, and 6B) and yellow colored rubber-based silicon abrasives (Fig. 4C, 5C, and 6C) presented deep grooves, diffuse irregularities, and the absence of smooth areas.
DISCUSSION
In the current study, the effect of different surface finishing and polishing techniques on WSP, WSO, and surface microhardness properties of three polymer based CAD/CAM materials were evaluated. Thermocycling was applied to all specimens in distilled water before the evaluations to imitate the natural oral environment during drinking and eating. Since the finding of this study exhibited WSP and WSO parameters were dependent on the tested CAD/CAM materials, the first hypothesis had to be rejected. Our results demonstrated WSP and WSO rates of LU significantly higher than those of CS and VE. Moreover, CS had significantly higher WSP and WSO than VE. These results could be attributed to water absorption properties of monomers.14 All of the tested materials consist of hydrophobic urethane dimethacrylate (UDMA) and hydrophilic triethylene glycol dimethacrylate (TEGDMA).15 TEGDMA exhibits higher water absorption and therefore permits water to penetrate into the resin matrix.16 However, WSP and WSO results of LU were the highest. LU contains Bis-GMA, distinct from VE and CS. Previous studies have shown that the water absorption potential of Bis-GMA was higher than those of UDMA, TEGDMA, and Bis-EMA.14 Therefore, the Bis-GMA monomer may be responsible for high values of WSP and WSO for LU.
In addition to the matrix composition, size of the fillers and filler content of the tested materials could be the reasons of their WSP and WSO behaviors. Alshali et al.5 have shown that filler loading and hydrophilicity of the resin matrix affected WSP and WSO properties of resin-composites. According to our results, the lowest WSP and WSO values were found for the polymer infiltrated network material, which has the highest filler content (86%). Similar to our findings, Fleming et al.17 have reported that the increased filler content would result in the reduced water absorption and water solubility values of resin based composite materials. In this context, our results support the concept that water absorption generally increases with higher amounts of resin matrix and a lower amount of filler particles.18
In this study, two nano-hybrid filled resin matrix ceramics (CS and LU) and a polymer infiltrated ceramic (VE) were selected. These materials have different crystalline structures: CS is a high-density composite material contains 29 wt% polymeric network with 71% silica and barium glass particles, LU combines aggregated zirconia and silica clusters and has no glass particles available for etching, whereas VE is composed of a dual network structure (ceramic and polymer) being 86% feldspathic porcelain by weight. As confirmed in this study, polymer infiltrated ceramic CAD/CAM material showed the lowest WSP and WSO rates, which may be related to its higher and more solid mechanical properties.7 In addition, the microstructural arrangement of the fillers was shown to play an important role in the mechanical behavior of the resin based dental materials.19 Therefore, based on our results, one could assume that compositional differences between the CAD/CAM materials tested significantly influenced the WSP and WSO results.
Not surprisingly, increased WSO rates were observed in longer immersion periods, which are corroborated by the composite resin results from previous studies.518 Liebermann et al.18 have indicated that the most obvious changes in the mechanical and physical properties of polymers could be expected within the first 30 days of immersion periods. Moreover the authors implied that 1, 7, 14, and 28 day immersion periods showed distinct hardness changes of the materials.18 Therefore, significantly different WSP and WSO results of immersion periods of the current study are in accordance with the previous findings.18
In a recent study by Egilmez et al.,7 3 weeks water storage, boiling in water, thermocycling (5000 times, 5 – 55 ℃) and autoclave treatment (134℃, 200 kPa, 12 hours, in distilled water) were shown to decrease the flexural strengths of CS and LU. Conversely, these aging methods had no effect on the flexural strengths of VE. Additionally, Takeshige et al.20 demonstrated the retardation of crack propagation in composite structured dental materials under aqueous environments. The authors explained their findings by the presence of water in the resin matrix, which might inhibit crack propagation as resulting plasticization of the resin blunts the crack-tip and reduces the stress concentration and dissipates the crack. Despite this toughening mechanism, long-term deterioration of composites due to water absorption was also confirmed. Therefore, fatigue cracks in composites are less likely to be initiated under aqueous environments, but will rapidly propagate after initiation. From this point of view, polymer infiltrated ceramic CAD/CAM material, which exhibited the least WSO, could be assumed as the more resistant material than the other tested resin based CAD/CAM materials in this study. This assumption may also be supported by a previous study.7
The WSP and WSO of tested materials in this study are in the limits of ISO Specification 404913 and ADA Specification No. 2721 (water absorption < 50 µg/mm3, solubility < 7.5 µg/mm3). However, WSP and WSO can cause molecular instabilities, which may lead to crack formations and a decrease in mechanical properties as already mentioned.7 Furthermore, water absorption not only affects physical and mechanical properties, especially of composite resins, but also decreases surface hardness and the elastic modulus.18
According to the current results, finishing and polishing instruments had a significant effect on WSP and WSO values of the tested materials. Therefore, the second hypothesis of this study was rejected. Effective polishing of resin based dental materials could be obtained when an abrasive removed the matrix resin as well as cut the relatively harder filler particles.22 Aluminum oxide discs were reported to be one of the most suitable polishing instruments for composite surfaces.23 However, the tested CAD/CAM material surfaces with Sof-Lex discs presented the dislodged particles, resin removal, and scratches (Fig. 4C, 5C, and 6C) in this study. In a recent study by Aytac et al.,24 similar findings were obtained in microhybrid and nanohybrid composite resin surfaces with Sof-Lex discs.
On the other hand, yellow colored rubber-based silicon abrasives caused the highest WSP and WSO results. SEM images of this group presented irregular surfaces with deep scratches. Therefore, it can be concluded that the surface quality of the CAD/CAM material may be the reason of the different absorption and solubility results. In accordance with our study, in a previous study, rubber-based silicon abrasives have been shown to cause rougher surfaces than finishing and polishing discs.25
In the current study, polishing with diamond polishing paste resulted in the most regular and smoothest surfaces for all of the tested materials according to SEM images. Accordingly, the lowest WSP results were obtained in diamond polishing paste applied groups. Previous studies have reported that polishing systems with diamond abrasive particles or diamond polishing pastes created the smoothest restoration surfaces.26 Considering the significant interaction between the CAD/CAM materials and polishing procedures, final polishing by using diamond polishing paste can be recommended for all CAD/CAM materials.
According to our results, surface microhardness did not differ amongst the measurement periods. Conversely, CS and LU specimens are found to be softer than VE specimens. Moreover, the significant interaction between the CAD/CAM materials and polishing procedures led us to reject the third hypothesis. In the current results, diamond impregnated two-stage spiral polishing system yielded higher surface microhardness values than other tested polishing procedures for CS and VE materials. Lower values of the other tested polishing procedures might be explained by the thermal insults produced with rotary instruments during finishing procedures.23 In addition, temperature fluctuations by applied thermocycling could increase generated thermal stresses and lead to microcracks in the polymer structure or failures at the polymer/filler interface.27 Moreover, water exposure might result in autocatalytic surface degradation of the material or water absorption of the polymer matrix,27 which might explain the progression of surface softening.7
A limited investigation has been done with this study for the evaluation of different finishing and polishing procedures on WSP, WSO, and surface microhardness of polymer based CAD/CAM materials. One of the limitations of this study is the flat surfaces of the specimens. In clinical conditions, restorations have an irregular shape with convex and concave surfaces, and the efficiency of surface polishing procedures may be different under clinical circumstances. In addition, this study was performed in vitro, so the effect of oral environment was neglected. Thus, the results may not be directly comparable to the clinical situation. In addition to the methodological limitations, different biological conditions such as occlusal loads, changes in pH levels in the oral environment, the presence of saliva or bacterial adhesion to the restoration surfaces should also be investigated. Therefore, future studies are required.
CONCLUSION
Within the limitations of this study, water absorption and water solubility properties of the tested CAD/CAM materials were different. LU demonstrated the highest water absorption and water solubility results in the tested polymer-based CAD/CAM materials. In addition, surface finishing and polishing procedures tested in this study significantly affected the water absorption of the materials. The specimens polished with yellow colored rubber-based silicon abrasives had the highest water absorption results whereas the specimens polished with diamond polishing paste had the lowest ones. Furthermore, each material represented heterogeneous hardness level. Diamond impregnated two-stage spiral polishing system yielded the highest surface microhardness values for CS and VE.

 XML Download