

 PDF
PDF Citation
 Print
Print


INTRODUCTION
Aquatic exercise is one of the most common rehabilitation therapies. Since buoyancy of water decreases compressive weight-bearing stress on the joints and allows functional exercise (1), it has been known to be an effective treatment modality for rehabilitation of various patients, especially with musculoskeletal conditions (23). Although many diseases, including cancer, infection, and rheumatoid arthritis, as well as musculoskeletal disorders, are closely related to the immune system, the relationship between the environment of aquatic exercise and the immune system has not been fully elucidated to date (4). Currently, the water temperature of a swimming pool varies depending on the type and object of exercise; however, it is generally operated between 28°C–31°C. To the best of our knowledge, there is a lack of scientific evidence on the effects of water temperature of swimming pools on the immune system.
Studies on the relationship between the immune system and ambient temperature have progressed in both mice and humans (56789). According to an animal model study, healthy mice prefer ambient temperatures of 30°C–31°C (termed thermoneutral temperature;TT), at which their basal metabolism is sufficient to maintain body temperature (BT) (1011). However, at the subthermoneutral temperature, the mouse is under cold stress, which induces a systemic sympathetic response, including adaptive metabolic changes and secretion of catecholamines (12). These changes induce a high energy-dependent process, known as adaptive thermogenesis, for maintaining normal BT (12). Both human and animal studies have demonstrated that cold exposure induces changes in the cellular and humoral immune responses; however, this finding remains controversial. While it has been reported that cold exposure may reduce the number and cytotoxic activity of NK cells with a decrease of lymphocyte proliferation (1314), other studies have shown that a brief whole-body exposure to cold water may increase both the number and activity of NK and CD8+ T cells (7151617). These conflicting reports may be due to the various protocols in administering cold stress, as well as the lack of advanced techniques in performing immunological analyses. In fact, the temperature and exposure times used in previous studies were severely subnormal at 1°C–4°C and various, respectively. Since animals exposed to unaccustomed conditions may be affected by psychological stress, one of the other stresses induced by cold exposure, it would be difficult to clearly understand the effects of temperature on the immune cells and their response.
The changes of BT caused by ambient temperature may have an effect on the immune system. However, there have been few studies evaluating the relationship between immune function and water temperature of swimming pools in the field of actual aquatic exercise (29°C). We used an animal cancer model to compare the changes of immune function at body-temperature (37°C) and thermoneutral-temperature (29°C) water. Mice moderately exercised at each temperature for 30 minutes every day for 3 wk, and the anti-tumor immune response, survival rate, and immune cell activity were analyzed. This study confirmed not only the effect of aquatic exercise, but also the change of immune response according to water temperature. Although the effects of water temperature on immune function should be verified through human experiments, the results of this study, which suggest that water temperature is considered as a key factor for immune function, can be extended to humans since human and mouse genes are identical by more than 90%.
MATERIALS AND METHODS
Animals
C57BL/6 (B6) mice were obtained from Orient Bio (Sungnam, Korea). All animal experiments were approved (PNU-2017-1503) by and performed in accordance with the guidelines of Pusan National University Institutional Animal Care and Use Committee. All mice were housed in a specific pathogen-free animal facility at Pusan National University School of Medicine.
Design of aquatic exercise with tumor animal model
B16F10 melanoma cells (0.5×10⁶) were subcutaneously injected to 7-wk-old B6 mice (n=6 per group). Three days after injection, tumor bearing mice exercised in the water for 6 days a wk. Aquatic exercise was performed in a constant-temperature water bath (width×length×height; 50×30×22 cm) filled with water to a height of 6 cm and at 29°C or 36°C for 30 minutes. All mice were made to swim for 4 s at a speed of 10 cm/s with 4 s intervals between swims and backs of the mice were tapped with a soft brush at every 4 s to maintain the swimming intervals. This process was repeated for a total duration of 3 wk. The control mice were taken to the same facility and handled in the same way as the experimental animals.
Rectal temperature (via rectal thermistor inserted 1 cm past the anal sphincter) was measured continuously before and after the exercise. It was measured after the exercise on the last day of the week. Tumor diameters were measured with digital calipers, and the tumor volume in mm3 was calculated by the formula:
After the last exercise of each wk, mice were sacrificed to analyze the immune cells.
Flow cytometry analysis
In order to analyze immune cells and their anti-tumoral activity, B6 mice were challenged and swarm at TT and BT (n=9 per group) and then 3 mice of them were randomly sacrificed every wk. Primary cells were collected from lymph node (LN), draining lymph node (dLN), and spleen, and analyzed via FACS Canto II or FACS Aria I. Data were analyzed using FlowJo version 10 (TreeStar, San Carlos, CA, USA). Antibodies with the following specificities were used for staining: CD8α (53-6.7), IFNγ (XMG1.2), IL-4 (11B11), CD44 (IM7), CD62L (MEL-14), NK1.1 (PK136), TCRβ (H57-597), and γδTCR (GL3) from BioLegend (San Jose, CA, USA); CD4 (GK1.5) from Thermo Fisher Scientific (Waltham, MA, USA); and IL-17 (TC11-18H10) from BD Biosciences (San Jose, CA, USA). Anti-mouse CD16/32 (2.4G2; BioLegend) blocked the non-specific binding of the antibodies. For intracellular cytokine staining, the cells were stimulated with PMA (Merck Millipore, Burlington, MA, USA) and ionomycin (Santa Cruz, Dallas, TX, USA) in the presence of brefeldin A (Thermo Fisher Scientific), which were then fixed and permeabilized with an IC fixation buffer (Thermo Fisher Scientific).
Detection of soluble γc receptor
Murine blood was obtained by tail vein bleeding at the indicated times, and serum was collected by centrifuging for 1 h after standing at room temperature. Serum soluble γc (sγc) was detected in a sandwich ELISA with mouse γc-specific polyclonal antibodies (R&D Systems, Minneapolis, MN, USA) as the capture antibodies, and biotin-conjugated mouse γc-specific monoclonal antibodies (4G3; BD Biosciences) as the detection antibodies (18). Recombinant sγc protein was used as the positive control.
Statistical analysis
Statistical differences of each group were analyzed by the Student's 2-tailed t-test for comparisons between 2 groups and 1-way ANOVA for comparisons between more than two groups. All calculations were performed using GraphPad Prism software (ver. 5.0; San Diego, CA, USA). The p values of less than 0.05 were considered statistically significant.
RESULTS
Aquatic exercise at TT suppresses tumor growth
The cancer animal model was used to address the effect of water temperature during aquatic exercise. First, an aquatic exercise was performed on tumor bearing mice in TT water (29°C) and BT water (36°C) for 6 days a wk, at the same time and manner for a total duration of 3 wk (Fig. 1A). Mice were tapped with a soft brush to keep their movements unsettled for more than 4 s. The BT was measured as the representative physiological response after exercise at different temperatures. Rectal temperature of housing and BT-exercising mice was almost unchanged, while the mice exercising at TT was reduced by about 2 degrees to 34°C (Fig. 1B, right). This decrease was temporary, and the mice recovered normal BT after about 1 h. As a result of observing the kinetics of BT in the experimental period, the BT of all groups tended to be decreased with tumor growth; however, the degree of decrease was less in those receiving aquatic exercise (Fig. 1B, left). Interestingly, we observed that BT is not elevated in animals exercising even in BT water, indicating that the aquatic exercise is not strong enough to bring about changes in BT. The serum level of sγc, which is known to inhibit anti-tumor immune responses (19), decreases during tumor growth as part of its defense mechanism. The kinetics of sγc expression demonstrated are relatively late decline in housing mice compared with the exercise group (Fig. 1C). The rate of decline was significantly higher in the exercised mice in TT water compared with those in BT water. Next, we found that aquatic exercise in TT water remarkably inhibited tumor growth compared with that in housing or exercising mice in BT water (Fig. 1D). Moreover, this finding was confirmed by measuring the weight of tumor mass at the end of the experiment. As shown in the summary of multiple experiments, significant inhibition of tumor growth was observed (Fig. 1E). The result that tumor growth suppression was more significant in mice that exercised in TT water compared with BT water has important implications.
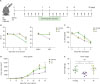 | Figure 1Control of tumor growth by aquatic exercise at TT. (A) Time schedule for aquatic exercise. Tumor-bearing mice were treated with 30 min of aquatic exercise at different temperatures (TT and BT) per day for 6 days or were housed as control (n=6 per group). Tumor growth was monitored every few days. (B) BT of mice. Mouse BT was determined by measurement of rectal temperature at the indicated day after tumor challenge (left), and measured before and after the aquatic exercise (right). (C) Serum sγc level was measured at the indicated weeks in aquatic exercising or housing tumor-bearing mice. Data are representative of three mice per group. (D) Tumor growth curve of the aquatic exercise group and housing group. Tumor-bearing mice started to exercise 3 days after the tumor challenge. Tumor volume was measured every few days. Tumor growth is representative of two independent experiments with each six mice per group. (E) Tumor weight was measured at the end of the experiment. The summary graph is representative of 2 independent experiments with each six mice per group. Error bars represent mean and SEM.NS, not significant.
**p<0.01, ***p<0.001.
|
Aquatic exercise at TT increases the number of effector cells
We found that aquatic exercise in TT water was effective in suppression of tumor growth. We then tested the number and distribution of immune cells that play a critical role in anti-tumor immune responses, and found that there was no significant difference in the total number of LN and dLN cells; however, the total number of splenocytes in the aquatic exercise group in TT water dramatically increased (Fig. 2A). When we analyzed the specific population in the increased number of splenocytes, the number of CD4+ T cells showed no significant change, while the number of CD8+ T cells, γδT cells, NKT and NK cells significantly increased in mice that exercised in TT water (Fig. 2B). Since effector/memory phenotype CD4+ and CD8+ T cells are defined by CD44 and CD62L expression, we examined the number of effector memory T cells with CD44 and CD62L markers and found that the number of effector memory CD8+ T cells statistically increased in mice that exercised in TT water (Fig. 2C). As the increased cell population is known to be pivotal in the anti-tumor immune response, its increase by aquatic exercise in TT water well correlated with the results of the observed tumor growth inhibition.
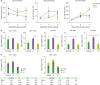 | Figure 2An increase of immune cellularity by aquatic exercise at TT. Tumor bearing mice had aquatic exercise (n=9 per group) and 3 mice were randomly sacrificed every wk after aquatic exercise. Immune cells were individually isolated from LN, dLN, and spleen of mice that underwent aquatic exercise. (A) The number of LN (left), dLN (middle), and spleen cells (right) in housing, TT and BT groups. These immune cells were isolated from exercising tumor-bearing mice for 3 wk. Data are representative for two independent experiments with three mice per group (B) The number of immune cells in the spleen after 3 wk. The bar graphs are representative for two independent experiments with three mice per group. (C) The number of indicated subsets among total spleen CD4+ (left) and CD8+ (right) T cells at 3 weeks. Each number in the table represents the average number of the cells (×106, p<0.05 for TT vs BT; mean and SEM).NS, not significant.
*p<0.05, ***p<0.001.
|
Aquatic exercise at TT enhances IFNγ production of CD8+ T cells
Next, we wondered about the qualitative changes along with an increase in the number of NK, γδT cells, NKT and CD8+ T cells involved in anti-tumor immune responses (2021222324). To address their anti-tumor activity, we stimulated LN, dLN, and spleen cells obtained from tumor-bearing mice and analyzed the cytokine production by intracellular staining. First, we examined differentiation of CD4+ T cells in each groups and found that the Th1, Th2, and Th17 differentiation of CD4+ T cells was not changed (Fig. 3A). We found that the frequency of IFNγ-producing CD8+ T cells of mice with aquatic exercise at TT for 3 wk significantly increased by 1.5-fold compared with the housing or BT-exercising group (Fig. 3B). The number of cells also increased by more than 3-fold (Fig. 3C). Since the majority of tumor-specific cytotoxic T cells migrate to dLN located around the tumor site, we confirmed whether the cytotoxic activity of dLN CD8+ T cells was enhanced in TT-exercising group. Consistent with the activity of CD8+ T cells in the spleen, TT-exercising group significantly increased the frequency of IFNγ+CD8+ T cells (Fig. 3D). Collectively, these data demonstrate that TT-aquatic exercise is effective in promoting the anti-tumor immune responses, implying that tumor rejection maybe induced by both quantitative and qualitative improvements of cytotoxic CD8+ T cells.
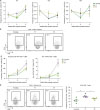 | Figure 3Enhancement of cytokine production by CD8+ T cells at TT. Tumor bearing mice had aquatic exercise (n=9 per group) and 3 mice were randomly sacrificed every wk after aquatic exercise. Splenocytes were isolated from housing and aquatic exercise (at TT and BT) groups of mice for 3 weeks and were stimulated for 4 h with PMA and ionomycin to assess for T cell functional activity. (A) Frequency of IFNγ-, IL-4- and IL-17-producing CD4+ T cells. Data are representative for 2 independent experiments with three mice per group. (B and C) IFNγ expression of CD8+ T cells in housing and aquatic exercise (at TT and BT) groups. The IFNγ profile is representative for 2 independent experiments with three mice per group. (C) Frequency (left) and number (right) of IFNγ+CD8+ T cells 3 wk after aquatic exercise. (D) dLN cells were isolated from housing and aquatic exercise (at BT and TT) groups of mice at 3 weeks. These cells were stimulated for 4 h with PMA and ionomycin and assessed for IFNγ expression by intracellular staining. The profile of IFNγ+CD8+ T cells in dLN (left), and a summary of frequencies (right). The IFNγ profile is representative for 2 independent experiments with three mice per group. Error bars represent mean and SEM.
*p<0.05, **p<0.01, ***p<0.001.
|
DISCUSSION
Aquatic exercise is one of the methods of hydrotherapy for managing many diseases. However, despite its wide applicability, there is a lack of scientific evidence about the impact of swimming pool temperature on the outcomes of underwater rehabilitation and its influence on the body, especially on the immune system. This study verifies the effects of using TT water during aquatic exercise on the immune function, particularly on an anti-tumor immune response. The observations reported in this study demonstrate that tumor growth control is significantly enhanced and a dramatic reduction of BT is prevented by aquatic exercising in TT water compared with BT water, even though the core BTs transiently decreased in the TT group. Not only are there more CD8+ T cells in tumor-bearing mice exercising in TT water than in BT water, these T cells exhibit increased IFNγ production and significantly more skewed effector memory phenotype. Therefore, since the immune function was affected by the water temperature during aquatic exercise, water temperature in human hydrotherapy or aquatic rehabilitation should be carefully considered depending on the type of disease.
It has been known that cold exposure induces the activation of thermogenesis via norepinephrine production, and these (1225) as well as other stress pathways are linked to immunosuppression (26). Indeed, previous studies have suggested that cold exposure may be associated with an increased risk of infection (1327). Animal research involving prolonged cold exposure or cold-water immersion demonstrated a reduction in lymphocyte proliferation and NK cell activity (142829). Conversely, a brief cold swim stress repeated for 8 days was reported to increase survival of mice infected with intracellular parasite Toxoplasma gondii (1516), a situation that is consistent with the enhancement of cellular immunity. Since the cold condition used in these studies was extremely artificial, which is not a typical situation that humans would encounter, and was administered with a number of various ways, the effect of water temperature and aquatic exercise on the immune system was unclear and remained difficult to apply to humans. Therefore, our study was designed to verify the effects of aquatic exercise in TT water that is currently being used in hydrotherapy. To address the effects of periodic and regular aquatic exercise in TT water compared with BT water, we examined the changes of immune function by periodically monitoring the tumor animal model. We showed that aquatic exercise in TT water may contribute to the improvement of immune function.
It is expected that the transient decrease of BT after aquatic exercise in TT water could induce cold stress, promoting tumor growth, since a recent study has shown that cold stress may reduce anti-tumor immune responses (8). Until 2 wk after initiation of the aquatic exercise, there was no difference in the number of immune cells and tumor growth in all groups. However, in 3 wk, tumor growth and the number of immune cells were significantly reduced and increased, respectively, in the TT group compared with the BT group, despite the cold stress in the TT group. This indicates that exercise protocol, time, and duration could be other key factors for protective immune responses. Indeed, there was no significant change in the number and response of NK cells, when mice were exposed for 2–5 minutes at low temperature 4°C water for 5 days without exercise (628) or housed in cold air for 16 days (14). Interestingly, however, the sustained/long-term effects of cold swimming include increased survival rate of parasite-infected mice (16) and enhanced level of TNF-α (7) and IL-2 (17), implying that the protective immune response has been improved (27). With regard to this, our data also show that the combination of periodic and long-term aquatic exercises in TT water may transiently reduce BT, leading to the functional improvement of anti-tumor effector cells.
A recent study of a thermal preference determination demonstrated that non-tumor-bearing mice preferred TT (830), but tumor-bearing mice preferred warmer temperature of 38°C (8). This suggests the following phenomenon: in tumor-bearing mice, the BT drops with tumor growth, inducing a feeling of cold and resulting in increased preference for warmer ambient temperature. Furthermore, another study of the relationship between ambient temperature and an anti-tumor immune response showed that tumor growth control is significantly impaired by housing mice at standard temperature (room temperature of mouse colony) compared with TT (8). Nevertheless, the anti-tumor efficacy was not compared with housing mice at TT and BT. Our study directly shows comparative evidence of the anti-tumor effect by aquatic exercise in TT water and BT water. We showed that aquatic exercise in TT water may have an advantage on the amelioration of a disease requiring protective immune responses, such as infection and cancer.
The interrelationships between stress signals and immune cells in the tumor microenvironment remain unclear. However, an increase in the activity of norepinephrine-driven stress responses likely is one of the underlying mechanisms involved here, since cold exposure has long been used to study the activation of thermogenesis via norepinephrine production (2526). Tumor-bearing mice experienced temporal cold-stress after aquatic exercise at TT compared to housing or BT mice (Fig. 1B). Recent study reported that cold stress-induced norepinephrine was produced by an alternatively activated subset of macrophages and involved in heat production (25). The alternative macrophage was activated and induced by high level of IL-4 environment. Although IL-4 has been known as immunosuppressive cytokine in anti-tumor responses, recent studies demonstrated that IL-4 can promote Eomes expression in CD8+ T cells and induce IFNγ production (31), resulting in significantly enhance the control of viral infection (313233). Thus, TT-induced temporal cold stress may affect IL-4 production through norepinephrine and the IL-4 stimulated program in turn may enhance activity of tumor specific CD8+ T cells. Addressing this possibility will require a greater dissection of functional changes among various immune cell populations including tumor infiltrating cells, and those future studies will clearly provide a better understanding of the physiological interactions between water temperature, thermoregulation, and immune regulation.
More tumor models, such as metastasis, carcinogen-induced tumors, and transgenic cancer-prone mice, must be evaluated to fully appreciate how water temperature may affect therapeutic outcomes. Furthermore, the model we tested here (transplantable solid tumor model) represents subcutaneous solid tumors. Therefore, disseminated hematological malignancies or cancers that grow as ascites in the peritoneal cavity should be examined for their responsiveness to water temperature, since the tumor mass directly contacted with water and their growth can be affected by accommodating the changes of temperature by water contact.
In summary, this study demonstrates that it is important to consider water temperature as a component in hydrotherapy or aquatic rehabilitation. However, whether these data have an implication for humans remains unclear, and should be addressed in a future study. Clearly a better understanding of the physiological interactions between environments, thermoregulation, and immune regulation could uncover important new strategies for strengthening anti-tumor immunity.
 XML Download