

 PDF
PDF ePub
ePub Citation
 Print
Print


INTRODUCTION
Thermoplastic denture base resins are used for the fabrication of temporary dentures and nonmetallic clasp dentures (NMCDs). The esthetic demand of patients for dental treatment has recently increased. Therefore, flexible dentures made of thermoplastic denture base resin instead of conventional thermally polymerized resin have been introduced as an alternative treatment method to overcome the undesirable metal exposure.1
Currently, many types of thermoplastic denture base resins are clinically applied, and their physical and mechanical properties are different depending on the constituents. Thermoplastic resin has a lower elastic modulus than conventional denture base resins created by heat polymerization, but it is advantageous in that it can be used on an abutment having a large undercut due to its softness and flexibility with high elasticity and fracture resistance.23 In addition, the translucent pink color of thermoplastic denture base resins meets esthetic needs by blending with natural gingival tissue color. Therefore, these resins can be made thinner and lighter compared to conventional heat-curing acrylic resins, thereby improving wearability. Thermoplastic resins also have the advantages of low allergenic risk, high resistance to acids and alkalis, and low surface roughness.4 However, they are known to exhibit lower color stability and a high risk of fracture compared to PMMA (polymethyl methacrylate), which is generally used as a denture base material, and has a surface that can be easily roughened by abrasion.
There are four types of thermoplastic denture base materials that are used in dentistry: polyamide, polyester, acrylic resin, and polycarbonate. In recent years, polypropylene thermoplastic denture base materials, which have already been used in various industrial fields, have been introduced. In previous studies,5678 14 commercially available products including the four kinds of materials (polyamide, polyester, acrylic resin, and polycarbonate) were investigated, but the results did not reach the flexural strength proposed by international standard9 and wide variation in experimental results was observed. Little research has been performed on recently introduced polypropylene materials.
There is insufficient evidence whether thermoplastic denture base resins have enough desirable properties to replace existing conventional denture base resins in clinical practice. Therefore, consistent results from comparison studies on thermoplastic denture base materials are needed. Investigations of recently introduced thermoplastic denture base materials including polypropylene are required, especially for their physical properties and color stability.
The purpose of this study was to compare the physical properties and color stability of injection-molded thermoplastic denture base resins. The hypothesis of this study is that various injection-molded thermoplastic denture base resin materials have varied physical properties depending on their constituents.
Go to : 
MATERIALS AND METHODS
In this study, six commercially available products (Valplast, Lucitone, Smiletone, Estheshot-Bright, Acrytone, and Weldenz) were selected from four types of thermoplastic denture base materials (polyamide, polyester, acrylic resin, and polypropylene). For each experiment, specimens for the analysis of physical properties were produced through the manufacturing process suggested by each manufacturer (Table 1).
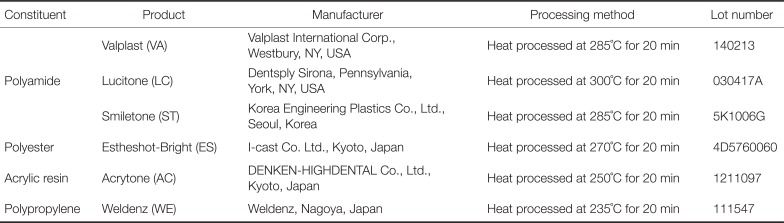
Table 1
List of thermoplastic denture resin materials used in this study
![]()
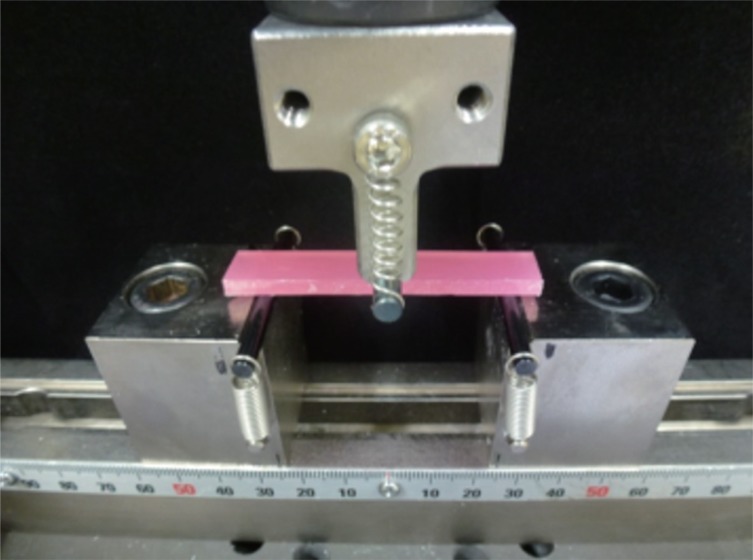
For the experiments of flexural modulus and strength, according to the ISO 1567(2005),9 ten bar specimens (10 × 64 × 3.3 mm) were prepared with an injection-mold technique for each group. All specimens (n = 10) were stored for 48 hours in a 37℃ distilled water bath. The flexural modulus and strength of each specimen were measured through 3-point bending strength test using a universal testing machine (AGX-KN10, Shimazu Corp., Kyoto, Japan). A crosshead speed of 5 mm/min was applied with a distance of 50 mm between the supports (Fig. 1).
The calculation formula for flexural modulus (E) and strength (σ) is as follows according to International Standard:

: F1 is the load, in newtons, at a convenient point in the straight-line portion of the trace;
: d is the deflection, in millimetres, at load F1;
: l is the distance, in mm, between the supports, accurate to ± 0.01 mm;
: b is the width, in mm, of the specimen measured immediately prior to water storage;
: h is the height, in mm, of the specimen measured immediately prior to water storage.

: F is the maximum load, in newtons, exerted on the specimen;
: l, b, h are the same value with those on the formula for flexural modulus (E)
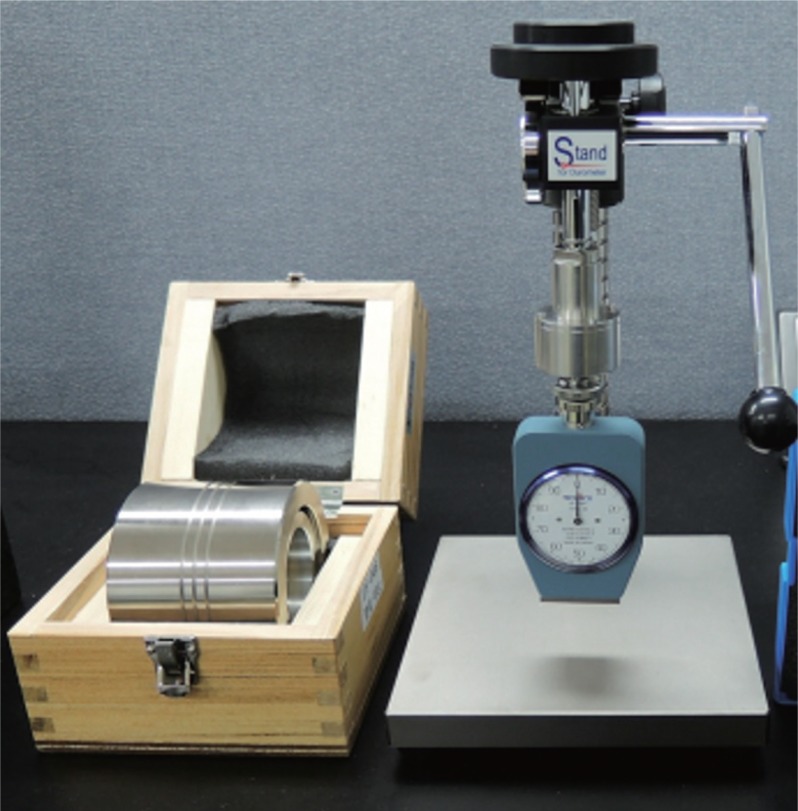
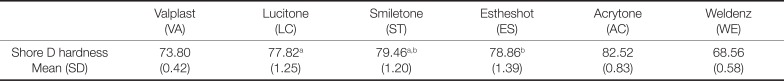
A Shore D hardness test was carried out using a Shore D durometer (GS-702N, Teclock Corp., Okaya, Japan) and a durometer stand (ISO 868,10 hardness by means of a durometer), (Fig. 2). Ten specimens (10 × 10 × 3.3 mm) for each group were prepared by the process noted in Table 1. The specimens were arranged parallel to the ground surface and each had a surface area of at least 100 mm2 and a thickness of 25 – 30 mm or more. Each specimen was placed under the indenter of the durometer, a load was applied with a weight of 5 kgf to generate indentations, and the Shore D hardness values were recorded.
Water sorption and solubility tests were based on the content of ISO 1567(2005), Dentistry-Denture base polymers, Water sorption, and solubility. A total of 30 specimens were fabricated with an injection mold technique and divided into five specimens of 15 mm (diameter) × 1 mm (thickness) disks per group. The experimental values were measured with the following instructions: m1, m2, m3, and V.
For the measurement of m1, the specimens were stored in a dry oven (Forced Convection Dry Oven, DAIHAN Scientific Co., Ltd. Wonju, Korea) at 37℃ for 24 hours and then weighed. Analytical balances (AR2140, Ohaus Corp., Parsippany, NJ, USA) were used. The measurement was repeated at intervals of 24 hours, and this value was repeatedly recorded as m1 until the error of the weight was stabilized at 0.001 g or less. The volume (V) of the specimen was measured using digital calipers (500–181, Mitutoyo, Japan) with a resolution of 0.01 mm. The diameter was measured twice and the thickness was measured 5 times per specimen before the average value after m1 was determined.
For the measurement of m2, the pretreated specimens were immersed vertically in 37℃ distilled water for 7 days. During immersion, the distance between the specimens was kept at 3 mm to avoid contact. After 7 days, the immersed specimens were taken out. For accurate measurements, the specimens were wiped with a dry towel until moisture was removed, dried in the air for 15 seconds, and measured for weight (m2) after 60 seconds.
For the m3 measurement, the weighed specimens were measured in the same manner as the pretreated (m1) specimens and were repeated every 24 hours until the values were stabilized.
Calculation of the value for water sorption (Wsp) and solubility (Wsl) for each specimen is expressed in µg/mm3 from the following equation:
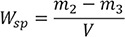
: m2 is the mass of the specimen, in micrograms (µg), after immersion in water
: m3 is the reconditioned mass of the specimen, in micrograms (µg)
: V is the volume of the specimen, in cubic millimetres (mm3)
m1 is the “conditioned” mass of the specimen, in micrograms (µg)
: m3 and V are as given in water sorption formula
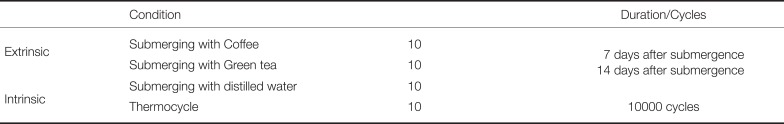
For the color stability test, specimen specifications were referenced to ADA No. 1211 and were fabricated in a 10 mm (diameter) × 2 mm (thickness) disk shape with an injection mold technique. Forty specimens were prepared for each group (Table 2). All the specimens were stored in distilled water for 24 hours before conditioning and the measured values were used as reference values for all the experimental groups. The experimental groups were divided into extrinsic and intrinsic factors for specimen treatment. Distilled water storage and thermocycling treatment were applied as intrinsic factors, and the color stability test was conducted by color staining with coffee and green tea solutions as the extrinsic factors. The staining solution was prepared by mixing 15 g of coffee powder (Iguaçu Company Instant Coffee, Cornélio Procópio, Brazil) with 500 cc of boiling water for 10 minutes and filtering with filter paper. The green tea solution was created by adding 500 cc of boiling water to one tea bag (Dongsuh, Seoul, Korea), allowing it to precipitate for 10 minutes, and then filtering it. The specimens for each group were stored in each solution in a light-shielded container in a 50℃ dry oven (DAIHAN Scientific, Co., Ltd. Wonju, Korea).12 The staining solution was changed daily and the experiment was carried out for 14 days. The thermo-cycling test was performed on each specimen by repeatedly circulating it 10,000 times within 30 seconds in a cold water bath at 5℃ and a hot water bath at 55℃.
Color stability was evaluated using a CIELAB color space, which mathematically describes all perceivable colors in three dimensions: L for lightness, and a and b for the color opponents of green-red and blue-yellow. Using a spectrophotometer (Color Eye 7000A, X-Rite, Inc., Grand Rapids, MI, USA), the values of each specimen were analyzed, with the light source of sunlight D65 containing ultraviolet rays. The L, a, and b values of each specimen were recorded three times. Reference values (stored in the distilled water for 1 day) and values after staining solution precipitation for 7 and 14 days were also calculated. Color change parameters, ΔL, Δa, and Δb, were calculated with the following equation:
Δ L = L (Experimental) − L (Reference)
Δ a = a (Experimental) − a (Reference)
Δ b = b (Experimental) − b (Reference)
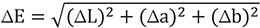
Based on this, the total color difference value (ΔE) was calculated and recorded as follows:
Data was statistically analyzed using SPSS (SPSS Ver. 22.0, Chicago, IL, USA). The significance level (p) was set to 0.05 and normality was evaluated with the Komologov-Smirnov test. For nonparametric analyses, the Kruskal-Wallis and Mann Whitney U tests were used.
Go to :
RESULTS
The flexural modulus and strength of the thermoplastic denture base resins for each manufacturer were calculated as follows (Table 3). For the flexural modulus value, ES exhibited the highest value with no significant difference from AC, LC, and ST (P > .05). WE, the lowest group, was significantly lower than all other the groups (P < .05). VA was significantly higher than WE, but lower than LC, ST, ES, and AC (P < .05). None of the specimens used in the experiment fractured and all the specimens underwent ductile deformation.
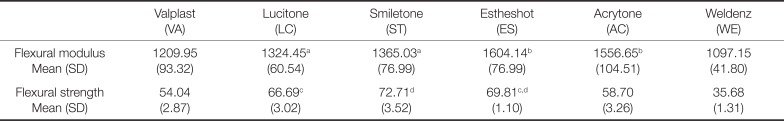
Table 3
Flexural modulus and strength of thermoplastic denture base resin (in MPa)
![]()
Flexural strength was the highest in ST and ES, and there was no statistically significant difference between the two groups (P > .05). As seen with the lowest modulus, WE also showed the lowest strength and was significantly lower than all the other experimental groups (P < .05). LC did not show any statistical difference with ES, while AC was lower than LC, ST, and ES (P < .05) in flexural strength.
The mean values and standard deviations of the Shore D hardness values of the thermoplastic denture base resins for each group were calculated and statistical analysis was performed (Table 4). Shore D hardness was significantly higher for AC than the other thermoplastic denture base resins (P < .05). WE exhibited significantly lower hardness than all the other groups (P < .05). Overall, shore hardness was low in the following order: WE and VA similar to the flexural modulus, with hardness being relatively good in AC, ST, and ES.
The results of water absorption and solubility of thermoplastic denture base resins for each group are presented in Table 5. The water sorption was relatively higher in LC and AC with AC showing higher water sorption than ST and ES. LC exhibited higher sorption than ST (P < .05). Solubility was the highest in AC, but there was no significant difference among the product groups (P > .05).
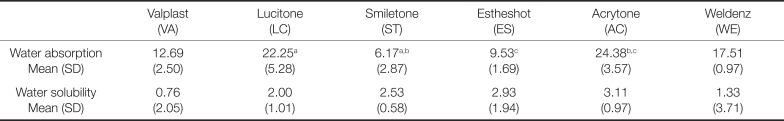
Table 5
Mean and standard deviation of water absorption and solubility test (µg/mm3)
![]()
The extrinsic factors for the color stability test were ΔL, a, b, and ΔE values as a function of coloration by coffee and green tea solutions 7 and 14 days after precipitation in the solution, respectively (Table 6 and Table 7).
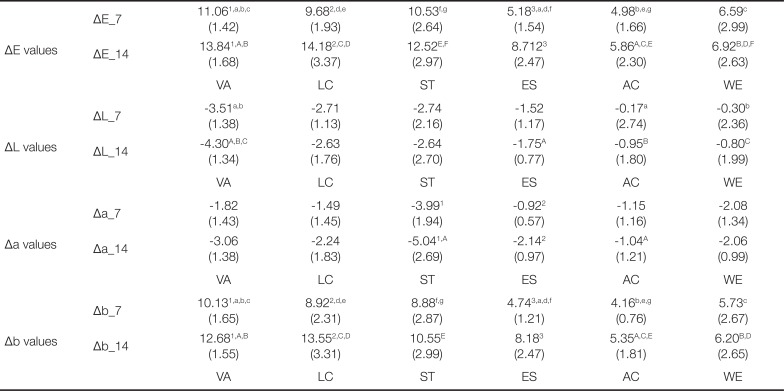
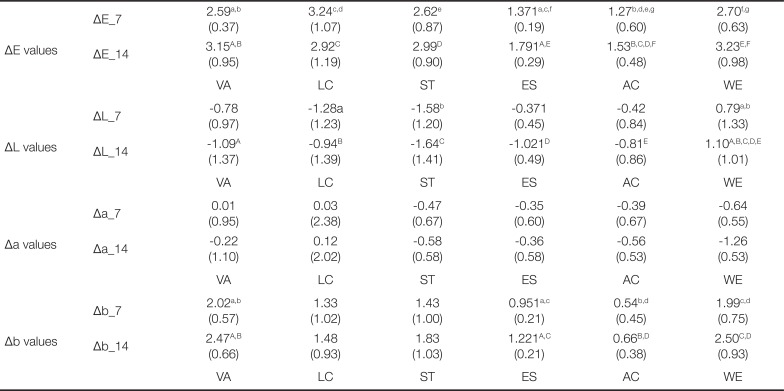
Table 6
The mean value and standard deviation of ΔE, L, a, b after 7 days, 14 days of staining with coffee (Mean (SD))
![]()
Table 7
The mean value and standard deviation of ΔE, L, a, b after 7 days, 14 days of staining with green tea (Mean (SD))
![]()
The extrinsic factors for the color stability test were ΔL, a, b, and ΔE values as a function of coloration by coffee and green tea solutions 7 and 14 days after precipitation in the solution, respectively (Table 6 and Table 7).
The value of ΔE after coffee coloration was the lowest in AC regardless of the amount of time. The minimum value of AC was recorded from 4.87 (1.66) to 13.84 (1.68) at the maximum. VA, LC, and ES significantly increased ΔE (ΔE_14) over 14 days (ΔE_7) from 7 days after coloring (P < .05). In the comparison of the ΔE_7 among products, VA exhibited a higher color difference than ES, AC, and WE. LC and ST showed higher ΔE values than ES and AC, respectively (P < .05). In the comparison of ΔE_14 product groups, polyamides (VA, LC, ST) exhibited higher color difference values than AC and WE and showed weaker color stability (P < .05). On the other hand, there were no significant differences in the ΔE_14 value between polyamides and ES (P > .05).
The value of ΔL indicates the change in brightness. In all denture thermoplastic resin experimental groups, there was no difference in brightness between 7 days (ΔL_7) and 14 days (ΔL_14) of coffee solution immersion (P > .05). The average value was recorded as a negative value, indicating an overall brightness reduction. Comparisons among the groups showed that the ΔL_7 and ΔL_14 values of VA were significantly different from those of AC and WE (P < .05), suggesting that the brightness changes were relatively darker with negative values. The ΔL_14 value of ES was also significantly lower than that of VA (P < .05).
Δa, which indicates a change in the red axis, was negative for all experimental groups. This means that a change occurred to green rather than red, and that the amount of change to green gradually increased with time in ST and ES (P < .05). After 7 days of coloring in coffee solution (Δa_7), no difference was observed between the materials used for each denture (P < .05). After 14 days of coloring (Δa_14), AC exhibited a significant change (P < .05).
Δb was positive in all experimental groups and VA, LC, and ES showed more significant changes after 14 days of coloring (Δb_14) compared to 7 days of coffee coloring (Δb_7) (P < .05). In the comparison of Δb_7 values, polyamides exhibited greater changes than ES and LC, while VA showed a larger change than WE (P < .05). For the Δb_14 values, VA and LC showed larger changes than AC and WE. ST showed a larger change from AT to yellow (P < .05). There was no significant difference between ES and polyamides (P > .05).
The ΔE values after green tea solution coloring were the lowest in AC, regardless of the time elapsed as in the case of coffee solution. The minimum value of AC was lower than that of coffee solution in all experimental groups. In comparison of the color difference values (ΔE_7) after 7 days, VA and LC were significantly larger than AC and ES, ST showed a color difference larger than LC, and WE had a significantly larger ΔE value than AC and ES (P < .05). In the color difference (ΔE_14) after 14 days, AC showed lower values than all polyamide resin and WE, and ES showed less color difference than VA and WE (P < .05).
In comparison of the brightness change ΔL value for the green tea solution, the brightness of ES was significantly darkened after 14 days (ΔL_14) than 7 days of coloring (ΔL_7) (P < .05). WE showed significant difference between LC and ST after 7 days of coloring and significantly higher ΔL value than all other thermoplastic denture resin materials after 14 days of treatment (P < .05).
The Δa after green tea solution precipitation did not show any change with time or product group (P < .05) for all experimental groups, and Δb showed a yellow coloration as a positive value in all experimental groups. ES significantly increased Δb_14 than Δb_7. The difference of Δb values was similar between 7 and 14 days after coloring, and VA and WE were significantly larger than AC and ES, respectively (P < .05).
The intrinsic factors for the color stability test involved 10,000 rounds of thermocycling in distilled water and distilled water submergence for 7 and 14 days (Table 8 and Table 9). After 7 and 14 days of precipitation in distilled water solution, no change in the color coordinate values (ΔL, a, b) and ΔE value with time or the experimental groups was observed. For the comparison before and after the heat cycle treatment test, there was no significant difference (P > .05). The effect of intrinsic treatment on the color stability of the materials was not observed.
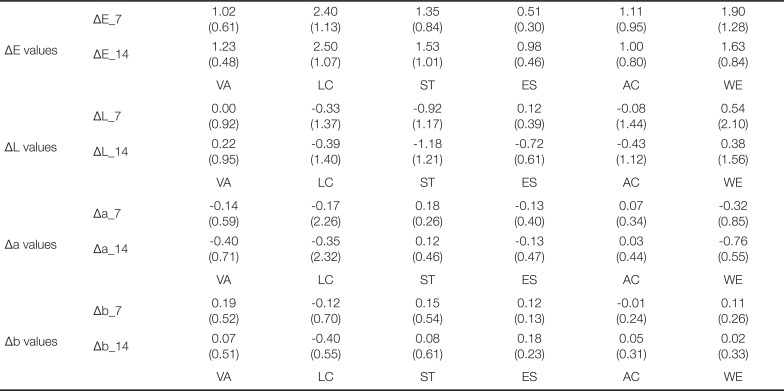
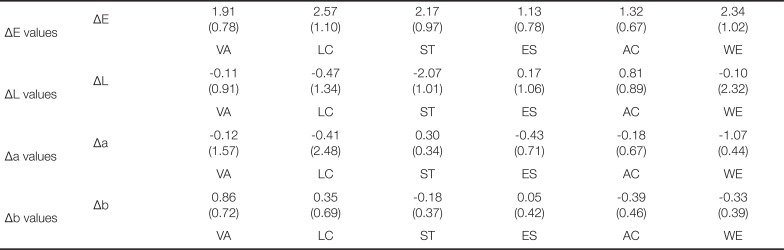
Table 8
The mean value and standard deviation of ΔE, L, a, b after 7 days, 14 days of submerging with distilled water (Mean (SD))
![]()
Table 9
The mean value and standard deviation of ΔE, L, a, b after 10000 times of thermoscycling (Mean (SD))
![]()
Go to :
DISCUSSION
The nonmetal clasp denture base materials used in this experiment, Type 3 denture base polymers according to ISO 1567 classification, were either thermoplastic blank or powder. Appropriate flexibility with a minimum of 2,000 MPa flexural modulus and 65 MPa flexural strength are also required.8
However, the maximum flexural modulus of this experiment was 1604.14 (76.99) MPa of ES. All of the other commercially available products (VA-1471, LC-1330, ES-1493, AC-1360; in MPa) did not meet this standard with a modulus less than 2,000 MPa. For the modulus of VA, Takahashi et al.13 reported a range of 800 - 1400 MPa, while Takabayashi et al.1 reported values of 826 (111) MPa. Hamanaka et al.2 reported a value of 1045 (110) MPa, while the result of this study was 1209.95 (93.32) MPa. The flexural modulus of LC was previously reported in various studies as 1639 (88),1 1450 (50),214 1380 (70)15 in MPa. ES was 1590 (21) MPa and AC was 1355 (39) MPa based on findings from Hamanaka et al. The overall experimental results were close to the manufacturer's data and the data of the previous study rather than the value suggested by ISO. Polycarbonates were not available in Korea and not evaluated in this experiment.
The results of flexural strength showed LC, ST, and ES values of 65 MPa or more, which were similar to findings from previous studies,1314 but VA was found to be insufficient compared to the other materials. In addition, the polypropylene base material (WE) was observed to have a significantly lower flexural modulus and strength than other thermoplastic denture base materials. This suggests that it does not meet the minimum bending strength requirements required for clinical applications. Polycarbonate denture base materials are not available in Korea and were not evaluated in this study. However, according to Fueki et al.,5 they exhibited a high flexural strength of over 65 MPa.
Shore D hardness results were the highest in LC, ST, and ES. VA and WE were significantly different from all the other experimental groups and were relatively low, similar to the flexural strength results.
Water sorption and solubility are required to be less than or equal to 32 µg/mm3 and 1.6 µg/mm3, respectively, in accordance with international standards. Pass/Fail determination is required where at least 4 out of 5 specimens must meet the criteria to pass. In this experiment, all the specimens and their mean values met the requirements for water sorption, whereas the specimens for the solubility test did not meet the requirements except for the VA and WE groups. In the earlier study,16 the water sorption of different types of acrylates is 10 to 25 µg/mm3 and the results of this study was 6.17 to 24.38 µg/mm3. It seems water sorption of thermoplastic denture base resin used in this study was similar with that of PMMA heat-cured denture base resin. Among the thermoplastic resins, relatively higher water sorption was observed in AC and LC, which may be due to the high degree of hydrophilicity that can be deduced from the contact angle measurement results in LC. Even though the contact angle is not as large as that found in acrylic resin, these results may be due to the difference in cross-linking agents and molecular weight.13 Overall, WE and VA exhibited relatively superior properties for water sorption and solubility.
A spectrophotometer is one of the methods that can quantitatively assess material color changes, provide objective evaluation, and express color objectively.17 It was used in the evaluation of color stability and was certified by the International Commission on Illumination in 1978. The color difference value ΔE is a parameter of the color stability obtained by measuring the values of L, a, and b. As the value of ΔE increases, the color stability decreases. Esquivel et al.18 reported a consistent agreement with the CIE colorimetric system, and Seghi et al.19 reported that the spectrophotometer was the most accurate instrument to obtain the absolute values of the sample color coordinates. Gross and Moser20 reported that it was impossible to know when the ΔE value was between 0 and 2. Ruyter21 and Buyukyilmaz and Ruyter22 suggested that acceptable ΔE values were less than 3.3. Eldiwany et al.23 showed that the ΔE value of 3.3 or more is visually perceptible. Goldstein and Schmitt24 concluded that if the ΔE value is greater than 3.7, the clinical tolerance limit is exceeded and the difference is visible.
In this experiment, the color difference of all the thermoplastic denture resins treated with the coffee solution was 3.7 or more, which allowed for visual recognition of the color change and showed weak color stability beyond the clinically acceptable range. On the other hand, for the green tea solution, the average color difference of all the thermoplastic resins on the 7th and 14th days was 3.3 or less, which showed a color difference within the range that is clinically acceptable or visually impossible. However, the color stability of polyamides such as VA, LC, and ST decreased with the increase of the staining duration regardless of the type of solution, and was lower than that of the other materials. In the results for ES, the color change at 14 days was larger than that at 7 days for both coffee and green tea solutions. On day 7, the color stability was better than polyamides, but on the 14th day, the appearance was different according to the solution. In the coffee solution, ES was not significantly different from polyamides. Even though the change was intensified, it exhibited higher stability than polyamides. ES showed relatively superior results in the water sorption test, but the test conditions were for only 7 days. Therefore, the water sorption of ES might be decreased with different time periods of water submergence. AC showed the highest color stability overall. While WE exhibited greater color change than AC and ES in the green color solution, no significant difference was seen when compared with polyamides.
The color change of the b value was noticeable with the yellow color in all the experimental groups, and the pattern of this change was similar to that of the color difference ΔE values. In addition, instability of the intrinsic color was not observed in the results of the distilled water and thermocycling tests. The increase in chromaticity or the color coordinate value of the lab colorimetric system did not change significantly with time.
Go to :
CONCLUSION
Within the limits of this study, thermoplastic denture base resins did not exhibit sufficient modulus to function as a denture base with polypropylene being the lowest among these materials. In addition, all the resins showed clinically significant discoloration, with the polyamide series exhibiting the lowest color stability.
Go to :
 XML Download