

 PDF
PDF Citation
 Print
Print


INTRODUCTION
Propofol has been known to induce decreases in cardiac output by vasodilation and suppressive effects on myocardial contractility through an animal study1 and low-risk patients group.23 In our previous study, propofol induced a transient decline of peak systolic mitral annular velocity (Sm) in Doppler tissue imaging (DTI) in transthoracic echocardiography during anesthesia induction in patients undergoing non-cardiac surgery.3 Patients undergoing cardiac surgery have reduced cardiac reserve compared to the patients who underwent non-cardiac surgery. Therefore, further reduction of intraoperative cardiac performance may exert deleterious effects on patient outcome. However, it is difficult to find previous studies which investigated the dose-response effects of propofol on left ventricular (LV) systolic performance during total intravenous anesthesia employing propofol and remifentanil in patients for cardiac surgery.
Mitral annular motion in DTI is used to evaluate global LV performance in the clinical setting and has several merits, including relatively easier, less operator- and load-dependent application.456 The Sm in DTI depicts systolic long-axis LV performance and its value showed a close relation to the degree of a systolic increase in LV pressure (dP/dt) in animal studies.78 It also showed superiority in detecting small- or minor-changes in LV systolic performance that were not noted in LV ejection fraction (LVEF) monitoring in various clinical settings.910
Therefore, we hypothesized that intraoperative increments in propofol concentration would suppress LV systolic performance by dose dependent manner in cardiac surgery patients. In this study, we tested Sm changes during increments of propofol dosage with a fixed dose of remifentanil during cardiac surgery in patients.
METHODS
Patients
This study was conducted prospectively in patients who underwent elective cardiac surgery. The patients were excluded according to the following preoperative criteria: contraindications for transesophageal echocardiography (TEE), atrial fibrillation, pacemaker implantation, pericardial and infiltrative myocardial disease, infective endocarditis, ischemic heart disease, mitral annular pathology limiting its motion, regional wall motion abnormality, and LVEF < 50%. The patients who had a history of allergic reaction to anesthetic agents, including propofol and its component, remifentanil or rocuronium, were also excluded.
Anesthetic monitoring and maintenance
Routine monitoring, including electrocardiogram, pulse oximetry, Bispectral index (BIS; Aspect Medical System Inc., Norwood, MA, USA), and infrared regional cerebral O2 saturation, was started upon each patient's arrival at the operating room. After establishing invasive arterial pressure monitoring, anesthesia was induced and maintained with target-controlled infusion (TCI) of 2% propofol (FresofolTM; Fresenius-Kabi AG, Bad Homburg, Germany) and remifentanil (UltivaTM; GSK Korea, Seoul, Korea). To induce anesthesia, propofol-TCI was started to achieve an effect-site concentration (Ce) of propofol of 2.0‒3.0 μg/mL, bolus rocuronium 0.9 mg/kg was administered, and remifentanil-TCI was started to achieve its plasma concentration (Cp) of 20 ng/mL for 7 minutes. Propofol and remifentanil were administrated by using a TCI pump (OrchestraTM; Fresenius Kabi, Bad Homburg vor der Höhe, Germany) using the Schnider and Minto models, respectively.1112 During the increase in the Cp of remifentanil, the Ce of propofol was gradually reduced to 0.7–1.5 μg/mL to maintain stable hemodynamics and BIS of 40−60. With the completion of tracheal intubation, central venous and pulmonary arterial catheter were placed to monitor central venous pressure (CVP), pulmonary arterial pressure (PAP), cardiac index, and mixed venous O2 saturation (SvO2). A TEE probe (X7-2tTM with iE33TM echo-console; Philips, San Jose, CA, USA) was inserted and routine TEE examination was performed in accordance with the guidelines of the American Society of Echocardiography/Society of Cardiovascular Anesthesiologists. When systolic blood pressure (BP) decreased below 80 mmHg, intravascular volume loading with hydroxyethyl starch or phenylephrine bolus with or without its infusion was applied, considering the changes in stroke volume (SV) and systemic vascular resistance. If bolus phenylephrine was required repetitively, continuous infusion of phenylephrine was started. Urine output was replaced by balanced crystalloid infusion.
Increments in the Ce of propofol and TEE image recording
After achieving a BIS of 40−60 and stable hemodynamics during the pre-bypass period, the Ce of propofol was recorded as Ce1. Then, three consecutive DTI tracings of the lateral mitral annular motion in the midesophageal 4-chamber view were recorded as digital images with a sweep speed of 6.67 cm/sec. The Doppler beam was properly aligned with the target tissue less than 30 degrees of angle. Pulsed-wave Doppler tracings of mitral inflow and 2-dimensional images for LVEF were also recorded in the midesophageal 4-chamber or 2-chamber view for future offline analyses. These recordings were repeated after increasing Ce to the double and triple of Ce1 (Ce2 and Ce3, respectively). All echocardiographic recordings were digitally stored during a short interruption of positive pressure ventilation by a single investigator (TK). None of the digital images of DTI tracings included patient information or recording times.
During the doubling and tripling of Ce1, phenylephrine infusion rate was increased to maintain a mean BP within 80%−120% of the pre-induction level. The degrees of mitral regurgitation (MR), heart rate (HR), BP, PAP, CVP, cardiac index, SvO2, and BIS were recorded at Ce1, Ce2, and Ce3.
Off-line analyses of recorded TEE images
An echocardiographer, who was not involved in the current study, exported the digitally recorded TEE images to software (QLAB™; Philips Healthcare, Bothell, WA, USA) and processed their off-line analyses of following data: Sm, peak velocity of mitral annular at relaxation (e′), and late atrial contraction (a′) of DTI; transmitral peak flow velocity at early filling (E), transmitral peak flow velocity at atrial contraction (A), E/A ratio and deceleration time (DT) of the early diastolic transmitral inflow Doppler; and LV end-diastolic and end-systolic volumes (LV-EDV and LV-ESV) for calculating LVEF with modified Simpson method. The values of Sm, e′, and a′ at each Ce value were measured twice, and the mean values of two measurements were referred for statistical analyses. Changes in LV-EDV were analyzed to determine the changes in LV preload.13 To assess the LV afterload change, changes in the effective arterial elastance were estimated by using LV end-systolic BP and SV.14
Pharmacodynamic modelling for predicting the Ce of propofol producing an Sm decline
The Ce values for reducing Sm from that at Ce1 were determined using a pharmacodynamic modelling technique. With observation of Sm at Ce1, Ce2, and Ce3, “non-responses” and “responses” were joined to 0 or 1. The occurrence of Sm decline by ≥ 10% and ≥ 20% from its values at Ce was considered a “response,” whereas the occurrence of a decline < 10% and < 20% was considered a “non-response.”
The pharmacodynamic relationship between Ce and Sm were analysed using logistic regression. Ce50−10% and Ce50−20% were defined as Ce values producing 10% and 20% decrease in Sm, respectively, with 50% probability. The relationship between the probability of response (Prob) and the Ce of propofol was analyzed using a sigmoid Emax model:

where Ce50 is Ce value associated with the occurrence of the “response” with 50% probability and γ is the steepness of the Ce-vs.-response relation.
Ce95-10%, Ce95-20% were defined as Ce values producing “response” with 95% probability.
The likelihood (L) of the observed response (R) was described by the following equation with Prob.
The logistic regression model was fitted using NONMEM® 7 level 3 (ICON Development Solutions, Dublin, Ireland). Inter-individual random variabilities of pharmacodynamic parameters were estimated by assuming a log-normal distribution. Diagonal matrices were estimated for the various distributions of η, where η represented inter-individual random variability with a mean of zero and a variance of ω2. Model parameters were estimated using the option “LIKELIHOOD LAPLACE METHOD = conditional” of NONMEM.
Statistical analyses
The statistical significance of the changes in dependent variables according to an increase in the propofol concentration was assessed using generalized mixed linear modelling to handle the dependencies in repeated measurements within the same person.1516 All of the dependent variables at each level of the propofol concentration were estimated using the least square means and standard error. Statistical analysis was performed with SAS version 9.4 (SAS Institute, Cary, NC, USA). A P value less than 0.05 was considered statistically significant.
Ethics statement
The study protocol was reviewed and approved by Konkuk University Medical Center Institutional Review Board (KUH1160053). It was registered at the registry of Clinical Trials (ClinicalTrials.gov: NCT01826149). All subject submitted informed consent when they were recruited.
RESULTS
Thirty-eight patients undergoing elective mitral valve surgery were initially interviewed and recruited. Two were excluded due to atrial fibrillation and ischemic heart disease and 3 were excluded due to improper DTI alignment. Finally, recorded TEE data of 33 patients were analysed (Table 1).
Table 1
Demographic and preoperative echocardiographic indexes (n = 33)

Values are presented as number of patients (%) or mean ± standard deviation.
BSA = bovine serum albumin, CCB = calcium channel blocker, ARB = angiotensin receptor blocker, ACEI = angiotensin converting enzyme inhibitor, LVEF = left ventricular ejection fraction, E = peak velocity during early diastolic filling, A = peak velocity during atrial contraction.
![]()
The mean values of Ce1, Ce2 and Ce3 were 0.8 μg/mL, 1.6 μg/mL and 2.4 μg/mL, respectively (Table 2). During these increments, the proportion of grading in diastolic performance and the degree of MR did not show significant changes. The mean values of BIS at Ce1, Ce2, and Ce3 were 50, 43 and 37, respectively, and their mean differences at Ce2 vs. Ce1 and Ce3 vs. Ce1 were 7.7 (95% confidence interval [CI], 5.3–10.1) and 13.2 (95% CI, 10.9–15.6), respectively. Phenylephrine infusion rates were significantly increased at Ce2 vs. Ce1 and Ce3 vs. Ce1: mean differences were 0.03 (95% CI, 0.00–0.05) μg/kg/min and 0.07 (95% CI, 0.04–0.09) μg/kg/min, respectively.
Table 2
Serial hemodynamic and transesophageal echocardiographic data during the increments in Ce of propofol
Values are presented as mean ± standard deviation or mean (95% confidence interval) as appropriate.
Ce = effect-site concentration, BIS = bispectral index, HR = heart rate, BP = blood pressure, PAP = pulmonary artery pressure, CVP = central venous pressure, SvO2 = mixed venous oxygen saturation, LV-ESV = left ventricular end-systolic volume, LV-EDV = left ventricular end-diastolic volume, LVEF = left ventricular ejection fraction, SV = stroke volume, SVRI = systemic vascular resistance index, PW = pulsed-wave, E = peak mitral inflow velocity during early diastolic filling, A = peak mitral inflow velocity during atrial contraction, DT = deceleration time, Sm = peak systolic velocity of the mitral annulus descending toward the apex, e′ = peak velocity of the mitral annulus ascending away from the apex during early relaxation, a′ = peak velocity of the mitral annulus ascending away from the apex during atrial contraction.
aCe maintaining a BIS of 40–60 with a remifentanil concentration of 20 ng/mL; bCe as two-times large as Ce1; cCe three-times large as Ce1.
![]()
HR, cardiac index and systemic vascular resistance index values at Ce1, Ce2 and Ce3 did not show significant changes during the increments. Although blood pressures were significantly reduced at Ce2 vs. Ce1 and Ce3 vs. Ce1, respectively, those were well maintained within 80%–120% of the pre-induction level.
TEE data
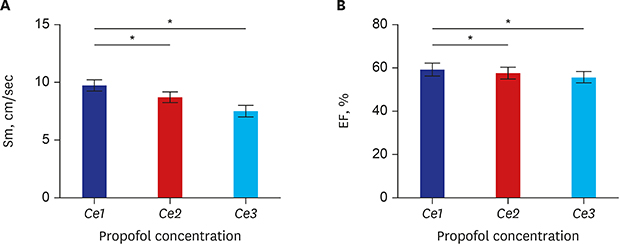
Serial hemodynamic and echocardiographic data during the increments in the Ce of propofol was summarized in Table 2. The mean (95% CI) values of Sm were 9.7 (9.3–10.2), 8.2 (7.5–9.1) and 7.5 (7.1–8.0) at Ce1, Ce2, and Ce3. Sm was significantly reduced in all comparisons of Ce2 vs. Ce1, and Ce3 vs. Ce1, as shown in Fig. 1; the mean differences were 1.08 cm/sec (95% CI, 0.43–1.73) and 2.22 cm/sec (95% CI, 1.57–2.87). The intra-observer intra-class correlation coefficient for Sm measurements was 0.82 (95% CI, 0.74–0.88). The mean values of a′ were significantly reduced in comparisons of Ce2 vs. Ce1 and Ce3 vs. Ce1: The mean changes were 1.02 cm/sec (95% CI, 0.68–2.73), and 1.80 cm/sec (95% CI, 0.1–3.51), respectively.
 | Fig. 1Serial changes in (A) Sm and (B) EF with increments in Ce of propofol from Ce1 to Ce3. (A) As propofol concentration increases from Ce1 (0.8 ± 0.1) to Ce2 (1.6 ± 0.2) and Ce3 (2.4 ± 0.3), Sm was decreased. (B) As propofol concentration increases from Ce1 (0.8 ± 0.1) to Ce2 (1.6 ± 0.2) and Ce3 (2.4 ± 0.3), EF was decreased. The error bars indicate the standard error at each concentration.Sm = peak systolic velocity of the mitral annulus descending toward the apex, EF = ejection fraction, Ce = effect-site concentration.
*P < 0.05.
|
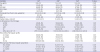
LVEF was significantly reduced in Ce2 vs. Ce1 and Ce3 vs. Ce1: the mean changes were 1.70% (95% CI, −2.01–5.41) and 3.85% (95% CI, 0.14–7.56) (Fig. 1). LV-ESV was significantly increased in Ce3 vs. Ce1 and Ce3 vs. Ce2; the mean changes were −4.2 mL (95% CI, −12.4–3.9) and −3.6 mL (95% CI, −11.71–4.62) (Fig. 2). SV was significantly decreased in Ce2 vs. Ce1 and Ce3 vs. Ce1: the mean changes were 3.8 mL (95% CI, −3.3–10.9) and 4.6 mL (95% CI, −2.5–11.7). However, LV-EDV, total arterial resistance and systemic vascular resistance index did not show significant changes during the increments.
 | Fig. 2Serial changes in (A) EDV, (B) ESV, (C) Ea, (D) SVRI with increments in Ce of propofol from Ce1 to Ce3. While (A) EDV and (D) SVRI was decreased as effect site of concentration of propofol increases, (B) ESV was significantly increased. (C) Ea was maintained during the entire range of propofol's effect site concentrations. The changes in EDV, EA, and SVRI according to concentration were not significant. The error bars indicates the standard error.EDV = end diastolic volume, ESV = end systolic volume, Ea = total arterial elastance, SVRI = systemic vascular resistance index, Ce = effect-site concentration.
*P < 0.05.
|
While the E did not show significant changes, the A velocity was significantly reduced with the increments of propofol's Ce and E/A ratio was resultantly increased. The e′, E and E/e′ data showed no significant changes during the increments.
As indicated in Table 3, the linear regression equation predicting the changes of Sm, a′ and LVEF due to an increase of Ce showed a significant correlation between Ce and Sm (intercept, 10.8; slope, −1.0; P < 0.01) as well as Ce and LVEF (intercept, 61.3; slope, −2.2; P < 0.01).
Table 3
Regression equation of indicators of left ventricular systolic performance and atrial contractile function according to the changes in the effect-site concentration of propofol

| Variables | Intercept (SE) | P value | Slope (SE) | P value |
|---|---|---|---|---|
| Sm | 10.83 (0.75) | < 0.01 | −1.01 (0.26) | < 0.01 |
| a′ | 0.02 (0.01) | 0.03 | 0.04 (0.01) | < 0.01 |
| LVEF | 61.34 (1.46) | < 0.01 | −2.24 (0.57) | < 0.01 |
Values are presented as mean (SE).
SE = standard error, Sm = peak systolic velocity of the mitral annulus descending toward the apex, a′ = peak velocity of the mitral annulus ascending away from the apex during atrial contraction, LVEF = left ventricular ejection fraction.
![]()
Any change in the degree of MR was not observed during the TEE measurement.
Population pharmacodynamic parameter estimates for the Ce producing a reduction in BIS and Sm values
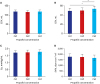
The Ce50−10% and Ce50−20% were 1.4 and 2.1 μg/mL, respectively. Further, those values with 95% probability were 3.9 and 4.2 μg/mL, respectively (Fig. 3). The estimates of γ (the steepness of the concentration-vs.-response relation) with relative standard error and inter-individual variability presented as the percent coefficient of variation are 2.9 (43.1% and 40.1%) for a 10%-decrease in the Sm and 4.3 (46.8% and 36.1%) for a 20%-decrease in the Sm. Inter-individual random variability was modeled using a log-normal model.
 | Fig. 3The relationship between the probability of a 10% (A) and 20% (B) decrease in the Sm from baseline and the Ce of propofol. (A) The estimate of the Ce50 (Ce50−10%, the effect-site concentration of propofol associated with a 50% probability of a decrease in the Sm) with RSE and interindividual variability presented as % coefficient variation was 1.4 μg/mL (13.3, 39.9%). The mean Ce95 (Ce95−10%, the effect-site concentration of propofol associated with a 95% probability of a decrease in the Sm) was 3.86 μg/mL for a 10% decrease in the Sm. The estimate of γ (the steepness of the concentration-vs.-response relation) with RSE and interindividual variability presented as % coefficient variation was 2.9 (43.1, 40.1%) for a 10% decrease in the Sm. Interindividual random variability was modeled using a log-normal model. (B) The estimate of the Ce50 (Ce50−20%, the effect-site concentration of propofol associated with a 50% probability of a decrease in the Sm) with RSE and interindividual variability presented as % coefficient variation was 2.14 μg/mL (12.5, 42.7%). The mean Ce95 (Ce95−20%, the effect-site concentration of propofol associated with a 95% probability of a decrease in the Sm) was 4.23 μg/mL for a 20% decrease in the Sm. The estimate of γ with RSE and interindividual variability presented as % coefficient variation was 4.3 (36.8, 12.5%) for a 20% decrease. Interindividual random variability was modeled using a log-normal model.RSE = relative standard error.
|
DISCUSSION
We evaluated the long-axis function of LV by monitoring Sm during increments in the Ce values of propofol with a fixed concentration of remifentanil. Our results demonstrated a propofol-induced dose-dependent decline in LV systolic long-axis function in cardiac surgical patients. While EDV, systemic vascular resistance, and total arterial elastance, which were representative of preload and afterload, were maintained, SV was decreased and ESV was increased. This suggested that the decline in LV contractile function might be attributed by decrease in long-axis cardiac performance as represented with the decline with Sm, not by decreased preload or increased afterload.
The previous study showed that propofol bolus of 2 mg/kg decreased Sm measured at 1, 3 and 5 minutes after propofol administration in patients with normal LV function.317 While it was found Sm measured at the lateral annulus of the mitral valve was decreased by 26%‒29% after propofol bolus administration, the dose effect of propofol was not evaluated. In this study, we confirmed propofol decreased Sm by dose dependent manner. The degree of Sm reduction at each 1.0 µg/mL increment of propofol was 1.0 cm/sec and the predicted Sm at Ce 0 μg/mL was 10.8 cm/sec.
Sm by DTI reflects the peak velocity of myocardial fiber shortening oriented in the longitudinal direction and is believed to give an estimation of the global systolic function of the LV with high feasibility and reproducibility.18 Of note, the predicted value of Sm at Ce 0 µg/mL of 10.8 cm/sec in this study was greater than the Sm measured with TTE in healthy patients.19 This can be explained by the discrepancy in the measurement method, by which we monitored Sm during the anesthesia with TCI of propofol and remifentanil. Therefore, LV afterload might be reduced by remifentanil-induced vasodilation in all patients and systolic regurgitant flow in mitral insufficiency in half of the patients. Furthermore, Sm measured at lateral mitral annulus is higher than another site as a result of a predominance of longitudinal myocardial fibers in the LV free wall.20 Although there is an angle between the direction of motion of the lateral wall and the ultrasound beam, the lateral mitral annulus is regarded as the most appropriate for quick assessment of global LV function.19
In the meantime, because Sm is not completely independent of the LV loading condition,6 a possible bias due to changes in the LV loading condition should be eliminated to evaluate the LV contractile performance analyzing Sm. Vasodilation, which reduces LV-preload, can be coupled with the reduced systolic performance. However, this potential bias due to vasodilation seemed to be attenuated by the appropriate increments in phenylephrine infusion in our study. Phenylephrine is a selective alpha 1 adrenoreceptor agonist, which increase in afterload and venous return. In this study, considering that systemic vascular resistance index and EDV, representing afterload and preload respectively, was maintained, the significant decrease in LVEF, increase in LV-ESV and decreased Sm might be due to propofol's direct cardiac effect, rather than its indirect effect through vasodilation and LV loading condition.
Sm has been known as a more sensitive marker of global function15 and decreased Sm could predict the poor outcome.21 Therefore, Sm might be useful as a surrogate measure to avoid a decline in LV contractility by propofol concentration in high risk patients. We estimated Ce50‒10% and Ce50‒20%, which predicted a decrease in Sm by 10% and 20% while BIS value was maintained below 40. These values can be referenced in the titration of propofol concentration.
Our results showed significant declines in the a′ and A velocity, which results in the increase of E/A ratio, as in a propofol-induced compromise in atrial contractile performance in the previous studies.32223242526 The decline in atrial contraction may be problematic in patients with diastolic dysfunction because the role of atrial contraction is relatively increased to maintain overall diastolic performance, and the decline might contribute for reducing LV systolic performance through “left atrial-LV coupling.”252627 However, the absence of significant changes in the e′ and E/e′ might suggest preservation of LV diastolic function (early filling) during propofol increments.
Our study has several limitations. First, because our data lacks clinical outcome, it is still unclear whether the dose-dependent Sm declines from 9.7 cm/sec to 7.5 cm/sec speculated in our study was clinically relevant in terms of increasing perioperative risk and outcome. But it does not seem to be ethical to test whether deceased Sm by increased propofol concentration would lead to a bad outcome. In fact, decreased Sm has known to be associated with poor outcome in patients with heart failure, MR or ischemic heart disease.21282930 Therefore, we should try to avoid even mild suppression of Sm as far as possible.
Second, Sm is not fully independent of the changes in LV-loading condition.3132 To minimize this bias, we employed DTI velocities in the lateral mitral annulus, which are more TEE compatible and less load-dependent than those in the medial annulus.33 We also tried to keep the LV loading condition and vascular tone constant by extra-volume infusion and phenylephrine-infusion before and during our study, respectively, as partly supported by the constant degree of MR, CVP, E/e′, LV-EDV, systemic vascular resistance index and arterial elastance during the increments.
Third, associated MR could be a compounding factor for the analyses of our results related to LV loading condition. However, MR and lower LA pressure could accommodate possible changes in LV afterload. Furthermore, the absence of any changes in the degree of MR might support the constant LV loading during the increments.
Fourth, the effect of the high target Ce of remifentanil and combined use with propofol on the contractility of myocardium should be considered. However, remifentanil has been known to have no significant negative inotropic effect on even a failing heart.34 Therefore it is less likely for the use of remifentanil to make an influence on the conclusion.
In conclusion, propofol reduces the intraoperative Sm, indicating LV systolic long-axis performance, in a dose-dependent manner during propofol-remifentanil anesthesia for cardiac surgery.
 XML Download