

 PDF
PDF ePub
ePub Citation
 Print
Print


INTRODUCTION
Despite the significant advances that have been achieved in the management of coronary heart disease (CHD), it remains the leading cause of mortality and morbidity worldwide [1]. The main cause of death from CHD is myocardial infarction (MI), which is an ischemic necrosis of cardiac myocytes results from prolonged interruption of blood supply to certain area of heart [2]. Isoproterenol (ISO)-induced MI is a well-established animal model of pharmacologically induced MI [3]. Several hypotheses have been postulated to explain pathophysiology of the myocardial injury in ISO-induced MI such as relative myocardial hypoxia due to excessive cardiac work and myocardial O2 demands which is intensified by hypotension or hypoxia due to direct O2-wasting effect of catecholamines or their autoxidation products [4].
Heme oxygenase (HO), a key-regulating enzyme in heme degradation, catalyzes the oxidation of heme to produce several active molecules such as ferrous iron (Fe+2), biliverdin and carbon monoxide (CO) [5]. Heme oxygenase-1 (HO-1) is normally expressed at low levels in most of organs; however, it is highly inducible in response to a variety of stimuli to protect cells against oxidative and inflammatory injury [6]. It has several cytoprotective properties such as anti-oxidative, anti-inflammatory and antiapoptotic effects [6]. It has been found that over-expression of HO-1 in animals in either transgenic mouse [7] or transfected rat [8] or by pre-treatment with cobalt protoporphyrin IX (CoPP) [9], a powerful inducer of HO-1 [10], reduced infarct size, ventricular remodeling, enhanced endothelial function, promoted neoangiogenesis and restored cardiac metabolism [11]. However, the role of HO-1 upregulation in modulation of the electrical activities of the cardiac muscles and in induction of molecular cytoprotective chaperones (heat shock proteins, Hsps) in MI needs more clarification.
The intercellular-junctions are group of proteins such as connexin 43 (Cx-43) that electrically couple cardiomyocytes for its coordinated depolarization, and its uncoupling has been associated with heart diseases [12]. Also, Hsps are endogenous proteins that act as intracellular chaperones for other proteins through its essential role in protein corrective function (help protein folding and correct its shape), and preventing the unwanted protein aggregations due to the process of aging and in settings of cardiac stress [13]. The most important and best studied class of all Hsps is the 70 kDa (kilodalton) family [13]. We postulated that the induction of HO-1 could improve electrical activity of the cardiac muscle through up regulation of Cx-43 and Hsp70 in MI. So, the aim of the present study was to investigate the effects of HO-1 induction on the cardiac functions and morphology, electrocardiogram (ECG) changes, oxidative stress markers, and expression of Cx-43 and Hsp70.
METHODS
Experimental rats
Thirty-two adult male Sprague Dawely rats weighing between 180 to 200 g, aging four to six months were included in the present study for 8 days. Animals were bred and housed at Medical Experimental Research Center (MERC), Mansoura University at temperature of 24℃ and 12 h light/dark cycles and rats were fed on a standard laboratory chow and had a free access to tap water. All experimental protocols were approved by our local committee of animal care and ethics (code #MS/16.06.69).
Chemical agents
ISO hydrochloride (Cat# 5984-95-2), CoPP (Cat# 102601-60-5) and Trizma base (Cat# 77-86-1) were obtained from Sigma Chemical Co. (St. Louis, MO, USA).
Experimental design
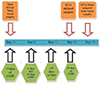
Rats were randomly allocated in to 4 groups (8 rats each): normal control (NC) group, were normal rats receiving 0.5 ml saline intraperitoneally (i.p.); ISO group, rats received ISO via i.p. injection at a dose of 150 mg/kg body weight (dissolved in 0.5 ml saline) for 2 days at (day 0 and day 1) to induce MI [3]; ISO + Trizma group, rats received ISO as in ISO group with Trizma base (solvent or vehicle of CoPP) at a dose of 5 mg/kg i.p. 2 days before injection of ISO, with ISO at day 0 and at day 2 after ISO injection [14]; and ISO + CoPP group: rats received ISO as in ISO group with CoPP at a dose of 5 mg/kg dissolved in Trizma base i.p. 2 days before injection of ISO, with ISO at day 0 and at day 2 after ISO injection (Fig. 1). This regimen of CoPP administration was based on previous studies which demonstrated that the maximum upregulation of HO-1 occurred after 48 h of CoPP administration [1516].
ECG recording
Basal ECG recording was performed two days before MI induction and repeated 24 h after second ISO injection and finally at day 5 before sacrifice. ECG recording was done by Biopac Lab System (software BSL 3.7.5; Biopac Systems, Goleta, CA, USA), data acquisition unit MP45, Biopac electrode lead set × 2, and disposable vinyl electrodes, 3 electrodes per rat. Details of the process of ECG recoding were described in our previous work [17]. After recording, files were saved for analysis and we commented on heart rate (HR), QT interval and ST segment deviation. Corrected QT (cQT) interval was estimated to avoid the effect of HR changes on QT interval. It was calculated from the following formula; [18]

Collection of blood samples and heart tissues
Blood samples
Blood samples were taken from the ophthalmic venous plexus of rats using Pasteur pipette under halothane light anaesthesia. The blood was collected in test tubes and centrifuged at 2,000 revolutions per min (rpm) for 10 min to obtain serum. Then sera were frozen and stored at −20℃ for estimation of cardiac enzymes.
Heart tissues
At the end of the experiment, the animals were sacrificed and the heart was harvested as described by El-Wakf et al. [18]. The heart was rapidly dissected into two halves, one half was weighed and dissected into 2 pieces, one piece was preserved in immediately in RNase (ribonuclease) free tubes for real time polymerase chain reaction (PCR) and the second piece for assay of oxidative stress. Both pieces were stored in liquid nitrogen. The second half of the heart was soaked in 10% neutral formalin to be used later for histopathological and immunostaining studies.
Measurement of serum lactate dehydrogenase (LDH) and creatine kinase-muscle/brain (CK-MB)
Serum LDH was measured by LDH sensitive kit purchased from ELITech Diagnostics (Cat# LDPH-0030; Puteaux, France), while serum CK-MB was measured by CK-MB sensitive kit purchased from Elabscience® (Cat# E-EL-R1327; Houston, TX, USA).
Assessment of oxidative stress markers and HO-1 in heart tissues
Tissue homogenization
A small part of the left ventricle was separated, homogenized in 0.02 M sodium phosphate buffer, pH 7.4 (1:4 wt/vol) using a Ultra-Turrax (Thermo-Fischer, New York, USA) smooth glass homogenizer with a motor driven Teflon pestle (Thermo-Fischer, New York, USA) and centrifuged at 3,000 rpm for 20 min at 4℃. The supernatant was used for assay of reduced glutathione (GSH) and superoxide dismutase (SOD).
Determination of myocardial GSH and SOD activity
Myocardial GSH was measured using kits purchased from Biodiagnostic (Cat# GR 25 11; Giza, Egypt), and SOD activity was determined using kits purchased from Biodiagnostic (Cat# SD 25 21).
Real time PCR technique for HO-1 messenger RNA (mRNA) expression
RNA extraction was done by RNeasy mini kit purchased from QIAGEN Sample and Assay Technologies in Hilden, Germany (Cat# 74104 AND 74106), then NanoDrop 2000 Spectrophotometer was used to check the purity and determine the concentration of isolated RNA, followed by cDNA synthesis using Sensi-FASTTM cDNA synthesis kits purchased from Bioline Co. (Nottingham, UK) (Cat# BIO-65053).
Real-time PCR reactions were done on Thermo Fisher Scientific device (SN: PR0961201124; Vantaa, Finland), using Sensi-FASTTM SYBR® No-ROX (2X), Bioline Co. (Cat#: BIO-98002). The used HO-1 gene-specific primers were: F: CGTGCAGAGAATTCTGAGTT and R: AGACGCTTTACGTAGTGCTG. The reference gene β-actin primer was F: CCTGTATGCCTCTGGTCGTA and R: CCATCTCTTGCTCGAAGTCT purchased from Oligo™ Macrogen (Lab. Technology). A total of 20 µl volume final reaction mixture containing 10 µl SensiFASTTM SYBR® No-ROX (2X) buffer, 5 µl cDNA, 0.8 µl HO-1 gene forward and Revers primers. The cycling protocol was; polymerase activation at 95℃ for 5 min, followed by 40 cycles of 3-step reaction (10 s denaturation at 95℃, 10 s annealing at 69℃, and 15 s extension at 72℃). A no-template control (NTC) reaction was also performed to identify any DNA contamination. Melting curve analysis was done to check RT PCR product's specificity. ΔΔCt was calculated and used to determine the relative quantification of HO-1 gene expression. all data were normalized relative to B actin gene mRNA as an internal control and also to the control group.
Histopathological study
Details of processing of heart specimens for routine histopathological examination by hematoxylin and eosin and scoring of the myocardial lesions were described a previous study by our research team [17]. Histopathological findings were graded into i) no changes; ii) mild damage, heart tissues show focal myocardial damage or small multifocal degeneration with slight degree of inflammatory cell infiltrate; iii) moderate damage, heart tissues show extensive myofibrilary degeneration and/or diffuse inflammatory cell infiltrate; and iv) marked damage, heart tissues show marked diffuse necrosis with diffuse inflammatory cell infiltrates. Then rats were stratified into 3 groups according to these histopathological changes: group A, no histopathological change; group B, mild histopathological change; and group C, moderate and/or severe histopathological changes.
Immunohistochemistry for Cx-43 and Hsp70
Antigen retrieval was done by immersion of the slides in Tris/ethylenediaminetetraacetic acid (pH 9.0) solution for 20 min in a water bath at 90℃ and for Hsp70 in sodium citrate (pH 6.0) solution for 15 min at 100℃ for 15 min in water bath. Then tissue sections were blocked in 10% goat serum in PBS-T (0.2% Triton X-100) for 1 h and sections were incubated overnight with primary rabbit polyclonal anti-Hsp70 (Cat# NBP1-35969; Novus Bio, Centennial, CO, USA) (diluted 1:50) and with rabbit polyclonal anti-rat Cx-43/GJA1 antibodies (Cat# ab11370; Abcam, Boston, USA) (diluted 1:100) overnight. After several washes with PBS, this was followed by biotinylated secondary antibody incubation for 10 min, then the avidin-biotin-peroxidase complex was added for 10 min at room temperature. All the sections were washed several times with PBS between each incubation, and labeling was then revealed by diaminobenzidine kits (CELL MARKE, Cat# 957D-30, Rocklin, CA, USA) which was used as a chromogen. Slides were counterstained with Mayer's hematoxylin, dehydrated and cover slipped. The images were taken by light microscope (Olympus, Tokyo, Japan).
Quantification of immunostaining by computer assisted digital image analysis (digital morphometric study)
Slides were photographed using Olympus® digital camera installed on Olympus® microscope with 1/2× photo adaptor, using 40× objective. The result images were analyzed on Intel® Core I3® based computer using VideoTest® Morphology® software (Video Test, St. Petersburg, Russia) with a specific built-in routine for area measurement. Two slides from each rat were prepared, 5 random fields from each slide were analyzed. The % of positively stained area (region of interest) was calculated in relation to total field area.
Statistical analysis
Data were tabulated, coded then analyzed using the computer program SPSS (Statistical package for social science) version 23.0 (IBM Corp., Armonk, NY, USA). The descriptive statistics were calculated as mean ± standard deviation. One-way ANOVA (analysis of variance) was used to compare between more than two groups of numerical (parametric) data followed by Tukey post-hoc test. Repeated measures ANOVA was used to compare between more than two related groups of numerical (parametric) data followed by post-hoc Bonferroni A. A p-value less than 0.05 was considered statistically significant. Pearson correlations was done between HO-1 expression and the other studied parameters.
RESULTS
Effects of CoPP on ECG parameters (HR, cQT interval and ST segment) in ISO-induced MI
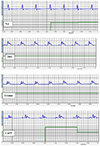
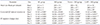
At basal day, the values of HR, cQT interval and ST segment were comparable in all experimental groups. At days 2 and 5, HR, cQT interval and ST segment were significantly elevated in ISO and ISO + Trizma groups when compared to NC group, while these parameters were significantly reduced in ISO + CoPP group compared to ISO and ISO + Trizma groups at day 5 (p ≤ 0.001) (Table 1). Figs. 2A–D are representative samples of ECG records from different groups at day 5.
Effects of CoPP on cardiac enzymes (LDH and CK-MB) in ISO-induced MI
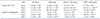
The basal values of serum LDH and CK-MB in all studied groups were comparable. At days 2 and 5, serum levels of LDH and CK-MB were significantly higher in ISO, ISO + Trizma and ISO + CoPP groups than NC group (p ≤ 0.001) and in ISO and ISO + Trizma groups than ISO + CoPP group (p ≤ 0.001). There were no statistical significant differences between ISO and ISO + Trizma groups (Table 2).
Effects of CoPP on myocardial antioxidants (GSH and SOD) in ISO-induced MI
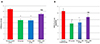
Compared to NC, the concentration of GSH and activity of SOD showed significant decrease in ISO, ISO + Trizma and ISO + CoPP groups (p ≤ 0.001). On the other hand, GSH and SOD activity were significantly increased (p ≤ 0.001) in ISO + CoPP group compared to ISO, ISO + Trizma groups. There were no statistical significant differences between ISO and ISO + Trizma groups (Fig. 3).
Effect of CoPP on expression of myocardial HO-1 mRNA in ISO-induced MI
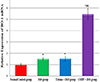
There was significant increase in relative expression of HO-1 mRNA in ISO and ISO + Trizma groups (p < 0.01) and marked significant increase in HO-1 relative expression in ISO + CoPP group compared to other studied groups (p < 0.001) (Fig. 4)
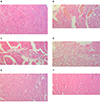
Effects of CoPP on cardiac morphology in ISO-induced MI
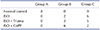
The score of heart histopathological damage score from NC group all rats belong to score A. In ISO and ISO + Trizma groups, most of rats (6 of 8) became score C. ISO + CoPP group showed significant decrease in the damage; most of rats score became B (6 of 8) (Table 3). Fig. 5A shows the normal architecture of the rat myocardium in NC group, while Fig. 5B, C show infracted zone with interstitial edema and neutrophil infiltration which are characteristic to acute extensive fibrillary degeneration in ISO group. The same changes were found in ISO + Trizma group (Fig. 4D). While heart tissues obtained from ISO + CoPP group showed mild degenerative changes of myocardial tissue (Fig. 5E, F).
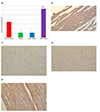
Effects of CoPP on myocardial Cx-43 expression in ISO-induced MI
Fig. 6A show significant decreased in Cx-43 in ISO and ISO + Trizma groups in compared to NC group (p < 0.001). Also, its expression become significantly increase in ISO + CoPP group compared to ISO and ISO + Trizma groups (p < 0.001). The Cx-43 protein in the myocardium of the normal control showed a color of light brown and the cardiomyocytes showed punctate distribution pattern or a rod-shaped in end to end connection (intercalated disc) and side to side connection (Fig. 6B). On other hand, ISO and ISO + Trizma groups showed less punctate or rod shaped Cx-43 in the cardiomyocytes (Fig. 6C, D), while ISO + CoPP group have considerable more rod-shaped or punctate Cx-43 in the cardiomyocytes. More Cx-43 can be found in intercalated disc than in side to side connection of cardiomyocytes (Fig. 6E).
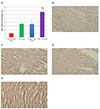
Effects of CoPP on myocardial Hsp70 expression in ISO-induced MI
Fig. 7 shows significant increase in Hsp70 in ISO and ISO + Trizma groups compared to NC group (p < 0.001). Also, its expression become significantly increase in ISO + CoPP group compared to ISO and ISO + Trizma groups (p < 0.001). The Hsp70 protein in the cardiomyocytes of the normal control showed light cytoplasmic brown color (Fig. 7B). On other hand, ISO and ISO + Trizma groups showed moderate increase in Hsp70 expression in the cardiomyocytes (Fig. 7C, D), while ISO + CoPP group have considerable marked brown colour in the cardiomyocytes (Fig. 7E).
Correlations between HO-1 expression and other studied parameters
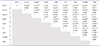
Table 4 shows that HO-1 shows positive correlations with Cx-43 and Hsp70 and negative correlations with ST segment, cQT interval, serum LDH and serum CK-MB with non-significant correlation with SOD and GSH. On the other hand, Cx-43 shows positive correlation with HO-1, Hsp70, SOD and GSH with negative correlations with serum LDH, serum CK-MB, ST segment and cQT interval. The same occurred regarding Hsp70.
DISCUSSION
The main findings of the present study include i) administration of ISO at a dose of 150 mg/kg body weight caused significant deteriorations in cardiac morphology, ECG parameters and cardiac enzymes with reduction of the endogenous antioxidants and Cx-43 and mild upregulation of HO-1 and Hsp70 in heart tissues; and ii) upregulation of HO-1 by CoPP was associated significant improvement in cardiac enzymes, cardiac morphology, disturbed ECG parameters, endogenous antioxidants and expression of Cx-43 and Hsp70 in myocardium. We hypothesized that HO-1 induction by CoPP could improve the cardiac functions, morphology and ECG changes in ISO-induced MI.
In the present study, we found mild upregulation of HO-1 in heart tissues in ISO group. This effect might be due to oxidative stress induced by large dose of ISO or due to direct effect of ISO. In line with this hypothesis, Hu et al. [19] and Otterbein et al. [20] demonstrated that ISO could be induced in response to a variety of stimuli and injury, such as oxidative stress and myocardial ischemia/reperfusion (I/R) injury in several organs and cell types. Also, activation of β1-adrenoreceptors by ISO causes significant increase in cyclic adenosine monophosphate (cAMP), which in turn activates protein kinase A [21], and stimulates phosphoinositide 3-kinase (PI3K) and p38 mitogen activated protein kinase (MAPK) activity. Activated PI3K and p38MAPK make the transcription factor (nuclear factor-erythroid-related factor 2, Nrf2) to move to nucleus, where binding of Nrf2 to the antioxidant response elements promoter site, leads to the upregulation of HO-1 gene expression [22]. Moreover, the present study confirmed upregulation of HO-1 by CoPP administration. We showed that administration of CoPP at a dose of 5 mg/kg body weight every 48 h caused significant upregulation of HO-1 at the level of mRNA. The dose of 5 mg/kg and regimen of CoPP administration, i.e. single dose every 48 h were based on previous studies which reported that the maximum upregulation of HO-1 occurs within 48 h after CoPP administration [1516]. Previous studies demonstrated similar findings of HO-1 upregulation by metalloprotophyrins (CoPP) in other tissues such as kidney [14,23]. The upregulation of HO-1 by ISO was mild compared to that induced by CoPP as well as it was associated with marked increase in oxidative stress, that is why it had no protective effect.
In ECG recording, the present study found that ISO administration caused significant increase of the HR, prolonged cQT and elevated ST segment which are diagnostic features for MI [24]. These results are in line with those reported by Thippeswamy et al. [25] and Metias et al. [17]. Tachycardia demonstrated in ISO group could be due to disturbed sympathetic and parasympathetic inputs to the heart due to excessive stimulation of β1-adrenorceptor by ISO which also, causes deterioration of mitochondrial energetic and suppression of Ca+2 transport which causes intracellular Ca+2 overload [26]. Also, prolongation of QT interval in ISO group in the present study may be related to cardiac vagal dysfunction [27] or reduction of gap junction protein Cx-43 expression and their disorganization as shown in the present study. Also, ST-segment showed an elevation in ISO group which reflects myocardial inflammation and damage which causes “injury currents” from damaged cells that are partially depolarized to the healthy myocardium [28]. Moreover, we found in the present study, administration of CoPP significantly attenuated ISO-induced ECG changes suggesting that CoPP administration and HO-1 upregulation improved the myocardial electrical activity in ISO-induced MI. This is confirmed by the negative correlation between HO-1 and HR, ST segment elevation and duration of cQT interval. In line with these findings, Kusmic et al. [11], Pósa et al. [29] and Ndisang [30] demonstrated that HO-1 induction reduced the size and the thickness of the myocardial infarct, as well as preserved Cx-43 architecture in the remote zone.
The next point in the present study was to investigate the effects of ISO on serum levels of CK-MB and LDH. CK-MB isoenzyme activity is useful as an index for the early diagnosis of MI because it is present mainly in myocardial tissues [31]. Also, serum CK-MB is considerably more specific for myocardial damage than the serum total CK [32]. It has reported that serum CK-MB concentration rise starts to develop 4 ± 6 h after injury, reaching its peak after 12 ± 24 h and decrease after 48 ± 72 h. The present study demonstrated that significant increase serum CK-MB at 24 h after second dose of ISO, i.e. at day 2 with significant reduction at day 5. Similar findings were reported by Bodor [33] and Metias et al. [17]. The significant elevation in CK-MB could be due to leakage of CK-MB enzymes via damaged myocardial cell membrane or its rupture due to necrotic cell death. The same changes occur in serum LDH which is a cytosolic enzyme that is present in all the tissues involved in glycolysis. LDH activity increases after about 18 h post MI, peaks between the second and third day and remains elevated for about a week [30]. Our results are in line with those reported by Bodor [33] and Metias et al. [17]. Panda and Naik [34] explained the significant elevation in serum LDH in ISO group by necrotic damage of myocardial cells by reactive oxygen species (ROS) as shown in our study. In line with biochemical changes in ISO group, histopathological examination revealed significant myocardial damage in the form of focal necrotic lesions, interstitial hemorrhage and edema with marked inflammatory cell infiltrates (polymorph granular leucocytes and neutrophils). These findings are in agreement with those reported by Zhou et al. [35], Liu et al. [36] and Metias et al. [17]. Myocardial damage and necrosis could be explained by excess O2 consumption, poor O2 utilization, cytosolic overload and accumulation of Ca2+, excessive production of ROS, altered membrane permeability, altered myocardial cell metabolism, increased myocardial cAMP levels and intracellular acidosis [313738].
On the other hand, we found that administration of CoPP caused significant improvement in the serum levels of cardiac enzymes (LDH, CK-MB) and cardiac morphology suggesting cardioprotective effects for CoPP and HO-1 upregulation against ISO-induced MI. Moreover, the negative correlation between serum LDH and CK-MB levels and HO-1 level might confirm this suggestion. In line with these findings, Woo et al. [39] demonstrated that overexpression of HO-1 was associated with longterm acceptance of mouse-to-rat cardiac transplants. Also, Katori et al. [40] demonstrated that donor hearts from HO-1-deficient donors were vigorously rejected. In kidney tissues, Barakat et al. [14] demonstrated upregulation of HO-1 by CoPP had renoprotective effect against renal ischemia. Also, chronic induction of HO-1 showed hepatoprotective effects against liver ischemia in rats [41] and controlled the renal hemodynamics and excretory functions during renal ischemia [42].
Myocardial oxidative stress in ISO-induced MI results from disturbed physiological balance between formation of free radicals and anti-oxidative defense system [35] via formation of adrenochromes such as quinones through auto-oxidation of ISO which are implicated for generation of highly toxic O2 free radicals such as superoxide (O2−) and hydrogen peroxide (H2O2) [43]. Also, Ca2+ overload and their consequences are crucial in ISO-induced injury and generation of ROS [44]. ROS attack the cell membrane phospholipids and fatty acids producing lipid peroxides that are longer-lived species than ROS and can initiate the chain reactions that enhance the oxidative damage to the cells [45]. Moreover, this oxidative stress causes depletion of the anti-oxidant systems such as reduced GSH and SOD as shown in the present study. The reduction in GSH levels observed in ISO-induced MI was either due to excessive destruction or decreased GSH synthesis. The concentration of GSH is kept constant inside the cells by the activity of glutathione peroxidase enzyme which convert the oxidized form of glutathione to reduced form (GSH) [34]. Also, reduction of the activity of the SOD in ISO-induced MI might be due to the increased generation of reactive oxygen radicals, such as O2− and H2O2, which in turn leads to the inactivation of this enzyme activity.
HO-1 plays an important role in maintaining redox status within the heart, thereby protecting against oxidative insult. In the present study demonstrated that CoPP treatment caused significant increase in antioxidant (GSH and SOD) in the myocardium than ISO group. Moreover, there are positive correlation between HO-1 and GSH and SOD activity. These findings suggest antioxidant role for CoPP administration. In consistence with these findings, Barakat et al. [14] demonstrated significant reduction in malondialdehyde (marker of lipid peroxidations) and increase in antioxidants such as SOD in kidney tissues during renal I/R injury. This effect may be due to HO-1 is a major antioxidant enzyme that plays a vital role in the defense against free radical-induced oxidative damage in human skin cells [46]. Moreover, Shan et al. [47] reported that COPP induces up-regulation of the transcription factor nrf-2 which in turn induces many antioxidant defense mechanisms to mitigate oxidative damage and maintain the cellular redox homeostasis [48].
Gap junction proteins such as Cx-43 are predominately expressed in the intercalated discs and to less extent at the lateral sides of the ventricular myocytes [49]. It has been demonstrated that myocardial ischemia causes redistribution of Cx-43 along the lateral plasma membrane away from the intercalated disk region [50]. In the present study we reported similar findings in ISO-induced myocardial injury. The lateralized Cx-43 is dephosphorylated, whereas phosphorylated forms remain at the intercalated disk region [51]. These ischemic changes in Cx-43 phosphorylation are followed by loss of Cx-43 due to degradation [52] leading to development of cardiac arrhythmias. In the present study we demonstrated significant reduction in Cx-43 expression in ISO group which partially explain the cardiac arrhythmic changes induced by ISO. Metias et al. [17] reported similar changes in Cx-43 in ISO-induced MI. Also, Sun et al. [53] concluded that the reduction and redistribution of myocardial Cx-43 might be mediated by ATP-sensitive potassium channels through preserving protein kinase C-dependent connexion-43 level after MI. Disruption of myocardial Cx-43 in the present study might be explained by enhanced oxidative stress in the heart tissues. In our study we demonstrated upregulation of Cx-43 in CoPP-treated rats as well as we found positive correlation between HO-1 and Cx-43 expression suggesting that upregulation of gap junction protein Cx-43 might represent a possible underlying mechanism for the cardioprotective role of CoPP administration and HO-1 upregulation. In agreement with these findings, Lakkisto et al. [15] demonstrated that Wistar rats treated with hemin (a potent inducer of HO-1) prevented the arrhythmias and the reduction in total Cx-43 induced by I/R injury. Also, Schulz et al. [54] found that hypoxia cause dephosphorylation of Cx-43, whereas ischemic preconditioning with the HO-1 inducer hemin preserves phosphorylation of Cx-43 and reduces infarct size in I/R pig hearts.
Shock proteins (Hsps) are intracellular cytoprotective proteins which are essential for cell survival both in physiological and stress conditions [55]. The most important cytoprotective Hsp is Hsp70. It has been reported that overexpression of Hsp70 could protects the heart against damaging effects of ischemia. Also, Hsp70 overexpression represents a protective mechanism not only in acute settings, e.g. I/R injury after coronary bypass grafting, but also in patients with chronic “stress”, as in congestive heart failure [56]. So, overexpression of Hsp70 could represent an innate protective mechanism which helped to restore physiological conditions [55]. In line with these findings, we reported there was upregulation of Hsp70 in myocardium compared to normal hearts. These findings are parallel with those reported by Li et al. [57]. In agreement with our results, Tanwar et al. [58] demonstrated that ISO and norepinephrine can induce production of Hsp70 in angiotensin II-induced myocardial injury via activation of sympatho-adrenal system. Also, Tanonaka et al. [59] reported that reduction of Hsp70 in heart tissues may play a significant role in reduction of the contractile function during the development of heart failure in a rat model. We postulated that the upregulation of Hsp70 in the present study was by increased oxidative stress in myocardium. Also, in the present study, we demonstrated that CoPP treatment caused significant increase in Hsp70 in heart tissues and positive correlation between HO-1 and Hsp70 suggesting that upregulation of Hsp70 might be a potential mechanism for the cardioprotective action of CoPP and HO-1 induction in ISO-induced MI. In fact, HO-1 was previously known as Hsp32 which is a member of Hsp family.
Another mechanism for HO-1 upregulation explained its cytoprotective such as its antiapoptotic action. Lakkisto et al. [60] demonstrated that upregulation of HO-1 inhibits apoptosis both in vitro and in vivo. Also, Katori et al. [40] found that CoPP administration decreased frequency of apoptotic cells (both myocyte and endothelial) in cardiac isografts. Indeed, adjunctive treatment with zinc protoporphyrin, an HO-1 enzyme activity inhibitor, prevented the expression of B-cell lymphoma 2 (Bcl-2) and delayed the expression of Bag-1 (Bcl-2 associated athanogene 1) antiapoptotic [40]. However, this mechanism was not investigated in the present study which may be considered as a limitation of this study and further studies may be needed to explore this mechanism for HO-1 upregulation.
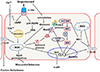
We concluded that administration of ISO at a dose of 150 mg/kg caused marked deteriorations in cardiac functions and morphology, which was associated with signs of MI in ECG, reduction of myocardial antioxidants, Cx-43 proteins and upregulation of Hsp70. Upregulation of HO-1 by CoPP had a cardioprotective action against ISO induced myocardial injury, which might be due to increased myocardial antioxidant capacity and upregulation of gap junction proteins (Cx-43) and Hsp70 (see Fig. 8, graphical abstract).
 XML Download