

 PDF
PDF ePub
ePub Citation
 Print
Print


INTRODUCTION
Epilepsy is a chronic neurological disorder affecting about 50 million people worldwide [1]. It is a group of diseases characterized by spontaneous recurrent seizures, suggesting that epilepsy is a spectrum disorder [23]. Although multiple causes including high fever, brain tumor, stroke, and traumatic brain injury can contribute to epilepsy [4], no specific, unified diagnostic tools have been developed to differentiate the types of epilepsy. Currently, electroencephalography (EEG) is the principal test used to identify seizures, with the aid of brain imaging modalities [5]. EEG is a non-invasive test that can depict macroscopic electrophysiologic activities in the brain, helping to detect seizures and spikes and localize seizure foci [6789]. Due to its superior temporal resolution, low cost, and lack of safety restrictions, EEG is an essential resource in both epilepsy clinics and research, even though it has poor spatial resolution and high noise.
Approximately 40% of epilepsy patients are refractory to pharmacological treatments [10]. To find clues to a cure for epilepsy, various animal models of epilepsy have been developed to recapitulate abnormal epileptiform discharges and investigate critical biochemical and genetic factors during epileptogenesis [11]. EEG monitoring is also valuable for examining diverse types of seizures in experimental epileptic animals. Although clinical scalp EEG datasets are limited by factors such as low signal intensity or high noise in EEG signals, invasive electrocorticography can be easily applied in experimental settings, allowing more accurate measurement of abnormal brain activity. Moreover, long-term EEG recordings up to several months covering multiple seizure clusters can be collected in an experimental setting. These advantages enable researchers to better assess the epileptogenic potential and individual variations of each seizure pattern. However, large data volumes from long-term EEG recordings require extensive labor to review and may result in unexpected omission of seizures. Therefore, in the present study, we developed an automated seizure event detection algorithm based on deep neural networks for long-term experimental EEG recordings.
The difficulties in analyzing EEGs come from their non-stationary and non-linear nature [1213]. To overcome these obstacles, many different feature extraction methods have been devised for automated seizure detector based on classic machine learning [14]. However, since deep learning is a representation learning system that can extract innate features necessary for distinguishing differences among datasets [15], complex feature extraction processes can be avoided when developing EEG classifiers. Thus, in this study, we investigated whether we can create a deep learning-based system with high sensitivity and specificity for detecting seizure events from EEG traces. To achieve the best seizure detection rate and low computational cost, we devised two consecutive deep neural network classifiers coupled with a few pre- and post-processing schemes. Our automated seizure event detector could identify all seizure events (no false negative [FN] results), with only 4 false positive (FP) events for the training dataset and 6 for the test dataset. Moreover, it could inspect all EEG traces (8,977 h) in only 2.28 h with a personal computer. Our new algorithm showed high fidelity seizure detection with low computing cost that can facilitate epilepsy research by lowering the labor intensity and entry barrier for researchers studying epilepsy.
METHODS
Animals
All mice were bred and housed in an animal facility with a 12-h light, 12-h dark cycle with food and water ad libitum. The animal experiments were approved by the Ethics Committee of the Catholic University of Korea and were carried out in accordance with the National Institutes of Health Guide for the Care and Use of Laboratory Animals (NIH Publications No. 80-23). To include various convulsive seizures, three different mouse strains (non-transgenic, conditional knockout, and reporter lines) were used. Male C57BL/6N mice were purchased from Envigo Laboratories (Koatech, Pyeongtaek, Korea). Nestin-Cre;Lin28A+/+ (Lin28A wild-type) and Nestin-Cre;Lin28AloxP/loxP (Lin28A conditional knockout; cKO) mice were generated as conditional knockouts. For a reporter mouse line, Prox1-eGFP was used. Transgenic mice were genotyped by PCR with specific primers to detect cre (5′ GGT CGA TGC AAC GAG TGA TGA GG 3′, 5′ GCT AAG TGC CTT CTC TAC ACC TGC G), Lin28A (5′ TCC AAC CAG CAG TTT GCA G 3′, 5′ GCA GCT GGT AAG AAG AAA CCT G 3′), and eGFP (5′ GAT GTG CCA TAA ATC CCA GAG CCT AT 3′, 5′ GGT CGG GGT AGC GGC TGA A 3′).
Mouse epilepsy model
The pilocarpine-induced status epilepticus model was generated as previously described [1617]. For C57BL/6 mice, epilepsy was induced in 2018, and, for the rest of the mice, it was induced in 2016. Mice at 6 weeks old were administered scopolamine methyl nitrate (intraperitoneally [i.p.], 2 mg/kg, Sigma-Aldrich S2250; Sigma-Aldrich, St. Louis, MO, USA) and terbutaline hemisulfate salt (i.p., 2 mg/kg, Sigma-Aldrich T2528) to inhibit peripheral effects of pilocarpine and dilate the respiratory tract, respectively. Thirty min later, pilocarpine hydrochloride (i.p., Sigma-Aldrich P6503) was injected. C57BL/6N and male Lin28A cKO mice received 280 mg/kg; male Prox1-eGFP, 285 mg/kg; female Prox1-eGFP, 295 mg/kg; and female Lin28A cKO mice, 300 mg/kg. In an incubator at 28℃ to 30℃, acute seizures were behaviorally monitored with a modified Racine's scale [18]. Once status epilepticus began, mice were placed at room temperature for 3 h, diazepam (10 mg/kg; Samjin Pharm, Seoul, Korea) was injected to terminate the seizure, and mice were returned to the incubator. To facilitate recovery, mice were given 5% dextrose (i.p., 1 ml) and water-moistened chow. At 2 days after pilocarpine injection, mice were returned to their home cages and housed until video/EEG monitoring. For sham-manipulated animals, all procedures were the same except they were administered normal saline (10 mg/kg) instead of pilocarpine.
Video/EEG monitoring
Video/EEG monitoring was conducted for 2 weeks between 4 and 7 weeks after pilocarpine injection as previously described [1920]. Specifically, 16 C57BL/6 mice had video/EEG recording at 4 to 6 weeks after pilocarpine injection, and 7 Lin28A cKO and 12 Prox1-eGFP mice were monitored at 5 to 7 weeks after pilocarpine injection. One week before starting EEG recording, mice were stereotaxically implanted with epidural recording electrodes placed at anteroposterior (AP) + 0.1 mm, mediolateral (ML) + 0.1 mm (reference) and AP − 0.2 mm, ML + 0.22 mm (cortical electrode) from bregma. Recording electrodes were connected to a wireless EEG transmitter (TA11ETAF10; Data Sciences International, New Brighton, MN, USA) placed subcutaneously on the back. Mice underwent continuous monitoring by a wireless video/EEG monitoring system (Data Sciences International). Convulsive seizures were defined by repetitive epileptiform spiking (≥ 3 Hz) that persisted for more than 3 sec and was confirmed by video recordings. Seizure activity was marked at the beginning and end of each event to train deep neural networks.
Preparation of datasets and deep neural networks
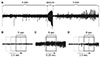
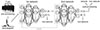
EEG data (total 4,704 h) recorded from non-transgenic C57BL/6 mice were used as a training set that contained 249 human-annotated seizure events corresponding to 1 h 52 min. The minimal seizure duration was 8.34 sec, and the maximum was 61.25 sec. The test set was 4,272 h of EEG recording from conditional knockout and reporter mice containing 324 seizure events totaling 2 h 35 min. In most studies investigating autodetection of seizures, N-fold cross-validation or leave-one-subject-out cross-validation was used to validate the classification. However, we purposely divided the 8,977 h EEG into training and test sets based on different genetic background and recording period to test the generalization of our classifier. For the selection of “seizure” and “non-seizure” datasets for the training, we collected non-seizure data from the 5 min of EEG before and after each seizure event (Fig. 1A) because the length of non-seizure EEG was 2,500 times longer than seizure EEG traces. As input data formats, we tested both raw EEG data and simple frequency-power distribution for 5-sec EEG segments. Since EEG data were collected at 1,000 Hz, raw EEG data had 5,000 data points as inputs. On the other hand, frequency-power distribution was obtained from periodogram results for 0 to 99 Hz range, resulting in 100 data points as inputs. Non-seizure data were split into 5-sec segments (Fig. 1B) using a 5-sec sliding window with half-overlapping segments. Seizure data were split into 5-sec segments but they were collected every 0.25 sec since seizure data were scarce (Fig. 1C). This process multiplied seizure data to minimize the size difference between seizure and non-seizure data. Our EEG data were not filtered through any band pass or notch filter. The only pre-processing applied to the data was the elimination of EEG traces containing strong noise signals with an amplitude over ± 2.5 mV. Periodograms of 5-sec segments of EEG data were obtained with the ‘spectrum’ module (https://github.com/cokelaer/spectrum) of Python programming language (https://www.python.org). We did not normalize input data. The deep neural networks were constructed and trained with the TensorFlow deep learning library (https://www.tensorflow.org). The rectified linear unit was used as an activation function, and one hot encoding was used to assign groups: (1,0) for seizure and (0,1) for non-seizure. The training dataset was further split into 90% training set and 10% validation set for the validation of training results. The network was trained with categorical cross-entropy as the loss function with Adam optimizer. The batch size was 250. The computer system for training was a personal computer with an Intel i7-8700 CPU (Intel, Santa Clara, CA, USA), 16 GB memory (Samsung Electronics, Suwon, Korea), and NVIDIA GeForce GTX 1080Ti graphics card (NVIDIA, Santa Clara, CA, USA). Due to infrequent convulsive seizures in the pilocarpine model of epilepsy, the first deep neural network experienced only 0.92% of the entire training EEG dataset as the sum of each seizure and its pre-/post-segments compose a small portion. Thus, a second deep neural network was introduced to exploit the remaining data. The entire 4,704 h of training EEG data was split into half-overlapping 5-sec windows (Fig. 1D), and each segment was classified by the first network. The 5-sec segments that were classified by the first network as a seizure but did not coincide with the human annotations, i.e., FP results, were defined as new, non-seizure training data. The second deep neural network was trained with the new, non-seizure training data and the original seizure training data. To determine optimal size of hidden layers, different combination of network sizes were explored.
Algorithm for autodetection of seizure events
The autodetector for seizure events was built based on the classifier for 5-sec EEG segments. The autodetection procedure can be divided into three steps: pre-processing, classification with dual deep neural networks, and post-processing. Pre- and post-processing algorithms were derived from observing the basic properties of convulsive EEG seizure events. Half-overlapping 5-sec windows were moved through the entire EEG recording and provided sequential, 5-sec EEG segments for classification. Each 5-sec segment went through the following procedures for classification as seizure or non-seizure. Pre-processing was devised to reduce unnecessary computational load. First, EEG traces containing noise with amplitude over ± 2.5 mV were removed. Second, because the minimum mean absolute amplitude of 5-sec seizure segments was 0.029 mV, any segments with absolute mean amplitudes smaller than 0.025 mV were classified as a non-seizure. The mean absolute amplitude was used to meaningfully estimate EEG amplitudes because positive and negative signals in original EEG can negate each other if they are not converted to absolute values. Pre-processing eliminated about one-third of the EEG segments from further processing, significantly reducing the computational load. Then, the 0 to 99 Hz periodogram results of each 5-sec segment were calculated and fed into the first deep neural network. If the first network classified a periodogram as a non-seizure event, it was considered a non-seizure event, and the next 5-sec segment was analyzed. If the first network judged a periodogram as a seizure, it was re-evaluated by the second deep neural network. If the second network classified the segment as a non-seizure, it was considered a non-seizure despite the first network. If both the first and second networks classified the segment as a seizure, the segment was joined with nearby seizure segments to form a seizure event. After scanning whole EEG, the collected seizure events underwent post-processing. As experimental convulsive seizures generally have higher amplitudes than preictal and postictal EEG (Fig. 1A), our post-processing procedure searched for abrupt amplitude changes to find the beginning and end of a seizure event. If post-processing found an amplitude difference greater than 1.2 fold change compared to the surrounding EEG amplitudes, the EEG segments were finalized as a seizure event. However, if the amplitudes around the seizure segments did not change, it was reclassified as a non-seizure event. Taken together, to be considered a seizure, all three steps, the first and second networks and post-processing, had to agree. Disqualification during any of these steps resulted in a non-seizure classification. The post-processing greatly reduced the number of FP events, although an abrupt increase in amplitude itself does not indicate seizure activity. In fact, our trial to classify seizures based on just amplitude changes resulted in a huge number of FPs (data not shown).
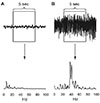
RESULTS
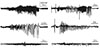
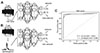
In this study, we tried to develop a reliable and efficient seizure event detector for experimental EEG data. As shown in Fig. 2, convulsive seizure activities, which are rare events in long-term, continuously recorded EEG, had various EEG shapes, amplitudes, and durations. Thus, we first developed a classifier that can classify short EEG traces into seizure or non-seizure segments. Then, seizure event detector was built based on the segment analysis. We implemented deep neural networks as an EEG segment classifier since exhaustive feature extraction and selection processes, which are prerequisites for other machine learning techniques, can be avoided. Deep neural networks can be end-to-end classifiers that receive raw data as inputs and do all the feature extraction and classification [15]. Therefore, we initially used raw EEG data for 5-sec segments as input data (Fig. 3A). The 5-sec EEG segmentation was widely adopted from previous studies for seizure detectors [2122]. We organized deep neural networks with two hidden layers and tested various combinations of hidden node numbers to find out the optimal network structure generating the best classification results. When we plotted receiver operating characteristics (ROC) curve for the classifier of raw EEG inputs, the best result for area under the curve (AUC) was 0.972 (Fig. 3C). In spite of impressively high AUC, the number of FP seizure segments was about 150,000 when cut-off threshold for seizure and non-seizure classification was 0.5. The high AUC was obtained because of the many true negative non-seizure segments (8,261,274) in EEGs (Table 1). Although deep learning is representation learning, the 5,000 raw EEG inputs may be too coarse for a classifier, since each point may have a low signal-to-noise ratio considering the innate noises in EEG recording. Thus, we tested simple frequency-power distribution of 5-sec EEG segments as inputs for a new deep neural network (Fig. 3B). Since both physiological and epileptic brain rhythms mainly have frequency bands less than 100 Hz, we obtained periodogram results between 0 and 99 Hz to demonstrate frequency-power distribution (Fig. 4). When periodogram results were used instead of raw EEG traces, the AUC could improve to 0.980, in addition to the reduction of FP numbers that was diminished more than 40% to 87,614. Computational cost for periodogram could be negated due to much smaller input number (100 for periodogram vs. 5,000 for raw EEG data). Taken together, we concluded that simple frequency-power distribution could be more suitable for deep learning to classify seizure segments compared to raw EEG data. We then used periodogram results for further investigation. Although periodogram yielded better results, FP number was still too high. We speculated that the high FP number might come from relatively small non-seizure training dataset compared to the entire EEG data. Because we collected non-seizure training data from the 5 min of EEG traces before and after each seizure event, our classifier could experience less than 1% of non-seizure EEG in the training dataset. Thus, we trained the second deep neural network using untrained non-seizure EEGs to make it specialize to distinguish the data that the first network failed to classify. The 87,614 FP segments obtained from the first network were used as a new non-seizure training data with the original seizure training data to train the second network. When we classified the training EEG data by sequential applications of the first and second networks (Fig. 5), AUC was improved to 0.992 (Fig. 6A) and FP number was decreased almost 98% to 1,596 (Fig. 6B). We could further decrease FP number to 112 by changing cut-off threshold for seizures to 0.99 and 0.90 for the first and second network, respectively (Fig. 6C). The classification results of 5-sec segments for whole training dataset were summarized in Table 1.
Next, we combined individual classification results for 5-sec segments to organize a seizure event detector. Because of the high variations in seizure EEG (Fig. 2), seizure events can contain one or two FN segments, resulting in separated seizure segments within a seizure event. Thus, we joined nearby seizure segments to form a seizure event when separated seizure segments were detected within 10 sec of EEG traces. This procedure effectively eliminated FN segment between true positive (TP) seizure segments composing a seizure event. Then, if the seizure event had 1.2 times higher amplitude compared to nearby EEG, the event was finalized as a seizure event. This post-processing effectively eliminated much of FP segments. When the final result was overlapped with human annotated seizure events, the autodetected seizure event was regarded as a TP seizure event.
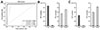
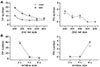
To determine the optimal structure of the second network for seizure event detection, we tested multiple variations in hidden layers (Fig. 7A). The first hidden layer was tested with 200, 300, 400, 500, and 600 nodes. The second hidden layer had one fourth as many nodes as the first hidden layer. We trained each network structure three times and let each detect seizure events in all 4,704 h of training data and 4,272 h of test data. The number of FP and FN events was compared. We obtained the number of FPs and FNs for both the training and test data sets to gain insight on the generalization ability of the network structures (Fig. 7A). FP events generally decreased with an increase in hidden nodes: 10.3 ± 0.8, 5.6 ± 0.3, 4.6 ± 0.3, 4.3 ± 0.3, and 6.0 ± 0.5 FPs for the training set and 19.3 ± 0.8, 12.6 ± 0.8, 10.6 ± 0.6, 6.3 ± 0.3, and 7.3 ± 0.3 FPs for test set with 200, 300, 400, 500, and 600 nodes, respectively, in the first hidden layer of the second network. FN events also decreased: 1.3 ± 0.3, 1.0 ± 0.0, 0.6 ± 0.3, 0.0 ± 0.0, and 0.0 ± 0.0 FNs for the training set and 1.6 ± 0.3, 0.6 ± 0.3, 1.0 ± 0.0, 0.0 ± 0.0, and 0.0 ± 0.0 FNs for the test set with 200, 300, 400, 500, and 600 nodes, respectively. We found that FP events were lowest with 500 nodes, and FN events reached 0 with 500 nodes. As the best result was obtained with 500 nodes, we used this network to further investigate the characteristics of our seizure event autodetector algorithm. In addition to network size, window size for spectral analysis can be a main determinant of the classifier functionality. Thus, we investigated the effects of window size on FPs and FNs (Fig. 5B). FP events for 2-, 5-, and 8-sec windows were 60.6 ± 3.2, 4.3 ± 0.3, and 2.0 ± 0.5 for the training set and 56.3 ± 1.7, 6.3 ± 0.3, and 2.6 ± 0.3, respectively, for the test set. FN events were only present with an 8-sec window: 2.6 ± 0.3 and 3.6 ± 0.6 for the training and test sets, respectively. Taken together, our data clearly demonstrated that a 5-sec window led to the best results with no FNs and acceptable FPs, for constructing a seizure event autodetector based on spectral analysis.
DISCUSSION
Automated seizure detection frameworks based on machine learning have been proposed for many years [14]. These approaches have heavily depended on the development of different feature extraction methods since carefully selected features were important for classifying inputs in classic machine learning. In the early stages of EEG analysis, fast Fourier transform (FFT)-based spectral analysis was a main tool to define seizures [2324]. Periodograms were widely used to determine the power density of frequency components in EEG signals. However, as researchers began to realize that EEG is highly non-stationary and non-linear [1213], tools to analyze the time-frequency domain, including wavelet transform, were used for automated seizure detection from EEGs [825]. Non-linear EEG analyses were also applied for the automated detection of epileptic discharges [2627]. Since a single parameter was not satisfactory to capture the complicated seizure characteristics, many multi-domain features have been combined to distinguish seizure and non-seizure EEGs [1421282930]. In these studies, principal component analysis was frequently used to determine relevant feature combinations, for helping classifiers such as support vector machine to classify seizure events. However, exhaustive feature selection processes inevitably required high-level engineering skills and domain-expertise in addition to a high computational burden that can cause extensive time-consumption especially for long-term, continuous EEG recordings. To circumvent the limitations of current feature extraction methods, a deep neural network that can act as both a feature extractor and classifier was recently introduced for seizure detection [31] and prediction [32]. For seizure detection, Ansari et al . [31] used a convolutional neural network to detect seizures from raw EEG inputs. Although their network could classify seizures without laborious feature extraction, they filtered EEG data with cut-off frequencies of 0.5 and 12.8 Hz and sampling rates of 32 Hz, which may oversimplify the EEG dataset. Thus, we tested raw EEG and simple spectral analysis results as inputs to utilize the information from wider EEG signal frequency ranges with fully connected deep neural networks. Despite both raw EEG and periodogram results showed a suitable ROC curve, we chose to build a seizure event detector based on spectral analysis since it showed better ROC curve and lower FP results.
To achieve good classification of seizures, sophisticated construction of a classifier is critical. First, we tried to train a single, fully connected deep neural network with various layer depths and numbers of nodes. However, using seizure and 5 min of preand post-seizure EEG as training data, this single network approach yielded too many FP results for the whole training EEG datasets, even though the validation accuracy for training data was high (best validation result was 99.34%). Possible explanations for the unsatisfactory results are limited experience of the single deep neural network on EEG signals and subsequently missing dynamic pattern changes in EEG recordings. Since we speculated that these limitations might cause poor discrimination of seizure and non-seizure EEGs in the whole dataset, we adopted sequential dual deep neural networks. The core concept was to train the second network with non-seizure training datasets that were FP results of the first network. The FP results were obtained by letting the first network screen the entire training set through half-overlapping, 5-sec sliding windows. This way, characteristics of the full datasets could be included in training the second network. Finally, when we combined the first and second networks, the number of FP decreased from 87,614 to 1,596 (Table 1), suggesting the excellent feasibility of our seizure classifier. When the cut-off threshold was adjusted properly, the number of FP could be decreased to 112. However, this result was not achieved with either network alone (Fig. 6A). In particular, the second network alone was far worse than the first network even though it was trained with more data. The reason for the poor performance of the second network alone can be explained by the nature of training dataset for the second network. The second network was trained with non-seizure data that the first network misclassified as seizures. Therefore, the second network could be specialized for discriminating confusing EEG traces that were misclassified by the first network but not optimized for typical non-seizure EEG traces. Taken together, these findings indicate that the two networks should be used sequentially to accomplish the best seizure classification.
One important precaution in deep learning is to avoid overfitting to training data. In this study, although the training and test sets had different backgrounds, the classification results from both datasets did not differ considerably (Fig. 7), indicating that our network was not overfit to the training dataset. Moreover, the numbers of FPs and FNs in the training and test datasets converged as the second network size gradually increased (Fig. 7A). These results suggest that our deep neural network could be generalized to differences between the periodograms of seizure and non-seizure EEGs without overfitting to training data.
Seizure detection systems must have high sensitivity, even if they produce some FP results, since neurologists and neuroscientists can easily differentiate true and FP seizures among epileptic discharges classified by deep neural networks [28]. Our seizure event autodetector had no FN, i.e., 100% sensitivity, suggesting a superior capability. We also adopted rule-based pre- and post-processing steps in addition to deep neural networks. These steps were based on seizure EEG characteristics. This approach markedly reduced processing time and provided a great accuracy for specifying the start and end of each seizure event. For example, our seizure event autodetector could classify 8,977 h of training and test EEG in only 2.28 h with a personal computer, meaning that more than 1 h of EEG data was scanned in 1 sec. Considering that an old system took 1 sec to calculate FFT for 1.28 sec EEG data [23], our autodetector could inspect large EEG datasets quickly and precisely with improved computing power and a machine learning algorithm.
A handful of seizure detection systems are commercially available for experimental animals. However, extremely detailed parameters are needed to distinguish seizures from baseline EEG traces, lowering the feasibility of automated seizure detectors. As discussed above, our seizure autodetector can discriminate between seizure and non-seizure EEGs with simple and basic feature extraction, which can reduce the exhaustive processes of manually defining seizures. Moreover, the exceptional sensitivity of our system can identify all convulsive seizure events. Since mastering EEG analysis requires substantial experience, automated seizure detection by artificial intelligence will greatly increase the accessibility of EEG interpretation to new researchers in the epilepsy field. In addition, automated detection can also save time over manual EEG analysis even for experienced investigators, as the initial selection of convulsive seizures has already been completed. In summary, our seizure autodetector, constructed by combining a basic feature extractor with dual deep neural networks and rule-based pre- and post-processing, can be a practical solution for all researchers interested in seizures and epilepsy.

 XML Download