

 PDF
PDF ePub
ePub Citation
 Print
Print


INTRODUCTION
Diabetes mellitus (DM) is the most common cause of erectile dysfunction (ED) as a single disease [1]. Because the development of DMED is assumed to be the accumulation of secondary changes due to continuous hyperglycemia, effective glycemic control could represent the most basic strategy for preventing and treating DMED [2345]. In addition, insulin has been used to regulate the blood glucose level in the majority of studies [3467].
However, it has been not studied whether the role of insulin is limited to lowering the blood glucose level. For that reason, some researchers to claim that the role of insulin is not restricted to the regulation of the blood glucose level, since it might also have far-reaching effects on the pathophysiology of DMED [48]. Actually, the insulin resistance observed in DMED has been closely linked to sympathetic nervous system activation and the disorder of nitric oxide synthesis [91011].
If this hypothesis concerning the role of insulin is true, the thorough control of DM by means of insulin therapy may represent a significant way of overcoming DMED. On the contrary, other treatments would prove ineffective unless strict diabetes control is maintained using insulin. Thus, understanding the hidden potential of insulin besides the glycemic control in the case of DMED can help us to accurately understand the pathophysiology of DMED and to develop new treatment strategies.
Phlorizin is a natural flavonoid that is primarily found in unripe apples, and it is well known to inhibit glucose reabsorption in the kidney and regulate the blood glucose level [12]. Additionally, because the effect of blood glucose control according to the concentration of the drug is well established in animal experiments, we supposed that it is advantageous to obtain the similar level of glucose control as insulin. Therefore, we comparatively evaluated the improving effects and mechanism of ED by comparing two glycemic control agents, namely phlorizin and insulin. This study also served to identify the exact role of insulin in the glycemic control of DMED.
Go to : 
MATERIALS AND METHODS
1. Experimental animals and design
A total of 60 male Sprague-Dawley rats (eight weeks old) were equally divided into four groups (n=15 in each group): age-matched normal control (C), untreated diabetic rats (D), and rats with DM treated with either phlorizin (P) or insulin (I). Diabetes was induced via an intraperitoneal injection of 55 mg/kg streptozotocin (STZ) with a citrate phosphate buffer (50 mM sodium citrate, pH 4.5) after overnight fasting. The same volume of citrate buffer was administered to the control group. All the rats weighed between 270 and 300 g prior to the induction of diabetes. The presence of DM was confirmed by blood glucose levels over 300 mg/dL some 48 hours after the STZ injection using an Accu-Chek Compact Meter (Roche Diagnostics, Indianapolis, IN, USA). All the rats except six developed diabetes after a single injection of STZ. The remained six rats were excluded from the study.
As the current experiment aimed to evaluate the improving effects and mechanism of ED by comparing the two glycemic control agents, the phlorizin and insulin treatment was delayed until ten weeks after the STZ injection [3713]. While the C and D groups received no treatment, the P group was injected twice a day with phlorizin (100 mg/kg) [1415] and the I group was given insulin as a daily injection of neutral protamine hagedorn (3–6 unit/d) [4]. The dosage of phlorizin and insulin was adjusted to achieve a comparable blood glucose level in both I and P group. Subsequently, phlorizin or insulin therapy for each group was continued for four weeks.
After 14 weeks of laboratory-controlled diabetes, the experiments were performed. The rats were fasted overnight and then anesthetized with an intraperitoneal injection of Zoletil (50 mg/kg; Virbac, Carros, France). Following the measurement of their body weight, all the rats underwent in vivo cavernosometery. Then, a sample of blood was obtained for the serum hemoglobin A1C (HbA1c) and blood glucose determination. After the cavernosometery, the cavernosal tissue was removed as a whole. The middle parts of the corpus cavernosum were cut, kept overnight in 10% formaldehyde solution, and then embedded for histological evaluation. The remnant tissue was promptly placed in liquefied nitrogen and stored at −80℃ until further processing.
2. In vivo assessment of erectile function
Cavernosometery was performed as described in previous studies [2346713]. The mean arterial pressure (MAP) was continuously monitored via the carotid artery, while the intracavernosal pressure (ICP) was also continuously observed via the corpus cavernosum after denuding the shaft of the penis. The major pelvic ganglion and cavernous nerve were exposed at the lateral side of the prostate, and a bipolar electrode was connected to an electrical stimulator (S48; Grass Instruments, Quincy, MA, USA). Electrical stimulation was performed with 3 V for 30 seconds at 0.2 ms intervals under a frequency of 10 Hz. Pressure data were collected and analyzed electronically during every session (PowerLab, ADInstruments, Colorado Springs, CO, USA). The ratio of ICP to MAP and the area under curve (AUC) to MAP were analyzed.
3. In vitro assessment of structural changes
Immunohistochemical staining for alpha-smooth muscle actin (α-SMA) was carried out in order to evaluate the percentage of the smooth muscle cell component (% α-SMA) [3713]. The specimens were incubated overnight with primary anti-α-SMA antibody (1:100; Dako, Glostrup, Denmark) and then processed with a biotin-labeled secondary antibody (1:2,000; Santa Cruz Biotechnology, Santa Cruz, CA, USA) for counterstaining. The ratio of α-SMA staining to total area was calculated under magnification (×25) in four duplicate sections of each sample using Image Pro Plus 4.5 software (Media Cybernetics, Silver Spring, MD, USA).
The apoptotic index was measured using the terminal deoxynucleotidyl transferase-mediated dUTP nickend labeling (TUNEL) method, as previously reported [3716]. The apoptotic cells were counted by identifying all the double-stained nuclei with fluorescein, and the slides were reviewed with a LMS 510 META NLO confocal microscope (Carl Zeiss, Zena, Germany). On each slide, the entire cavernosal tissue was captured under magnification fields (×100), and the apoptotic index was described as the ratio of the number of apoptotic cells to that of the total cells in a given area. The calculation was performed using the ImageJ program (National Institute of Health, Bethesda, MD, USA). In the present study, the results were expressed as the apoptotic cell density, which was calculated as the number of apoptotic cells per square millimeter of cavernosal surface area (cells/mm2).
4. Western blot analysis
As described above, the cavernosal tissue was obtained immediately after we performed the cavernosometery. The same quantity of protein extracts (20–50 µg) were separated in sodium dodecyl sulfate polyacrylamide gels, which were then transferred to nitrocellulose membranes. An overnight incubation was performed with primary antibodies, including anti-neuronal nitric oxide synthase (1:2,000; Cell Signaling Technology, Boston, MA, USA), anti-endothelial nitric oxide synthase (eNOS) (1:3,000; BD Biosciences, San Jose, CA, USA), anti-phospho-eNOS (Ser1177, 1:1,000; Cell Signaling Technology), anti-myosin phosphatase target subunit 1 (MYPT1) (1:2,000; Cell Signaling Technology), anti-phospho-MYPT1 (Thr696, 1:1,000; Millipore, Charlottesville, VA, USA), and platelet endothelial cell adhesion molecule-1 (PECAM-1) (1:1,000; Santa Cruz Biotechnology) [34671316]. The bands were visualized using the electrochemiluminescence Western blotting development system. To adjust for any loading differences, the membranes were re-probed with an antibody against monoclonal anti-actin antibodies. The results were then quantified by means of densitometry using Image J analysis software (National Institute of Health).
5. Statistical analysis
All data are shown as mean±standard deviation. The differences between the three groups in terms of the blood glucose levels and erectile parameters from the start of the phlorizin and insulin treatments were evaluated using an analysis of variance (ANOVA) with post hoc Tukey's analyses or the Kruskal-Wallis test. Normality test was performed before ANOVA. When Kruskal-Wallis test was used, post-hoc test was performed by Wilcoxon rank test with Bonferroni correction. A two-tailed p-value of <0.05 was considered to be statistically significant for all statistical analyses. All statistical analyses were performed using commercially available statistical software (IBM SPSS ver. 20.0; IBM, Armonk, NY, USA).
6. Ethics statement
All procedures were approved by the Institutional Animal Care and Use Committee of Seoul National University Hospital (IACUC Approval No. 14-0180-S1A1), and all experiments and animals care practices conformed to the requirements of the National Research Council Guide for Care and Use of Laboratory Animals.
Go to :
RESULTS
1. Experimental groups and the level of glycemic control
Throughout the experimental period, the C group showed continuous weight gain, while the other groups displayed significant weight loss during the ten weeks following the induction of DM. After the start of treatment, the body weight of the I group increased; however, there was no meaningful change in the P group (Fig. 1A). The C group showed a constantly low glucose level, while the level in the other groups reached around 500–600 mg/dL during the ten weeks following the induction of DM. Further, after the start of treatment, the glucose levels of the P and I groups were similarly decreased to under 400 mg/dL (Fig. 1B). The HbA1c level was significantly lower in the C group (4.3%±0.1%) than in the other groups (6.9%±0.6% for D, 5.8%±0.4% for P, 6.2%±0.5% for I, p<0.001). There were no statistical differences among the D, P, and I groups.
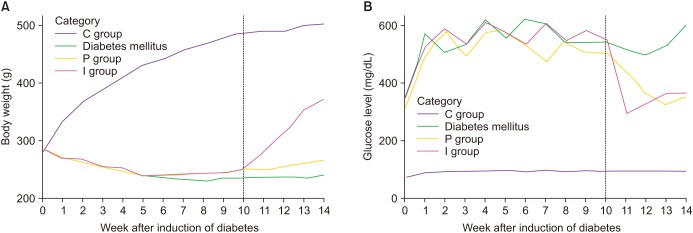 | Fig. 1Mean body weight (A) and mean blood glucose levels (B) of each group during the experimental period after the induction of diabetes. (A) The C group showed continuous weight gain, while the other groups displayed significant weight loss during the ten weeks following diabetic induction. After the start of treatment, the body weight of the I group increased; however, there was no meaningful change in the P group. (B) The C group showed a constantly low glucose level, while the levels in the other groups reached around 500 to 600 mg/dL during the ten weeks after the induction of diabetes. After the start of treatment, the glucose levels of the P and I groups were similarly decreased to under 400 mg/dL. C: normal control, I: diabetes mellitus treated with insulin, P: diabetes mellitus treated with phlorizin.
|
2. Assessment of erectile function
Fig. 2A shows comparisons of the ICP/MAP values among all the experimental groups. The D group showed significantly decreased responses when compared to the other groups (p<0.001). The results of the P and I groups showed as similar as the level in the C group. The results concerning the AUC/MAP values are presented in Fig. 2B. The AUC/MAP value was markedly decreased in the D group than other groups. The C group showed significant higher values than P and I groups, while there were no statistical differences between P and I groups.
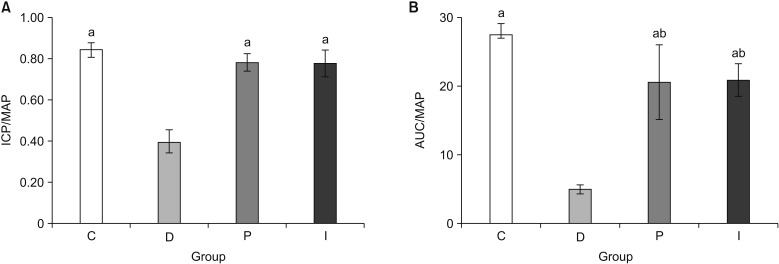 | Fig. 2Comparison of the erectile parameters of each group at 10 Hz. Changes in the ICP adjusted for MAP (ICP/MAP) (A) and changes in the AUC adjusted for MAP (AUC/MAP) (B). ICP: intracavernosal pressure, MAP: mean arterial pressure, AUC: area under the curve, C: normal control, D: untreated diabetic rats, P: diabetes mellitus treated with phlorizin, I: diabetes mellitus treated with insulin. ap<0.05 vs. D group, bp<0.05 vs. C group.
|
3. Differences in structural changes according to the treatment
The % α-SMA decreased significantly in the rats in group D when compared to the other groups. The % α-SMA of the P and I groups showed the comparable level as that seen in the C group (Fig. 3). However, the apoptotic index in the TUNEL assay was significantly increased in the D group, while the apoptotic indices of the C, P, and I groups were comparable to each other (Fig. 4).
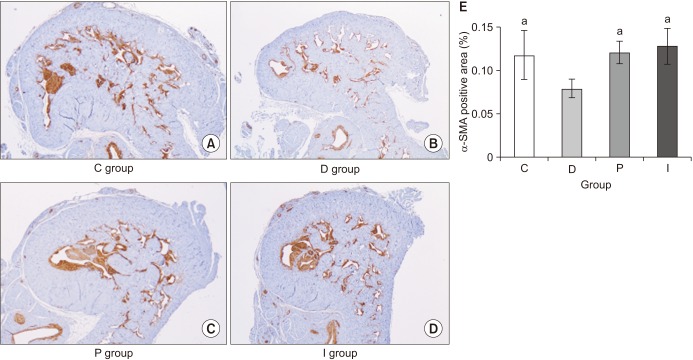 | Fig. 3α-SMA expression in penile sections. The densitometric analysis and representative images of the α-SMA immunohistochemical staining are shown. (E) The percentages of the smooth muscle cell component (% α-SMA) significantly decreased in the D group (B) when compared with the C (A), P (C), and I (D) groups. α-SMA: alpha-smooth muscle actin, D: untreated diabetic rats, C: normal control, P: diabetes mellitus treated with phlorizin, I: diabetes mellitus treated with insulin. ap<0.05 vs. D group.
|
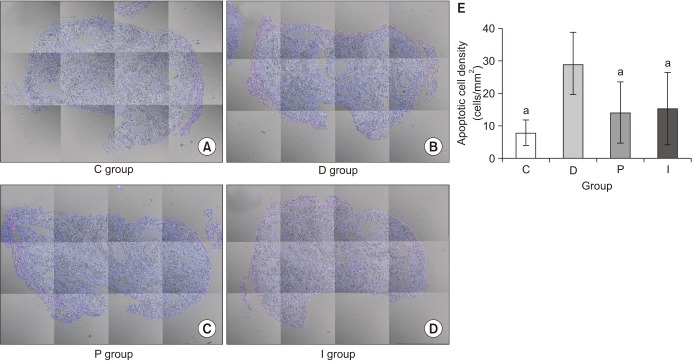 | Fig. 4Comparison of the apoptotic indices across the groups. The results are expressed as the apoptotic cell density (cells/mm2). The apoptotic activity was detected by in situ fluorescein labeling of DNA fragments using terminal deoxynucleotidyl transferase-mediated dUTP nick-end labeling. (E) The apoptotic cell density was significantly increased in the D group (B) when compared with the C (A), P (C), and I (D) groups. C: normal control, D: untreated diabetic rats, P: diabetes mellitus treated with phlorizin, I: diabetes mellitus treated with insulin. ap<0.05 vs. D group.
|
4. Western blot analysis
The densitometric analysis showed molecular changes in the cavernosal tissues (Fig. 5). The results concerning PECAM-1 which indicated CD31-positive endothelial content in the cavernosal tissue showed the comparable features in all groups. The phospho-/total eNOS ratio indicated the activity of the nitric oxide pathway, and the ratio was significantly decreased in the D group, while the nitric oxide pathways of the P and I groups were activated to the same extent as that seen in the C group. Further, the increased ratio of phospho-/total MYPT1 expression indicated the activation of the Rho kinase pathway, which was markedly increased in the D group when compared to the other groups. There were no statistical differences in terms of the phospho-/total MYPT1 expression among the C, P, and I groups.
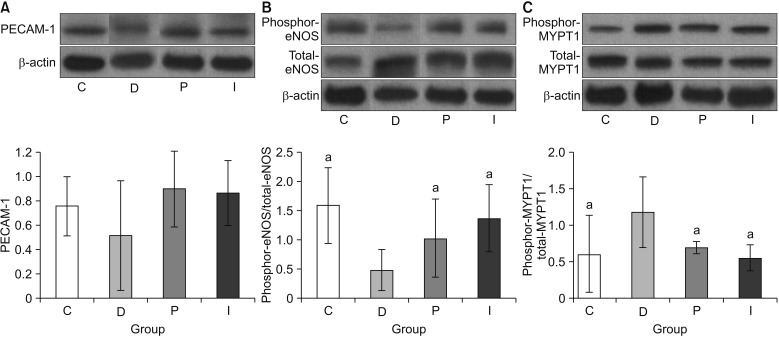 | Fig. 5Western blot analyses for PECAM-1 (A), phosphor-eNOS and total eNOS (B), and phosphor-MYPT-1 and total MYPT-1 (C). β-actin serves as a control. Representative blots are shown in the upper panel, while the densitometric analysis is shown in the bottom panel. PECAM-1: platelet and endothelial cell adhesion molecule 1, eNOS: endothelial constitutive nitric oxide synthase, MYPT-1: phosphorylated myosin phosphatase target subunit 1, C: normal control, D: untreated diabetic rats, P: diabetes mellitus treated with phlorizin, I: diabetes mellitus treated with insulin. ap<0.05 vs. D group.
|
Go to :
DISCUSSION
DMED is caused by late-stage microvascular lesions and macrovascular atherosclerotic complications, and it is one of the serious complications seen in diabetic patients [2517]. The prevalence of DMED varies from 30% to 90% [1819]. Generally, DMED develops over the course of several years. Patients with ED mainly complain of reduced penile stiffness and difficulty in maintaining tumescence [21719]. However, ED is not only indicated by chronic complications when diabetes is sustained for a long period of time, since it occurs first during the natural course of diabetes [17]. Therefore, ED could represent one of the first clinical manifestations in undiagnosed diabetic patients; hence, diabetes is often found during the process of diagnosing ED [20].
In patients with DMED, the response rate to oral therapeutic drugs, such as phosphodiesterase 5 inhibitors has been found to be approximately 60% to 70%, which is lower than the response rate seen in cases of ED induced by other medical causes [2212223]. Additionally, the diabetic condition has a tendency to lead to more severe ED than other medical causes [25]. Therefore, in order to prevent and overcome DMED, it is important to thoroughly manage the patient's blood glucose level from the point of diagnosis onwards [24822]. ED and other complications will manifest earlier if the blood glucose levels are not properly controlled [25].
The research in this area has traditionally focused on understanding the complicated pathophysiology of DMED, as well as its prevention and treatment [34716]. The change in erectile function based on the time treatment for diabetes is started and the change in erectile function according to the degree of glycemic control had been investigated [34]. Further, the combination treatment option, which involves the use of insulin alongside statins or rho-associated protein kinase inhibitors, has also been explored [671316]. Since the basic mechanism of DMED development is assumed to be the accumulation of secondary damages due to continuous hyperglycemia, thorough glycemic control could represent the most effective strategy for preventing and treating DMED [2345]. Moreover, insulin has been used to control hyperglycemia in the majority of prior studies [3467].
Insulin is a peptide hormone produced by the beta cells of the pancreatic islets [1024]. It regulates the metabolism of carbohydrates, fats, and protein by promoting the absorption of, in particular, glucose from the blood into fat, liver, and skeletal muscle cells [1024]. While performing these functions and processes, insulin does not merely exhibit glycemic control, since it also participates in protein synthesis in various tissues and shows an anabolic effect [1024]. Further, the insulin resistance observed in DMED has been closely related to sympathetic nervous system and nitric oxide synthesis [91011], leading some researchers to suggest that the role of insulin cannot only be restricted to the regulation of the blood glucose level, since it must also have more potential effects on the pathophysiology of DMED [48].
The kidney is a representative organ responsible for regulating and discharging salts and various ions, although it also plays an important role in maintaining glucose homeostasis through gluconeogenesis and glucose reabsorption [12]. The distribution of intrarenal glucose is carried out by the sodium-glucose cotransporter (SGLT), a type of membrane protein. Most of the SGLT1 is distributed in the gastrointestinal tracts, while SGLT2 is mainly expressed in the kidney [12]. Phlorizin is known to be a natural SGLT2 inhibitor that is extracted from unripe apples, and it has recently been developed and widely used as a form of oral drug for humans [12]. Briefly, phlorizin suppresses glucose reabsorption in the kidney, as well as regulating blood glucose levels. If the blood glucose level is similarly controlled by phlorizin or insulin in STZ-induced DM rats, then it could be possible to detect the role of insulin on the recovery of erectile function as well as the control of the blood glucose level.
In the present study, although comparable blood glucose levels were achieved in the P and I groups, the body weight was not increased in the P group, although it was increased in the I group. However, despite this difference in terms of the body weight gain, the recovery of erectile function as measured by the ICP/MAP and AUC/MAP values was similar in both the P and I groups. The structural changes were assessed using the % α-SMA and apoptotic index in a TUNEL assay, whereas the functional changes was evaluated by means of the PECAM-1 expression, ratio of phospho-/total eNOS, and ratio of phospho-/total MYPT1 expression. In all the comparisons, the P and I groups showed the same level as that seen in the C group, while only the D group showed deteriorated features. Consequently, these results suggest that the regulation of blood glucose levels from the early stage of diabetes onwards is the most important factor in preventing the occurrence of DMED and making treatment possible, regardless of the type of drug used to control the blood glucose levels.
This study had a number of limitations that must be considered when interpreting the results. First, it must be recognized that the level of glycemic control in an STZ-induced DM rat model does not reflect actual human conditions. However, we performed the once daily injection of insulin in order to reach the midlevel glycemic control identified in advanced studies [347], and we strived to maintain a constant level of blood glucose throughout the experiment. The phlorizin dose was also adjusted in line with the target blood glucose levels controlled by the insulin injection. Yet, despite these efforts, there was a subtle distinction in the control of the blood glucose level exhibited by the phlorizin and insulin. In particular, in the P group, one additional week was required to achieve similar midlevel glycemic control. These differences could affect the restoration of erectile function. Finally, we could not investigate all the pathophysiological mechanisms associated with the restoration of DMED. Nevertheless, the structural and functional changes in the corpus cavernosum were evaluated using representative materials and methods, while the recovery-related effects on ED of phlorizin and insulin therapy were objectively compared for the first time.
Go to :
CONCLUSIONS
In the present study, phlorizin did not show anabolic effects such as an increase in body weight; however, phlorizin treatment resulted in the enhancement of erectile function similar to that seen with insulin therapy. Additionally, there was no difference between the two drugs in relation to the improvement of the structural and functional dysfunction caused by the diabetic condition. These results suggest that glycemic control plays a vital role in the prevention and treatment of diabetic ED.
Go to :
 XML Download