

 PDF
PDF ePub
ePub Citation
 Print
Print


Abstract
Purpose
To evaluate the vessel density of macula according to analysis area in health subjects using optical coherence tomography angiography (OCTA).
Methods
We retrospectively analyzed 30 eyes of 20 healthy people who underwent OCTA. We measured vessel density (VD) according to analysis area and foveal avascular zone (FAZ) size of superficial capillary plexus (SCP) and deep capillary plexus (DCP). The analysis areas were classified as 3 × 3 mm scan area (Box), Box area excluding FAZ (Box-FAZ), fovea centered 3 mm circle area (Circle), Circle area excluding FAZ (Circle-FAZ) and area between fovea centered 1 mm circle and 3 mm circle (Ring).
Results
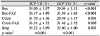
The SCP VDs were Box 34.00 ± 3.97, Box-FAZ 35.37 ± 4.09, Circle 31.70 ± 4.56, Circle-FAZ 33.34 ± 4.72, and Ring 35.22 ± 5.09. The DCP VDs were Box 30.04 ± 3.51, Circle 29.49 ± 3.57, Box-FAZ 31.59 ± 3.65, Circle-FAZ 31.46 ± 3.72, and Ring 32.60 ± 4.00. There was a significant difference according to analysis area from both SCP and DCP (p < 0.001 and p < 0.001, respectively). Comparison of the vessel density between SCP and DCP in the same analysis area were different in all areas (p < 0.001, p = 0.001, p < 0.001, p = 0.005, p = 0.001, respectively).
Figures and Tables
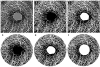 | Figure 1Optical coherence tomography angiography analysis areas. (A) Manual drawing of the foveal avascular zone (FAZ) area (gray) and boundary (white dot line). (B) Fovea centered 3 × 3 mm scan (Box). (C) Box area excluding FAZ (Box-FAZ). (D) Fovea centered 3 mm circle area (Circle). (E) Circle area excluding FAZ (Circle-FAZ). (F) Area between foveal centered 1 mm circle and 3 mm circle (Ring).
|
 | Figure 2Zones divided by distance from the fovea. (A) Fovea centered 1 mm circle area (zone A). (B) Area between fovea centered 1 mm circle and 3 mm circle (zone B). (C) 3 × 3 mm scan area excluding foveal centered 3 mm circle (zone C).
|
Table 1
Baseline characteristics of the study participants
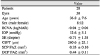
Values are presented as mean ± standard deviation unless otherwise indicated.
BCVA = best corrected visual acuity; logMAR = logarithm of the minimum angle of resolution; IOP = intraocular pressure; SE = spherical equivalent; CSFT = central subfield foveal thickness; SCP = superficial capillary plexus; FAZ = foveal avascular zone; DCP = deep capillary plexus.
![]()
Table 2
Comparison of the vessel density in the superficial capillary plexus and deep capillary plexus according to analysis area
![]()
References
1. Wang RK, Jacques SL, Ma Z, et al. Three dimensional optical angiography. Opt Express. 2007; 15:4083–4097.


2. Zhang A, Zhang Q, Chen CL, Wang RK. Methods and algorithms for optical coherence tomography-based angiography: a review and comparison. J Biomed Opt. 2015; 20:100901.
3. Matsunaga D, Yi J, Puliafito CA, Kashani AH. OCT angiography in healthy human subjects. Ophthalmic Surg Lasers Imaging Retina. 2014; 45:510–515.
4. Yoon YS, Woo JE, Woo JM. Optical coherence tomography angiography according to severity of diabetic retinopathy. J Korean Ophthalmol Soc. 2017; 58:653–662.
5. Hwang TS, Jia Y, Gao SS, et al. Optical coherence tomography angiography features of diabetic retinopathy. Retina. 2015; 35:2371–2376.

6. Agemy SA, Scripsema NK, Shah CM, et al. Retinal vascular perfusion density mapping using optical coherence tomography angiography in normals and diabetic retinopathy patients. Retina. 2015; 35:2353–2363.
7. Winegarner A, Wakabayashi T, Hara-Ueno C, et al. Retinal microvasculature and visual acuity after intravitreal aflibercept in eyes with central retinal vein occulusion: an optical coherence tomography angiography study. Retina. 2018; 38:2067–2072.
8. Kang JW, Yoo R, Jo YH, Kim HC. Correlation of microvascular structures on optical coherence tomography angiography with visual acuity in retinal vein occlusion. Retina. 2017; 37:1700–1709.
9. Seknazi D, Coscas F, Sellam A, et al. Optical coherence tomograpy angiography in retinal vein occlusion: correlations between macular vascular density, visual acuity, and peripheral nonperfusion area on fluorescein angiography. Retina. 2018; 38:1562–1570.
10. Arend O, Wolf S, Jung F, et al. Retinal microcirculation in patients with diabetes mellitus: dynamic and morphological analysis of perifoveal capillary network. Br J Ophthalmol. 1991; 75:514–518.
11. Conrath J, Giorgi R, Raccah D, Ridings B. Foveal avascular zone in diabetic retinopathy: quantitative vs qualitative assessment. Eye (Lond). 2005; 19:322–326.
12. Corvi F, Pellegrini M, Erba S, et al. Reproducibility of vessel density, fractal dimension and foveal avascular zone using 7 different optical coherence tomography angiography devices. Am J Ophthalmol. 2018; 186:25–31.
13. Noh D, Ryu G, Sagong M. Analysis of foveal microvascular structures using optical coherence tomography angiography in age-stratified healthy Koreans. J Korean Ophthalmol Soc. 2017; 58:1058–1065.
14. Fenner BJ, Tan GSW, Tan ACS, et al. Identification of imaging features that determine quality and repeatability of retinal capillary plexus density measurements in OCT angiography. Br J Ophthalmol. 2018; 102:509–514.
15. Fujiwara A, Morizane Y, Hosokawa M, et al. Factors affecting foveal avascular zone in healthy eyes: an examination using swept-source optical coherence tomography angiography. PLoS One. 2017; 12:e0188572.
16. Wang Q, Chan S, Yang JY, et al. Vascular density in retina and choriocapillaris as measured by optical coherence tomography angiography. Am J Ophthalmol. 2016; 168:95–109.
17. Shahlaee A, Samara WA, Hsu J, et al. In vivo assessment of macular vascular density in healthy human eyes using optical coherence tomography angiography. Am J Ophthalmol. 2016; 165:39–46.
18. Lee H, Lee M, Chung H, Kim HC. Quantification of retinal vessel tortuosity in diabetic retinopathy using optical coherence tomography angiography. Retina. 2018; 38:976–985.
19. Hartig SM. Basic image analysis and manipulation in ImageJ. Curr Protoc Mol Biol. 2013; 102:14–15.
20. Spaide RF, Klancnik JM, Cooney MJ. Retinal vascular layers imaged by fluorescein angiography and optical coherence tomography angiography. JAMA Ophthalmol. 2015; 133:45–50.
21. Lipson BK, Yannuzzi LA. Complications of intravenous fluorescein injections. Int Ophthalmol Clin. 1989; 29:200–205.
22. Jia Y, Bailey ST, Hwang TS, et al. Quantitative optical coherence tomography angiography of vascular abnormalities in the living human eye. Proc Natl Acad Sci U S A. 2015; 112:E2395–E2402.
23. Wei E, Jia Y, Tan O, et al. Parafoveal retinal vascular response to pattern visual stimulation assessed with OCT angiography. PLoS One. 2013; 8:e81343.
24. Munk MR, Giannakaki-Zimmermann H, Berger L, et al. OCT-angiography: a qualitative and quantitative comparison of 4 OCT-A devices. PLoS One. 2017; 12:e0177059.
25. Spaide RF, Fujimoto JG, Waheed NK. Image artifacts in optical coherence tomography angiography. Retina. 2015; 35:2163–2180.
26. Ghasemi Falavarjani K, Al-Sheikh M, Akil H, Sadda SR. Image artefacts in swept-source optical coherence tomography angiography. Br J Ophthalmol. 2017; 101:564–568.
27. Coscas F, Glacet-Bernard A, Miere A, et al. Optical coherence tomography angiography in retinal vein occlusion: evaluation of superficial and deep capillary plexa. Am J Ophthalmol. 2016; 161:160–171.e1-2.
28. Freiberg FJ, Pfau M, Wons J, et al. Optical coherence tomography angiography of the foveal avascular zone in diabetic retinopathy. Graefes Arch Clin Exp Ophthalmol. 2016; 254:1051–1058.
29. Garrity ST, Iafe NA, Phasukkijwatana N, et al. Quantitative analysis of three distinct retinal capillary plexuses in healthy eyes using optical coherence tomography angiography. Invest Ophthalmol Vis Sci. 2017; 58:5548–5555.
30. Dansingani KK, Inoue M, Engelbert M, Freund KB. Optical coherence tomographic angiography shows reduced deep capillary flow in paracentral acute middle maculopathy. Eye (Lond). 2015; 29:1620–1624.
31. Tan PE, Yu PK, Balaratnasingam C, et al. Quantitative confocal imaging of the retinal microvasculature in the human retina. Invest Ophthalmol Vis Sci. 2012; 53:5728–5736.
32. Chan G, Balaratnasingam C, Yu PK, et al. Quantitative morphometry of perifoveal capillary networks in the human retina. Invest Ophthalmol Vis Sci. 2012; 53:5502–5514.
33. Yanik Odabaş Ö, Demirel S, Özmert E, Batioğlu F. Repeatability of automated vessel density and superficial and deep foveal avascular zone area measurements using optical coherence tomography angiography: diurnal findings. Retina. 2018; 38:1238–1245.
 XML Download