

 PDF
PDF ePub
ePub Citation
 Print
Print


INTRODUCTION
MATERIALS AND METHODS
Study design and randomization
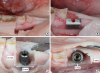 | Figure 1Extraction of the mesial root of the second premolar and preparation of the bone defect. (A) Incision and hemisection of the second premolar. (B) Metallic template measuring 8 mm×6 mm×3 mm. (C) Buccal and (D) occlusal view of the standardised peri-implant bone defect showing the respective measurements.
|
Preparation of the in vitro model
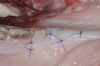
GBR/augmentation procedures and wound closure
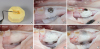 | Figure 2Silicone mould and application of material for guided bone regeneration. (A) The silicon mould used to standardize the amount of bone substitute material. (B) Particulated demineralized bovine bone mineral used in groups 1 and 2. (C) Alloplastic bone mineral used in group 3. (D) Group 1: xenogeneic granulate+collagen membrane. (E) Group 2: xenogeneic granulate+alloplastic membrane. (F) Group 3: alloplastic granulate+alloplastic membrane.
|
• Group 1: xenogeneic granulate+collagen membrane
Particulated demineralized bovine bone mineral (DBBM) (Bio-Oss® granules, 0.25–1 mm, Geistlich Pharma AG, Wolhusen, Switzerland)+porcine collagen membrane (Bio-Gide®, Geistlich Pharma AG) (n=10)
• Group 2: xenogeneic granulate+alloplastic membrane
Particulated DBBM (Bio-Oss® granules 0.25–1 mm, Geistlich Pharma AG)+alloplastic membrane (polylactide+acetyl tri-n-butyl citrate NF [ATBC]) (GUIDOR® bioresorbable matrix barrier, Sunstar Suisse SA, Etoy, Switzerland) (n=10)
• Group 3: alloplastic granulate+alloplastic membrane
Alloplastic in situ hardening biphasic calcium phosphate (HA, β-TCP) coated by PLGA and activated with a BioLinker (N-methyl-2-pyrrolidone solution) (GUIDOR® easy-graft® CRYSTAL, Sunstar Suisse SA)+alloplastic membrane (polylactide+ATBC) (GUIDOR® bioresorbable matrix barrier, Sunstar Suisse SA) (n=10)
CBCT scanning and image evaluation
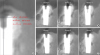 | Figure 4CBCT scan perpendicular to the implant axis before and after suturing. (A) Pre-suturing CBCT of groups 1, 2, and 3. (B) Post-suturing CBCT of groups 1, 2, and 3.CBCT: cone-beam computed tomography, HT0: at the implant shoulder, HT1, 1 mm below the implant shoulder, HT2: 2 mm below the implant shoulder.
|
Statistical analysis
RESULTS
Table 1
Horizontal thickness of the augmented area before and after suturing in groups 1, 2, and 3 at the different levels measured (at the implant shoulder [HT0=0 mm] and at 1 mm and 2 mm below [HT1 and HT2, respectively])

![]()
Table 2
Changes in horizontal thickness for each group and comparisons among the 3 groups

![]()
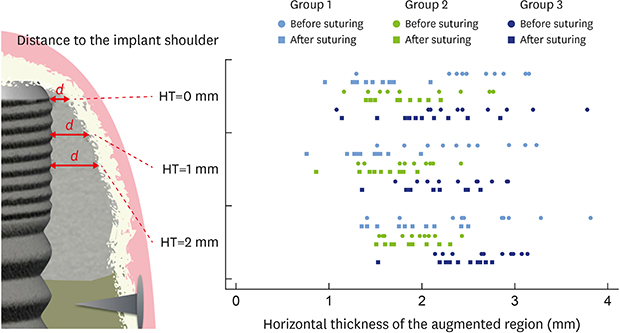
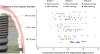 | Figure 5Diagram showing all values for horizontal thickness of the augmented region buccal of the implant before and after suturing at the 3 levels measured. Skyblue: group 1; green: group 2; blue: group 3.HT0: at the implant shoulder, HT1: 1 mm below the implant shoulder, HT2: 2 mm below the implant shoulder.
|
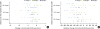 | Figure 6Diagram showing the values for the absolute changes (mm) and the relative changes (%) in horizontal thickness at the different levels measured (HT0, HT1, HT2) for the 3 investigated groups. (A) Change in horizontal thickness in (mm). (B) Relative change in horizontal thickness in (%). Skyblue: group 1; green: group 2; blue: group 3.HT0: at the implant shoulder, HT1: 1 mm below the implant shoulder, HT2: 2 mm below the implant shoulder.
|
 XML Download