

 PDF
PDF ePub
ePub Citation
 Print
Print


INTRODUCTION
Accurate diagnosis of left ventricular (LV) myocardial diseases is necessary to optimize clinical outcomes and therapeutic management.1) Imaging approaches can be challenging for the diagnosis of diseases affecting the LV myocardium due to considerable overlap among characteristic features.2) Transthoracic echocardiography is a widely utilized cardiac imaging modality because it is accurate, safe, low cost, does not involve ionizing radiation, and does not have any contraindications. However, the effectiveness of transthoracic echocardiography is limited by operator dependency, difficulties with soft tissue characterization, and possible impairment due to a poor acoustic window, large body habitus, limited field of vision, and technical artifacts.3) Cardiac magnetic resonance (CMR) has recently attracted increasing interest as the current gold standard for morphological and functional assessment of the LV, by allowing soft tissue characterization using different pulse sequences.4)5) However, CMR requires a relatively long acquisition time, higher skill levels, and has several contraindications.
Computed tomography (CT) has excellent spatial resolution and high temporal resolution of up to 66 milliseconds with short acquisition time and can be used to obtain high-quality multiplanar reconstructions in any desired image orientation. Emerging data have suggested that cardiac CT yields accurate assessments of the coronary arteries and provides anatomical and functional analysis of the LV cardiac chamber as well as tissue characterization of the LV myocardium, and is complementary to echocardiography and CMR.2)6)7) However, cardiac CT is not recommended as the primary method of visualization in cases of suspected LV myocardial disease.8) In this review, we summarize the current techniques, imaging findings, and role of cardiac CT imaging for LV myocardial diseases, along with CMR findings.
TECHNIQUES
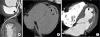
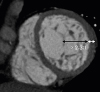
State-of-the art electrocardiography (ECG)-gated cardiac CT scanning of 64 or more slices with 0.5 mm, 0.6 mm, or 0.625 mm collimated slice widths yields excellent isotropic submillimeter resolution of the heart. Wide-detector CT (256- or 320-detector-row CT scanner) covers the entire heart (16 cm in the z-axis direction) and yields isophasic and isochronic CT data without stair-step or banding artifacts. The temporal resolution ranges from 66 to 175 ms, depending on the scanner and reconstruction, but is still lower than those of CMR and echocardiography. LV regional and global functional parameters as well as LV myocardial anatomy are comprehensively evaluated using retrospective ECG-gated spiral scanning, which is based on continuous data acquisition and table movement at low table feed. This allows for retrospective optimization of the reconstruction window and image reconstruction in multiple cardiac phases. However, this technique is associated with relatively high radiation doses. Meanwhile, prospective ECG-triggered sequential scanning following the “step-and-shoot” technique uses only the selected phase of the patient's cardiac cycle and allows for end-systole or mid-diastole coronary assessments with low radiation exposure.6)9) Accordingly, prospective ECG-triggering may be inadequate for the interpretation of LV diameter and wall thickness. Furthermore, this method does not allow the evaluation of LV function (Figure 1). At present, multi-energy scanners are available in clinical contexts for the evaluation of myocardial pathology, and technical approaches to multi-energy CT include two sequential scans, rapid switching of X-ray tube potential, multilayer detector, and, dual X-ray sources.10)11)12)
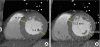 | Figure 1Changes of left ventricular (LV) wall thickness during mid- and end-diastole. Evaluations of LV wall thickness require precise measurements, usually at end-diastole. Cardiac computed tomography is normally performed mid-diastole to assess the coronary artery. Interpretation of LV wall thickness with short-axis multiplanar reformatted images may be misleading at mid-diastole (A) compared to end-diastole (B).
|
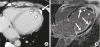
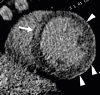
There is mounting evidence favoring the clinical value of CT perfusion for the detection of myocardial ischemia. Myocardial perfusion can be evaluated by cardiac CT using static and dynamic scan acquisitions. Static CT perfusion is easily performed using any cardiac CT scanner and provides a snapshot of myocardial enhancement (iodine distribution) at one time point during the first pass of contrast material bolus (Figure 2). True perfusion defects persist throughout multiple phases. Static CT perfusion depends on scan timing, leading to poor contrast-to-tissue ratios if the peak attenuation is missed. In contrast to static CT perfusion, dynamic CT perfusion obtains multiple consecutive images during the first pass of contrast material and allows for quantitative analysis of myocardial perfusion. There is a wide range of myocardial blood flow cut-off values (75 to 103 mL/100mL/min) for distinguishing ischemic from remote myocardium. Dynamic CT perfusion imaging requires high temporal resolution and comprehensive LV myocardial coverage, and is associated with higher exposure to radiation than static perfusion CT.13)14)15) Ko et al.16) demonstrated that stress perfusion multi-energy CT combined with coronary CT angiography improves the performance of coronary CT angiography for the detection of hemodynamically significant stenosis, when compared with invasive coronary angiography combined with stress perfusion CMR imaging.
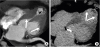
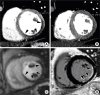 | Figure 2Static stress perfusion cardiac computed tomography (CT) imaging in a 40-year-old male with chest discomfort. Short-axis multiplanar reformatted images of cardiac CT acquired at stress (A) and rest (B) show reversible subendocardial perfusion defects in the mid lateral, inferior, and inferoseptal left ventricular (LV) walls (arrowheads). Cardiovascular magnetic resonance perfusion imaging acquired at stress (C) and delayed contrast enhancement (D) show subendocardial myocardial infarction at the mid inferolateral and inferior LV wall (D, arrowheads), and peri-infarction ischemia in the mid lateral, inferior and inferoseptal LV wall (C, arrowheads). Stress perfusion CMR is superior to stress perfusion cardiac CT for the depiction of stress induced myocardial perfusion defects.
|
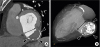
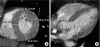
LV myocardial viability or scarring can be identified with delayed phase cardiac CT, which shares a similar pathophysiological basis with delayed enhancement CMR. A delayed phase CT scan is usually performed after a variable period of 5–15 min following coronary CT angiography with additional administration of contrast medium (Figure 3). The amount of contrast medium, injection rate, and time delay is tailored for each patient to evaluate the presence of persistent contrast due to the slow washout of iodinated contrast media from regions of replacement fibrosis or scarring on delayed phase cardiac CT.17) Mahnken et al.18) and Gerber et al.19) demonstrated that delayed phase cardiac CT can be used to quantify infarct size, which in turn is significantly correlated with the results of CMR-based imaging. The feasibility and short examination time of cardiac CT are important advantages of cardiac CT compared with CMR. Several studies have demonstrated that equilibrium or delayed phase cardiac CT allows for the measurement of myocardial extracellular volume fraction (ECV) and shows good agreement with ECV measured by CMR. ECV is a reproducible and novel index for the assessment of myocardial fibrosis, and is calculated using the following formula from cardiac CT: ECV = (1–hematocrit ) × (ΔHULV myocardium/ΔHULV blood), where ΔHU is the change in Hounsfield unit attenuation pre-contrast and in the delayed phase CT (HUdelayed phase – HUpre-contrast).7)20)21) Decreased tube voltage (100 or 80 kVp), multi-energy imaging, and increased contrast volume strengthen myocardial contrast and enhance scar or fibrosis visualization in delayed phase cardiac CT.
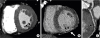 | Figure 3Infarct imaging using arterial and delayed-enhancement cardiac computed tomography (CT) in a patient with an old myocardial infarction in the left circumflex territory. Short-axis multiplanar reformatted (MPR) images of arterial (A) and delayed-phase (B) cardiac CT show thinned myocardium with fixed subendocardial perfusion defect (arrowheads) and delayed transmural hyperenhancement (arrow) in the mid inferior left ventricular wall. (C) Curved MPR coronary CT angiography image shows significant stenosis with noncalcified plaque of the left main coronary artery (arrow) and occlusion at the distal left circumflex artery (arrowhead). Subendocardial perfusion defect indicates microvascular occlusion.
|
Contrast amount and injection timing are also important for the assessment of LV myocardial diseases, particularly LV function. A triphasic injection protocol (contrast followed by a saline/contrast media mixture followed by saline push) opacifies both ventricles and delineates the interventricular septum, allowing for the evaluation of LV wall myocardial anatomy and function. A rate of 5–7 mL/s is recommended for the injection of contrast media. Total contrast volume is usually 50-120 mL.22)
ASSESSMENT OF LV FUNCTION AND WALL THICKNESS
Accurate and reproducible measurement of LV mass and functional parameters is fundamental for clinical diagnosis, risk assessment, therapeutic strategy, prognosis, and follow-up of cardiovascular diseases.1) Echocardiography is the first non-invasive tool used to assess LV function. CMR is now regarded as the standard reference for the functional measurement of LV, affording high accuracy and reproducibility. The quantification of LV function using cardiac CT has been validated in many prior studies via comparisons with echocardiography and CMR.23) Excellent correlation and linear relations were seen between cardiac CT and CMR for assessments of LV end-diastolic and end-systolic volume, LV stroke volume, LV ejection fraction, and LV mass. Bak et al.24) demonstrated that dual-source CT based on a threshold-based technique yielded highly reproducible measurements of global LV parameters, which were significantly smaller than the CMR values obtained using Simpson's method except for the ejection fraction.
Knowledge of the normal range of LV wall thickness is important to diagnose several common cardiac diseases that are characterized by hypertrophy or abnormal wall thinning. In Korean adults without any prior history of cardiac disease, LV myocardial thickness (septal wall thickness, 1.08 ± 0.18 cm vs. 0.90 ± 0.17 cm; posterior wall thickness, 0.91 ± 0.15 cm vs. 0.78 ± 0.10 cm; relative wall thickness, 0.38 ± 0.08 cm vs. 0.33 ± 0.05 cm), LV volume (end-diastolic volume, 112.9 ± 26.1 mL vs. 98.2 ± 21.0 mL; end-systolic volume, 41.7 ± 14.7 mL vs. 33.7 ± 12.2 mL), and LV mass (145.0 ± 29.1 g vs. 107.9 ± 20.0 g) obtained with 320-detector-row CT were significantly greater (p < 0.01) in men than in women. However, these significant differences disappeared after being normalized for body surface area.25) In other words, the mean LV myocardial thickness measured on cardiac CT was less than 11 mm at the septum and 10 mm at the posterior wall. The reference range of LV septal and posterior wall thickness at end-diastole using echocardiography is 0.6-1.0 cm in males and 0.6-0.9 cm in females. For any LV segment observed on short-axis CMR images, the average minimum/maximum myocardial thickness was 4/11 mm in males and 4/9 mm in females. LV hypertrophy (LVH) is usually defined by interventricular septal and/or posterior wall thickness in end-diastole > 11 mm.26)
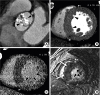
Cardiac CT provides not only anatomical but also functional information about the LV myocardium, particularly in patients with myocardial infarction (MI) and cardiomyopathies (Figure 4). Measurement of LV functional parameters by cardiac CT is particularly useful in cases of equivocal or suboptimal echocardiography or contraindications for CMR such as pacemakers and defibrillators. However, routine measurements of LV functional parameters using cardiac CT cannot be recommended for all patients because they require contrast media and radiation exposure.8) The value of cardiac CT as a first-choice assessment tool for LV structure and function can only be assessed through additional research.
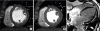
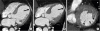 | Figure 4Global and regional left ventricular (LV) function assessment with cardiac computed tomography (CT) in an 80-year-old woman with ischemic cardiomyopathy. Four-chamber multiplanar reformatted (MPR) images of cardiac CT obtained during end-diastole (A) and end-systole (B) show dilated LV cavity and apical ballooning with thinned apical lateral wall and akinesia/dyskinesia (arrows, apical aneurysm). The mid inferior and mid inferolateral LV walls (arrowheads) are noted to be thin and akinetic on short-axis MPR image of cardiac CT obtained at the end-systolic phase (C). LV ejection fraction, end-diastolic, and end-systolic volumes were 31%, 198 mL, and 137 mL, respectively. Conventional coronary angiography confirmed total occlusion at the proximal right coronary artery and subtotal occlusion at the mid anterior descending coronary artery and distal left circumflex coronary artery (not shown).
|
MYOCARDIAL INFARCTION AND TRUE AND FALSE LV ANEURYSMS
Myocardial infarction
MI is the leading cause of death and a main cause of morbidity in developed countries.27) The most typical cause of MI is acute intracoronary thrombosis superimposed on unstable atherosclerotic plaque. The infarct progresses like a “wavefront pattern” from the endocardium toward the epicardium.28) Ischemic cardiomyopathy is defined as LV systolic dysfunction with one or more of the following criteria: history of prior myocardial revascularization or MI, more than 75% stenosis in the left main stem or proximal left anterior descending artery, or 2 or more epicardial coronary arteries on invasive or CT coronary angiography.29)
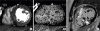
Non-contrast or precontrast cardiac CT helps to detect fatty replacement (lipomatous metaplasia) or calcification of the LV myocardium in coronary artery territory, which is indicative of old MI (Figure 5). The prevalence of LV myocardial fat is 22%–62% among patients with a history of MI. Myocardial fat associated with healed MI appears as an area of linear or curvilinear subendocardial low attenuation in the culprit coronary artery.30)31)32) Ichikawa et al.32) demonstrated that LV myocardial fat was mostly located in the subendocardium (94%) of the region perfused by the infarct-related artery and was commonly present in patients with infarct age ≥ 3 years (89%). Infarcted myocardial areas are hypoattenuated due to the reduced distribution of contrast medium during the first passage on arterial phase cardiac CT. Focal wall thinning, regional LV wall motion abnormality, LV remodeling, LV thrombus, and aneurysm can be easily diagnosed on early phase cardiac CT.33)34) End-diastolic wall thickness in thinned regions < 6 mm is defined as irreversible myocardial damage (nonviable myocardium) and obviates the need for viability testing.35) Nieman et al.36) demonstrated that the difference in CT attenuation between infarcted and remote normal myocardia was significantly greater in patients with old MI than in patients with acute MI (89 ± 41 and 55 ± 33 HU, respectively, p < 0.001). In addition, LV wall thinning and ventricular dilation are only associated with old MI.
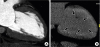
 | Figure 5Left ventricular (LV) myocardial fat with cardiac computed tomography (CT) in a 51-year-old male with old myocardial infarction. (A) A curved multiplanar reformatted coronary CT angiography image shows significant stenosis (arrowhead) of the proximal left anterior descending coronary artery. Precontrast (B) and arterial phase (C) cardiac CT images show curvilinear fat deposition (arrowheads) in the subendocardium of the thinned LV myocardium (6 mm in thickness) in apical septal and lateral LV wall.
|
Delayed phase cardiac CT facilitates the accurate estimation of infarct size and microvascular occlusion in acute MI.37) Sato et al.38) showed that when myocardial contrast displayed delayed enhancement size on delayed phase cardiac CT obtained immediately after primary percutaneous coronary intervention, it could help predict clinical outcomes in patients with acute MI.
LV aneurysm and pseudoaneurysm
Clinical distinction between true and pseudoaneurysms remains a challenge, but it is important to guide proper management. LV aneurysm describes a saccular protrusion containing the full thickness of the thinned LV wall with scarred myocardium that balloons outward, and akinesia or dyskinesia. Transmural MI is the major underlying cause of LV aneurysm, and usually involves the apical, anterior, or anterolateral wall. Cardiac CT and MR imaging findings include a wide mouth, smooth transition from normal myocardium to thinned, scarred myocardium with delayed enhancement, and akinesia or dyskinesia during systole (Figure 6). Fatty replacement or calcification of the infarcted myocardial wall and thrombus formation may be present. Surgical repair (aneurysmectomy) is recommended for cases refractory to medical treatment for dysrhythmias, angina, systemic embolization, or heart failure.39)40)
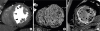
 | Figure 6Left ventricular (LV) aneurysm with calcification and intracavitary thrombus in a 65-year-old male with old myocardial infarction (MI). Axial delayed-phase cardiac computed tomography image obtained at the end-systolic phase shows an LV apical aneurysm with calcification (arrow), intracavitary thrombus (arrowheads), and delayed transmural hyperenhancement of the apical to mid septal LV myocardium (thin arrows). Four-chamber delayed-phase cardiac magnetic resonance image obtained at the mid-diastolic phase shows an apical aneurysm with intracavitary thrombus (arrowheads) and diffuse subendocardial delayed hyperenhancement of the LV septum and lateral wall (arrows), consistent with old MI.
|
LV pseudoaneurysm results from rupture of the LV free wall, contained by an overlying adherent pericardium or scar tissue. Pseudoaneurysm is more commonly seen in inferior and lateral wall segments attributed to MI following left circumflex coronary artery occlusion.41) Unlike the wide mouth of a true aneurysm, the mouth of a pseudoaneurysm is narrower than the diameter of the aneurysm. Other imaging findings include abrupt transition from normal myocardium to aneurysm, a distinct discontinuity of the ventricular wall, and dyskinesia during both systole and diastole (Figure 7). Pseudoaneurysms have poor prognoses because of the high risk of expansion and rupture, leading to cardiac tamponade, shock, and death. Therefore, they call for urgent surgical repair. CMR facilitates the differentiation between LV pseudoaneurysms and true aneurysms via tissue characterization, viability imaging, and detection of wall motion abnormalities. High isotropic spatial resolution cardiac CT imaging allows for visualization of all planes of the heart and thus reveals segments that are difficult to see on echocardiography, providing diagnostic clues for differentiating LV aneurysm and pseudoaneurysm.40)42)
 | Figure 7Left ventricular (LV) pseudoaneurysm with calcification and intracavitary thrombus in a 65-year-old male with stable angina. Short-axis multiplanar reformatted (A) and thick slap maximum intensity projection (B) images of cardiac computed tomography obtained at the end-diastolic phase show LV inferior wall outpouching with a relatively narrow neck (black arrow), intracavitary thrombus, and multiple calcifications along its wall (arrowheads).
|
CARDIOMYOPATHY AND MYOCARDITIS
Hypertrophic cardiomyopathy
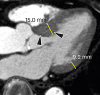
Hypertrophic cardiomyopathy (HCM) is the most common genetic heart disease and exhibits autosomal dominant inheritance. The classical diagnosis of HCM is based on unexplained diffuse or segmental LVH without compensatory dilation of the LV chamber, and with normal or supernormal systolic function demonstrated by imaging techniques. Heart failure, arrhythmias, ischemia, and sudden death represent major complications of HCM.43)44)45) The diagnostic criterion for HCM is a LV wall thickness of ≥ 15 mm (measured at end-diastole) in at least one LV myocardial segment. Maximum LV wall thickness ≥ 30 mm is associated with sudden cardiac death.46) Most patients with HCM have an asymmetric septal hypertrophy, which is defined as hypertrophy with a septal-to-inferolateral wall thickness ratio ≥ 1.3 in normotensive heart patients (≥ 1.5 in hypertensive patients) (Figure 8). Other various types of HCM are concentric, mid-ventricular, apical, mass-like, and reverse-curve. End-stage (burnout or dilated phase) HCM is present in 2.4% to 15.7% of individuals and is characterized by wall thinning, LV dilation, and systolic dysfunction (Figure 9). Myocardial fibrosis with delayed enhancement CMR images can be focal (patchy or massive mid-wall enhancement) and located near the right ventricular insertion points, or diffuse.4)47)48)49)
 | Figure 8Asymmetrical septal hypertrophic cardiomyopathy in a 57-year-old man with chest pain. (A) Short-axis multiplanar reformatted (MPR) image of arterial phase cardiac computed tomography (CT) shows asymmetrical hypertrophy of the mid anterior, septal, and inferior left ventricular (LV) wall at end-diastole. Short-axis MPR images of delayed phase cardiac CT (B) and cardiac magnetic resonance (C) show diffuse transmural enhancement in the septum, anterior, and inferior LV wall (arrowheads).
|
 | Figure 9End-stage midventricular hypertrophic cardiomyopathy in a 76-year-old female. Four-chamber multiplanar reformatted arterial (A) and delayed-phase (B) cardiac computed tomography images show hypertrophy involving the middle third of the left ventricle (LV) (A, arrows) along with apical thinning, resulting in the characteristic hourglass or dumbbell-shaped appearance of the LV cavity, transmural apical enhancement (B, arrows), and hypoenhancing foci along the subendocardial surface in this region (A and B, arrowhead), compatible with thrombus.
|
Recently, Lee et al.21) demonstrated that mean ECV values for patients with HCM (32.31% ± 0.97%) were significantly higher (p < 0.01) than in healthy subjects (26.32% ± 0.90%) on dual-energy equilibrium or delayed phase cardiac CT. Cardiac CT allows for the evaluation of HCM based on key morphological characteristics (presence, location, distribution, and severity of LVH), LV systolic function, the mitral valve and its apparatus, intraventricular obstruction, extent of myocardial fibrosis with delayed enhancement and ECV measurement (tissue characterization), and the presence of LV crypts. These indicators are used alongside anatomical imaging of the coronary arteries (stenosis, myocardial bridging), particularly when echocardiographic images are suboptimal and CMR is contraindicated.4)49)50)
Sarcoidosis
Cardiac sarcoidosis is a rare multisystemic disorder of unknown cause that is characterized by the presence of noncaseous epithelioid granulomas. Clinical manifestations of cardiac sarcoidosis range from lack of symptoms to sudden cardiac death or advanced heart failure. Although granulomas and/or fibrous scars can be distributed anywhere in the myocardium, transmural distribution is most common and nontransmural lesions are often subepicardial or midmyocardial. The active phase of cardiac sarcoidosis results in focal myocardial thickening. In the chronic phase, sarcoid lesions ultimately heal through myocardial fibrosis, which results in myocardial thinning, regional wall motion abnormalities, and ventricular aneurysm. Delayed enhancement CMR suggesting the diagnosis of cardiac sarcoidosis is characterized by multifocal involvement and involvement of the basal anteroseptum and inferoseptum, which demonstrates contiguous extension into the right ventricle. However, the distribution and changes of myocardial thickness with delayed enhancement patterns mimic other cardiomyopathies.51)52)53) Cardiac CT demonstrates global or regional hypokinesia, focal wall thickening (acute), focal thinning and ventricular aneurysm (chronic), diverse delayed enhancement pattern (transmural, subepicardial, or midmyocardial), and increase in myocardial ECV in cardiac sarcoidosis as well as the involvement of other organs (Figure 10).21)50)54)
 | Figure 10Cardiac sarcoidosis in a 61-year-old female with irregular cardiac rhythm and dyspnea. (A) Short-axis multiplanar reformatted image of cardiac computed tomography (CT) was used to obtain the arterial phase, which shows asymmetrically hypertrophied mid septum and inferior left ventricular (LV) wall (arrowheads) at end-diastole. Delayed-phase cardiac CT (B) and cardiovascular magnetic resonance (C) images diffuse midwall and transmural delayed enhancement (arrowheads) in the entire LV wall.
|
Amyloidosis
Cardiac amyloidosis is characterized by abnormal deposition of pathological and insoluble amyloid proteins within the myocardial extracellular space. The majority of cardiac amyloidosis cases are caused by one of two proteins, either light chains or transthyretin. Approximately 50% of patients with light-chain amyloidosis develop cardiac involvement. The prognosis for cardiac amyloidosis is poor and associated with subtype and degree of amyloid infiltration. LVH with biatrial dilation, preserved systolic function, and restrictive diastolic filling pattern are pathognomonic imaging findings of cardiac amyloidosis. Delayed enhancement CMR shows circumferential subendocardial delayed enhancement that is most pronounced at the middle to basal LV wall in 80% of patients with cardiac amyloidosis. The pattern of delayed myocardial enhancement is more specific than the morphologic and functional findings.55)56) Arterial phase cardiac CT demonstrates LV wall thickening with subtle lower attenuation. Circumferential subendocardial or transmural delayed enhancement is apparent in delayed phase cardiac CT (Figure 11).54)57) Recent studies have demonstrated that the mean ECV value in patients with amyloidosis was higher than that in patients with severe aortic stenosis (AS) (54% ± 11% vs. 28% ± 4%, p < 0.001) and healthy subjects (53.45% ± 1.19% vs. 26.32% ± 0.90%, p < 0.01).7)21) Accordingly, cardiac CT can provide non-invasive diagnosis and quantification of cardiac amyloidosis.
 | Figure 11Cardiac amyloidosis in a 74-year-old male who presented with chest pain. Two-chamber multiplanar reformatted image of arterial (A) and delayed-phase cardiac computed tomography (B) obtained during mid-diastole shows hypertrophy of the left ventricular (LV) myocardial wall and diffuse, concentric subendocardial and transmural enhancement (arrowheads) in the LV myocardial wall.
|
Dilated cardiomyopathy
Dilated cardiomyopathy (DCM) is the most common type of non-ischemic cardiomyopathy and represents an end-stage manifestation of multiple non-ischemic cardiomyopathies. DCM is characterized by LV dilation and contractile dysfunction in the absence of CAD, pressure overload, and infiltrative cardiomyopathies. Sudden cardiac death may be the first manifestation of idiopathic DCM. Mortality increases with arrhythmia, progressive heart failure, and thromboembolism.58) LV dilation and LV global systolic dysfunction without regional wall motion abnormalities are characteristic imaging findings of DCM, and are occasionally associated with right ventricular dilation and hypertrabeculation of both ventricles (Figure 12). The LV walls are usually thin, but may be normal or even thickened. Mural thrombi may be present in the LV and occasionally in the atria. Three types of DCM-related delayed enhancement include: midwall, subendocardial, or transmural delayed enhancement. Linear or bandlike midwall delayed enhancement of the interventricular septum is present in approximately 30% of patients with DCM, and this feature differentiates DCM from ischemic cardiomyopathy. Absence of delayed enhancement has also been reported (59%). DCM is also associated with myocardial fat deposition in 18%–24% of cases.59)60) Cardiac CT shows LV global systolic dysfunction, dilated ventricle, LV wall thinning (diastolic wall thickness < 5.5 mm), linear midwall delayed enhancement, midwall fat, and absence of significant CAD, allowing for differentiation of DCM patients from those with ischemic cardiomyopathy.26)50)54) In addition, delayed CT demonstrates expansion of ECV in patients with DCM compared with healthy subjects (31.25% ± 0.79% vs. 26.32% ± 0.90%, p < 0.01).21)
 | Figure 12Dilated cardiomyopathy in a 63-year-old male. Short-axis multiplanar reformatted images of arterial-phase cardiac computed tomography obtained during end-diastole (A) and end-systole (B) show a dilated left ventricle (LV), preserved myocardial thickness, and severe global hypokinesia. (C) Delayed-phase four-chamber cardiovascular magnetic resonance imaging shows dilated left cardiac chambers and subtle midwall delayed enhancement (arrowhead). LV ejection fraction, end-diastolic, and end-systolic volumes were 14.7%, 341 mL, and 291 mL, respectively.
|
Non-compaction cardiomyopathy
Non-compaction cardiomyopathy (NCC) is characterized by extensive LV trabeculation and deep intertrabecular recesses. Clinical manifestations are highly variable, ranging from absence of symptoms to LV systolic dysfunction, heart failure, arrhythmias, systemic thromboembolism, and sudden cardiac death.61) NCC is primarily diagnosed by echocardiography and CMR imaging findings consistent with increased thickness of the noncompacted layer (higher proportion of noncompacted myocardium) compared with the compacted layer.62)63) The most frequently involved segments include the apical and mid-ventricular areas of the inferior and lateral walls of the LV.
CMR imaging results showing a ratio of LV noncompacted myocardium to compacted myocardium > 2.3 at end-diastole, LV dilation, and LV global hypokinesia are diagnostic hallmarks of NCC. Cardiac CT allows for clear depiction of trabeculations along the LV wall and precise measurement of the end-diastolic thickness of noncompacted and compacted myocardium and areas of trabecular and subendocardial delayed enhancement (Figure 13).64) Melendez-Ramirez et al.65) showed that a noncompacted to compacted myocardial thickness ratio ≥ 2.2 in ≥ 2 segments indicated a diagnosis of NCC. Additional cardiac CT findings may include LV systolic dysfunction and LV thrombus.
 | Figure 13Non-compaction cardiomyopathy in a 33-year-old female with acute pain. Short-axis multiplanar reformatted images of arterial phase cardiac computed tomography obtained during end-diastole show increased thickness of the noncompacted layer in the anterior, lateral, and inferior segments of the mid left ventricular wall, with a ratio of noncompacted (black arrow) to compacted myocardium (white line) > 2.3:1.
|
Myocarditis
Myocarditis is an acute or chronic inflammatory disease of the myocardium and is an important underlying etiology of other myocardial diseases. The clinical presentation of acute myocarditis is heterogeneous (ranging from asymptomatic to sudden cardiac death) and coronary angiography is often required to exclude acute coronary syndrome. Myocarditis is characterized by direct cardiomyocyte injury, accompanied by edema, necrosis, and regional or global contractile dysfunction.66)67)68)69)
CMR shows multiple patchy or nodular areas of high T2 signal intensity and delayed enhancement, predominantly in the sub-epicardial and inferolateral portions of the LV. The extent of delayed enhancement is gradually decreased on follow-up. In the chronic phase, the remaining delayed enhancement lesions reflect the late post-inflammatory fibrotic phase, featuring scar formation and irreversible damage to the LV wall, as well as LV dilation.70)71) In patients with acute chest pain and elevated cardiac biomarkers, cardiac CT may facilitate the differentiation of myocarditis and acute coronary syndrome via characteristic midwall or subepicardial delayed enhancement and the absence of significant CAD during the same examination (Figure 14). Bouleti et al.72) demonstrated that multi-energy delayed phase cardiac CT showed 95% diagnostic accuracy for detecting inflammatory segments (delayed iodine enhancement) compared with delayed enhancement CMR in 20 patients with acute myocarditis. In addition, cardiac CT may be used to demonstrate global or regional LV wall motion abnormalities.73) Accordingly, cardiac CT is a promising substitute for CMR and conventional coronary angiography in patients with suspected acute myocarditis.
 | Figure 14Myocarditis in a 25-year-old male who had complained of dyspnea for 10 days. Short-axis multiplanar reformatted image of delayed-phase cardiac computed tomography shows midwall delayed enhancement in the mid anteroseptum (arrow) and subepicardial enhancement in the lateral and anterior left ventricular wall (arrowheads).
|
LV HYPERTROPHY RELATED TO INCREASED AFTERLOAD
Hypertension
Hypertension is highly prevalent and remains one of the most relevant cardiovascular risk factors. The high mortality rates of hypertension patients are related to LVH. Echocardiographic signs of LVH are seen in 20%-40% of patients with hypertension. Hypertensive hearts usually show concentric LVH and interventricular septal thickness increases of up to 15 mm (Figure 15). Left atrial dilation is also seen in hypertension.74)75) Diffuse myocardial fibrosis is frequently seen but poorly evaluated with delayed enhancement CMR. Rodrigues et al.76) demonstrated asymmetric hypertrophy of the mid to basal septum (asymmetric end-diastolic wall thickness of ≥ 15 mm and > 1.5-fold the opposing myocardial segment in ≥ 1 segments) in 21% of a purely hypertensive cohort. Asymmetric hypertensive heart disease overlaps morphologically with HCM based on the end-diastolic wall thickness threshold of 15 mm advocated by the European HCM guidelines. Cardiac CT allows measurements of LV mass, volume, and wall thickness, and excludes CAD in patients with hypertension. However, issues regarding the use of radiation and nephrotoxic iodinated contrast remain.
Aortic stenosis
AS is the most frequent type of valvular heart disease (VHD) in the elderly, and is increasing in prevalence.77) The main causes of AS are age-related: degenerative calcified AS of tricuspid aortic valve, a congenital bicuspid aortic valve, and rheumatic VHD. AS increases LV afterload and causes compensatory LVH. LVH leads to reversible myocardial ischemia and irreversible myocardial injury, such as interstitial myocardial fibrosis.78) Therefore, AS is a disease of both the aortic valve and LV myocardium. Usually, the LV wall is symmetrically hypertrophied in AS, and occasionally an area of the LV shows a nonuniform pattern of hypertrophy (asymmetrical septal hypertrophy).79) Dweck et al.80) demonstrated that the pattern of LV adaptation and degree of hypertrophy were not correlated with the severity of valve narrowing. Asymmetric patterns of wall thickening were common (27%) in patients with moderate-to-severe AS. Several studies have shown that focal myocardial fibrosis appears as a diverse pattern of midwall delayed enhancements on delayed enhancement CMR images in patients with severe AS (Figure 16).80)81)82)
 | Figure 16Severe aortic valve stenosis in a 79-year-old man with chest discomfort and shortness of breath. (A) Double oblique multiplanar reformatted (MPR) image of aortic valve shows thickened and calcified cusps of the bicuspid aortic valve (arrowheads) with a severely reduced opening (aortic valve area of 82 mm2) during early systole. (B) Short-axis MPR image shows the hypertrophied mid left ventricular (LV) wall, and particularly asymmetric septal hypertrophy (arrowheads). Delayed-phase cardiac computed tomography (CT) (C) and cardiovascular magnetic resonance (CMR) (D) images show delayed subendocardial hyperenhancement in the lateral and inferior LV wall (arrowheads). Diffuse midwall delayed enhancement in the LV septum (arrows) is only identified on delayed-enhancement CMR. Delayed enhancement CMR is superior to delayed-enhancement cardiac CT for the depiction of patterns of delayed myocardial enhancement.
|
Cardiac CT is an important imaging modality in severe AS patients who are indicated for surgical valve replacement or transcatheter aortic valve replacement, because it provides detailed anatomic information about the aortic valve, coronary artery, ascending thoracic aorta, and LV.83) Recently, Song et al.84) showed that aortic valve calcium volume score on cardiac CT was associated with severity of myocardial fibrosis in severe AS patients. Bandula et al.20) showed that there was a significant correlation between both equilibrium cardiac CT - and equilibrium CMR imaging-derived ECV and percentage of histologic fibrosis (r = 0.71, p < 0.001 and r = 0.84, p < 0.0001, respectively). Accordingly, delayed phase cardiac CT has potential to assess myocardial fibrosis with delayed enhancement pattern and ECV measurement. However, the role of myocardial fibrosis imaging by cardiac CT is not established in clinical practice.
SIGMOID SEPTUM
Sigmoid septum is characterized by isolated basal septal hypertrophy (> 14 mm in thickness or basal-septal wall thickness ≥ 2 mm thicker than the mid-septal wall thickness) and the absence of septal abnormalities, with normal wall thickness elsewhere in older normal subjects. However, the condition is more prevalent in elderly subjects with higher systolic blood pressures (Figure 17).85)86) Sigmoid septum is associated with increased angulation between the aorta and LV cavity and is mainly caused by pressure overload from hypertension.87) Sigmoid septum in patients with hypertension is a very early sign of hypertensive heart disease, indicating LV remodeling with increasing regional wall thickness and reduced local myocardial function.85) Cardiac CT provides anatomical information about the LV wall, particularly the basal-to-mid interventricular septum, with delayed contrast enhancement on 3-chamber and short-axis multiplanar reformatted images.
 | Figure 17Sigmoid septum of a 77-year-old male without hypertension. A three-chamber multiplanar reformatted image of early-phase cardiac computed tomography shows focal hypertrophy of the basal inter-ventricular septum (arrowheads) without hypertrophy elsewhere within the myocardium mid-diastole in the left ventricular outflow tract.
|
CONCLUSIONS
Multiple imaging modalities are required for detailed and comprehensive evaluations of patients with LV myocardial disease. Echocardiography and CMR are indispensable tools in the diagnosis of LV myocardial diseases. Rapid advances in CT techniques with high temporal and spatial resolution facilitate the assessment of LV myocardial pathology beyond coronary artery evaluation. Cardiac CT has yielded promising results for the detection and characterization of LV myocardial diseases in several ways, particularly for the evaluation of coronary arteries, quantification of LV function, elucidation of detailed morphological characteristics, and myocardial perfusion and scar imaging. These data may be collected all at one sitting. In particular, single- and multi-energy delayed phase cardiac CT can be used for assessing cases of diffuse myocardial fibrosis such as CMR and under-diagnosed and treatable causes of LVH and heart failure, particularly in patients with contraindications to CMR imaging.7)20)21) Even though cardiac CT is not recommended as the primary method of choice in cases of suspected LV myocardial disease, it may be useful in specific situations when echocardiography or CMR are not suitable.
 XML Download