

 PDF
PDF ePub
ePub Citation
 Print
Print


INTRODUCTION
Mitral stenosis (MS) is the narrowing of the mitral valve orifice. It is almost always rheumatic in origin, although the incidence of degenerative MS due to heavy calcification of the mitral valve apparatus is increasing in elderly populations.1) The mitral valve orifice is slowly narrowed by progressive fibrosis, calcification of the valve leaflets, and fusion of the cusps and subvalvular apparatus.2) Severe or significant MS is diagnosed when the planimetered mitral valve area (MVA) is 1.5 cm2 or less. MS with an MVA of >1.5 cm2 is categorized as progressive MS and is generally considered clinically insignificant.1)3) The indication for intervention is limited to patients with clinically significant MS with an MVA ≤1.5 cm2, and there are limited treatment options for progressive MS. Percutaneous mitral valvuloplasty (PMV) may be considered in symptomatic patients with an MVA >1.5 cm2 if symptoms cannot be explained by another cause or if there is evidence of hemodynamically significant MS during exercise.1)3) Regular echocardiographic follow-up at 3–5-year intervals is the only current recommendation for patients with progressive MS,1) and strategies to identify patients at a high risk of adverse cardiac events have not been established. Therefore, we aimed to identify clinical and echocardiographic predictors for adverse events in patients with progressive MS of an MVA between 1.5 and 2.0 cm2 and to establish associated factors.
METHODS
Patients
We retrospectively reviewed patients diagnosed with rheumatic progressive MS (MVA between 1.5 and 2.0 cm2) who underwent echocardiography at a tertiary referral hospital for valvular heart disease from January 2004 to December 2016. The exclusion criteria were as follows: > 1+ mitral valve regurgitation, > 1+ aortic valve regurgitation and/or a condition more severe than mild aortic stenosis, congenital or myopathic lesions that could affect the left ventricular (LV) function or pulmonary artery pressure, and a history of PMV. Therefore, the sample for analysis included 225 patients with rheumatic pure progressive MS. Hypertension was defined as a systolic blood pressure (BP) of ≥ 140 mmHg and/or a diastolic BP of ≥ 90 mmHg or use of antihypertensive agents. Diabetes mellitus was defined as receiving anti-diabetic treatment or a fasting plasma glucose level of ≥ 126 mg/dL. Dyslipidemia was defined as the use of cholesterol-lowering medication or a serum total cholesterol level of ≥ 200 mg/dL. CHA2DS2-VASc score was calculated on the basis of the presence of congestive heart failure, hypertension, age, diabetes mellitus, prior stroke or transient ischemic attack, vascular disease, and female sex, as previously described by Lip et al.4) Vascular disease prior to myocardial infarction and peripheral artery disease was included. Kidney function was ascertained by the estimated glomerular filtration rate (GFR), calculated using the formula developed and validated in the Modification of Diet in Renal Disease(MDRD) study as follows5): GFR (mL/min/1.73 m2) = 186.3 × (serum creatinine [mg/dL]-1.154 × age-0.203 (× 0.742, if female). This study was approved by the Institutional Review Board of Yonsei University, Severance Hospital, Seoul, Republic of Korea.
Echocardiographic examination
The LV end-diastolic dimension (LVEDD), LV end-systolic dimension (LVESD), septal thickness, and LV posterior wall thickness were measured at end-diastole from the parasternal short-axis view. The LV ejection fraction (LVEF) was calculated using the LVEDD and LVESD. The LV mass was calculated using the formula set forth by the American Society of Echocardiography,6) and the LV mass index (LVMI) was the indexed LV mass for the body surface area (BSA). The left atrial (LA) volume was calculated from the parasternal long-axis view and apical four-chamber view using the prolate ellipse method.7) The LA volume index (LAVI) was the indexed LA volume for the BSA. The systolic pulmonary artery pressure (SPAP) was calculated as follows: 4 × (maximum velocity of the tricuspid regurgitant jet)2 + right atrial pressure. The right atrial pressure was estimated by measuring the inferior vena cava diameter and its response to inspiration.8) The mean diastolic pressure gradient (MDPG) was measured from a continuous wave Doppler signal across the mitral valve by tracing its envelope. The MVA was assessed using two-dimensional planimetry. The MVA by pressure half time (PHT) was calculated using the formula 220/PHT.9) The net atrioventricular compliance (Cn) was determined using the following equation: Cn (mL/mmHg) = 1270 × (planimetric MVA/E-wave downslope).10)11) The echocardiographic measurements were averaged for three beats in patients with sinus rhythm and for five beats in those with atrial fibrillation (AF). Severe tricuspid regurgitation (TR) was defined in accordance with the American Society of Echocardiography guidelines.12)
Study endpoint
The patients were followed up across a median of 52 months (interquartile range, 17–95 months) for a composite endpoint that included cardiac deaths, inpatient admissions for heart failure, mitral valve replacement (MVR), PMV, and ischemic stroke. The occurrence of any of the aforementioned clinical events that comprised the composite study endpoint was ascertained by a review of hospital records and by telephone interview, as necessary.
Statistical methods
The demographic characteristics were reported as percentages or mean ± SD. The patient groups were compared using chi-square statistics for categorical variables and Student's t-test for continuous variables. Receiver-operating characteristic (ROC) curves were plotted to determine the sensitivity and specificity of the different echocardiographic variables in predicting all events and to determine the cut-off value. The ROC curves were compared using a procedure previously described by DeLong et al.13) Univariable and multivariable Cox proportional hazards regression models reporting the hazard ratios (HRs) and 95% confidence intervals (95% CIs) were employed to determine potentially useful variables for predicting the event-free survival rate following echocardiography. Variables that displayed statistical significance in the univariable analysis were entered in the multivariable Cox model. Kaplan-Meier survival curves were used to plot all clinical events according to the time-to-first event. In an effort to determine potential independent associations between the clinical factors and LAVI, linear relationships were checked using univariable linear regression analysis. Variables displaying statistical significance in the univariable analysis were entered into a multivariable linear regression model. A p-value < 0.05 was considered statistically significant.
RESULTS
Baseline clinical characteristics
The baseline characteristics of the study population are shown in Table 1. Mean patient age was 62 ± 12 years; approximately 75.6% of them were women, and 27.1% were symptomatic. The mean MVA via planimetry was 1.74 ± 0.14 cm2. The patients were classified into two groups according to the occurrence of the primary endpoint. Patients who experienced the study endpoint had a higher incidence of prior stroke (24.4% vs. 7.1%, p = 0.001).
Table 1
Baseline characteristics
AF: atrial fibrillation, ALT: alkaline phosphatase, AST: aspartate aminotransferase, BP: blood pressure, Cn: net atrioventricular compliance, GFR: glomerular filtration rate, LAVI: left atrial volume index, LVEDD: left ventricular end-diastolic diameter, LVEF: left ventricular ejection fraction, LVESD: left ventricular end-systolic diameter, LVMI: left ventricular mass index, MDPG: mean diastolic pressure gradient, MVA: mitral valve area, SPAP: systolic pulmonary artery pressure, TR: tricuspid regurgitation.
Data are shown as number (%).
No significant differences in demographic characteristics, including age, sex, BSA, hypertension, diabetes, dyslipidemia, current smoking, prior vascular disease, symptomatic status, BP, and medications, were found between the groups. The prescription rate of renin-angiotensin system blockers was higher in patients with events (p = 0.020). Eighty patients (35.6%) used anticoagulants. The only anticoagulant used was a vitamin K antagonist; none of the patients received direct oral anticoagulants. The LAVI was higher in patients with events than in those without events (66.1 ± 25.5 mL/m2 vs. 51.8 ± 22.9 mL/m2, p < 0.001), whereas the LVEDD, LVESD, LVEF, LVMI, MVA, MDPG, Cn, SPAP, and prevalence of severe TR were not significantly different between groups (all p ≥ 0.05).
Predictors for clinical outcomes
Over the course of the study period, a total of 41 patients (18.3%) experienced the composite endpoint. Specifically, three patients (1.3%) experienced death from cardiac causes; eight (3.6%) inpatient admissions for heart failure; 12 (5.3%) MVRs; two (0.9%) PMVs; and 16 (7.1%) strokes.
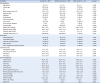
The results of the ROC curve analysis for the prediction of the composite endpoint are shown in Figure 1. The area under curve (AUC) was 0.701 (95% CI, 0.636–0.760) for the LAVI, 0.522 (95% CI, 0.454–0.590) for the LVEF, 0.538 (95% CI, 0.470–0.605) for the LVMI, 0.514 (95% CI, 0.446–0.582) for the planimetered MVA, and 0.538 (95% CI, 0.470–0.605) for the MDPG. The differences between the AUC of the LAVI and those of other variables, including LVEF, LVMI, MVA, and MDPG, were all significant (all p < 0.05). The optimal cut-off value according to the ROC curves for the LAVI was 50 mL/m2 (sensitivity = 78.0%, specificity = 59.8%).
Figure 1
Comparison of the ROC curves for the prediction of adverse events in patients with progressive mitral stenosis. Area under curve: LAVI = 0.701 (95% CI, 0.636–0.760), LVEF = 0.522 (95% CI, 0.454–0.590), LVMI = 0.538 (95% CI, 0.470–0.605), MVA = 0.514 (95% CI, 0.446–0.582), and MDPG = 0.538 (95% CI, 0.470–0.605). CI: confidence interval, LAVI: left atrial volume index, LVEF: left ventricular ejection fraction, LVMI: left ventricular mass index, MDPG: mean diastolic pressure gradient, MVA: mitral valve area, ROC: receiver-operating characteristic.
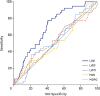
Table 2 shows the baseline characteristics and endpoints during follow-up in the subgroup of 93 patients with AF. Of the patients, 58 (62.4%) received anticoagulation and 35 (37.6%) did not. The prevalence of a CHA2DS2-VASc score ≥ 2 was higher in the patients who received anticoagulation than in those who did not receive anticoagulation (67.2% vs. 54.3%), although the difference was not statistically significant. The composite endpoint did not statistically differ between the groups, but the actual prevalence of stroke was higher in the patients who did not receive anticoagulation (11.4% vs. 6.9%). When the AF patients were grouped according to the CHA2DS2-VASc score, 36 patients had CHA2DS2-VASc scores < 2 and 57 had CHA2DS2-VASc scores ≥ 2. The patients with CHA2DS2-VASc scores ≥ 2 showed a higher stroke prevalence during follow-up, but this difference was not statistically significant (2.8% vs. 12.3%, p = 0.111).
Table 2
Characteristics of the subgroup patients with atrial fibrillation
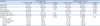
Table 3 shows the results of the univariable Cox regression analysis for the prediction of the composite endpoint. Prior stroke (HR, 3.84; 95% CI, 1.87–7.92; p < 0.001) and a LAVI > 50 mL/m2 (HR, 4.19; 95% CI, 2.05–8.57; p < 0.001) were the predictors for the composite endpoint. Table 4 describes the results of the multivariable Cox regression analysis for the prediction of the composite endpoint. In various multivariable models, prior stroke and a LAVI > 50 mL/m2 were the independent predictors of the composite endpoint (all p < 0.05), even after adjustment for variables.
Table 3
Univariable Cox regression analysis for the prediction of the composite endpoints
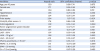
Table 4
Multivariate Cox regression analysis for the prediction of the composite endpoints
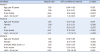
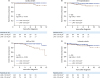
Figure 2 shows the event-free survival rates for the composite endpoint stratified by the LAVI. Notably, patients with a LAVI ≤ 50 mL/m2 demonstrated a favorable event-free survival compared with those with a LAVI > 50 mL/m2 in the overall population (log-rank p < 0.001) and asymptomatic patients (log-rank p = 0.002). Figure 3 shows the Kaplan-Meier curve of event-free survival rates for each endpoint stratified by the LAVI in the overall population. The patients with a LAVI ≤ 50 mL/m2 demonstrated a favorable event-free survival compared with those with a LAVI > 50 mL/m2 regarding cardiac death, heart failure hospitalization, and MVR or PMV (all log-rank p < 0.05). There were fewer stroke events in the patients with a LAVI ≤ 50 mL/m2, although this was not significantly different (log-rank p = 0.140).
Figure 2
Kaplan-Meier curve showing the event-free survival rate for the composite primary endpoint stratified by the LAVI. Overall population (A) and asymptomatic patients (B). LAVI: left atrial volume index.
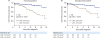
Figure 3
Kaplan-Meier curve showing the event-free survival rate for the individual endpoints stratified by the LAVI in the overall population. Cardiac death (A), HF hospitalization (B), MVR or PMV (C), and ischemic stroke (D). HF: heart failure, LAVI: left atrial volume index, MVR: mitral valve replacement, PMV: percutaneous mitral valvuloplasty.
Determinants of the LAVI
Table 5 shows the results of the univariable and multivariable linear regression analyses for the factors associated with the LAVI in progressive MS. In the univariable analysis, age (beta = 0.215, p = 0.001), AF (beta = 0.428, p < 0.001), LVMI (beta = 0.223, p = 0.001), MVA by planimetry (beta = -0.199, p = 0.003), MDPG (beta = -0.199, p = 0.003), and Cn (beta = -0.155, p = 0.020) showed significant correlations with the LAVI. In the multivariable analysis, AF, LVMI, MVA, and MDPG were the factors independently associated to LAVI, even after adjusting for age and Cn.
Table 5
Univariable and multivariable linear regression analyses for the factors associated with the left atrial volume index in progressive mitral stenosis
DISCUSSION
The principal findings of the current study are as follows: 1) approximately 18.3% of patients with progressive MS experienced cardiovascular events during the median follow-up period of 55 months; 2) a LAVI >50 mL/m2 was a prognostic marker for adverse cardiac events; and 3) LVMI, severity of MS, and presence of AF were independent determinants of the LAVI in progressive MS.
Therapeutic strategies for progressive MS
Progressive MS is usually considered benign, and specific therapies are not recommended, except for regular follow-ups at 3–5-year intervals.1) Notably, 18.3% of the studied population experienced adverse events during a median follow-up of 4 years. The number of MVRs or PMVs that were performed, significantly increased 3 years from the first diagnosis of progressive MS. Therefore, our data suggest that follow-up at 3-year intervals might be an appropriate option for detecting the progression of disease in MS, considering the relatively high incidence of events during follow-up in progressive MS.
Surprisingly, the incidence of AF in our study was approximately 40% in all patients, and 10% had a history of stroke at baseline, although progressive MS is usually considered clinically insignificant. AF in progressive MS is basically categorized as nonvalvular AF in the recent guidelines.14) However, specific data regarding anticoagulation strategies, including vitamin K antagonist or non-vitamin K antagonist oral anticoagulant administration and the prognostic role of the CHA2DS2-VASc score4) in targeting progressive MS with AF, are lacking. Additionally, the treatment options for progressive MS with a sinus rhythm have been investigated less. Adequate anticoagulation should be considered for AF patients with progressive MS, as our retrospective analysis showed that many of the patients with progressive MS who had high CHA2DS2-VASc scores did not receive anticoagulation and that > 12% eventually had a stroke during a median follow-up of 52 months. Therefore, adequate anticoagulation directed by the CHA2DS2-VASc score is essential for the treatment of progressive MS. Moreover, specific therapeutic strategies for progressive MS according to risk stratification need further investigation.
LAVI as a predictor for progressive MS
The LAVI is a prognostic marker for cardiovascular outcomes in the general population,15)16) as well as various heart diseases, such as heart failure,17) hypertrophic cardiomyopathy,18)19) and ischemic cardiomyopathy.20)21) In valvular heart disease, the LAVI was a prognostic marker for cardiovascular outcomes after mitral valve surgery22) and in medically treated patients with mitral regurgitation.23)
The ability of the LAVI to predict outcomes in patients with MS is less clear. Ancona et al.24) reported that LA volumes did not predict the AF incidence in patients with MS, although the increase in the upstream pressure usually leads to progressive enlargement of the LA in MS. We found that the LAVI may serve as a prognostic marker in progressive MS. This discrepancy might have resulted from the fact that our population was composed of patients with less severe MS and an MVA > 1.5 cm2; therefore, the influence of MS severity on the outcomes was attenuated, and the prognostic power of the LAVI was enhanced. The LAVI might also be applicable for each event, such as cardiac death, heart failure hospitalization, mitral valve intervention, and probably stroke, aside from the composite endpoint. Prior stroke was a powerful predictor for the future incidence of stroke but did not predict other cardiac events. In contrast, a high LAVI > 50 mL/m2 was the only independent universal predictor for various cardiac events in progressive MS, which could be helpful for risk stratification in this population.
Determinants of the LAVI in progressive MS
We found that multiple factors are associated with the LAVI in progressive MS. The associated factors were AF, MVA, MDPG, and LVMI. It is not surprising that AF, MVA, and MDPG were factors associated with the LAVI, since AF induces LA electrical and mechanical remodeling,25) and the increase in the upstream pressure usually leads to progressive enlargement of the LA. Interestingly, we found that the LVMI was also closely associated with the LAVI in progressive MS. LV hypertrophy is associated with diastolic dysfunction and LV end-diastolic pressure increase, which can further exaggerate LA pressure increase and result in LA enlargement. We previously reported that LV diastolic function was an important factor of MDPG and LA reverse remodeling in patients with severe MS.26) Similarly, LV hypertrophy and associated LV diastolic function might exaggerate LA enlargement and accelerate poor clinical outcomes. Therefore, LV hypertrophy and diastolic dysfunction can be a target of treatment for progressive MS, although the assessment of diastolic function in patients with MS is challenging.27)
Limitations
Several limitations need to be acknowledged. The current study findings were based on a retrospective analysis, which may infer some biases. Despite this, we carefully reviewed all medical records, along with echocardiographic images, in an effort to avoid any possible biases that may have arisen. Information regarding the duration of AF, which might have a significant impact on the outcomes, was unavailable. The reason for the low prevalence of anticoagulation in the AF patients is unclear as this study was a retrospective analysis and the patients were followed up and treated in accordance with the preference of the dedicated attending physician. TR can lead to hepatic congestion and fluctuation in the degree of anticoagulation, which can result in brain hemorrhage and ischemic stroke. However, severe TR was present in only one patient; therefore, its clinical significance cannot be determined in the present study and further investigation is warranted. The studied population consisted of patients at high risk of cardiovascular disease, with a high incidence of AF, hypertension, diabetes, and prior stroke. In addition, approximately 27% of patients were symptomatic, although they had clinically insignificant MS, and this might have caused a high incidence of the composite endpoint. As this study was performed retrospectively, it was difficult to clearly define etiology in all symptomatic patients. Exercise echocardiographic data were not available, and would be beneficial for risk stratification among patients with progressive MS symptoms in future studies.
 XML Download