

 PDF
PDF ePub
ePub Citation
 Print
Print


INTRODUCTION
Education and nurture have been postulated to affect development of brain structures in the human.1 In 1960, Krech et al.2 found that an enriched environment during development potentiates the growth of total brain weight and cortical thickness. Cellular-level analyses of the cerebral cortices of cats showed that development in an enriched environment increases cortical synapse-to-neuron ratios,3 numerical densities of neurons, and sizes of neuronal nuclei.45 Whether the benefits of environmental enrichment during development have lifelong effects was an open question. In 1988, Katzman et al.6 introduced the cognitive reserve theory to explain the poor correlation between the neuropathological deficit and clinical severity of Alzheimer's disease (AD). AD patients with higher premorbid educational levels showed more severe neuropathologic changes than those with lower premorbid educational levels, even though the two groups were able to maintain the same clinical status.7 In other words, greater brain damage was required to reduce educated patients to the same level of function as uneducated patients. This theory was supported by the finding that years of education influenced the relation between senile plaques and level of cognitive function.8 The increased prevalence of late-onset AD789 and rapid memory decline1011 in people with less education are further evidence for the theory.
The cognitive reserve theory is based on findings concerning neuropsychological and pathological changes in patients with dementia. However, there are only a few computed tomography and magnetic resonance imaging (MRI) studies revealing effects of education in cognitively normal persons. One of these studies found that during sustained attention the metabolic rates of the cortical areas: bilateral lingual, left posterior cingulate gyri, and left precuneus, are related to educational level.12 Coffey et al.13 revealed a significant independent effect of education on sulcal cerebrospinal fluid volume, a marker of cortical atrophy in normal aging.
We hypothesize that neural structure and function in people of lower educational attainments are different from those of more highly educated people. In accordance with that theory, we have previously performed a study using fluoro-deoxyglucose positron emission tomography (PET), which showed that illiterate subjects have cerebral hypometabolism relative to literate subjects in many cerebral areas, predominantly frontal lobe and cerebellum.14 Because we found cerebral functional differences between educational levels,14 we then searched for structural differences between the brains of literate and illiterate persons. We hypothesized that illiterate subjects will have a smaller brain volume and thinner cerebral cortex in all lobes when compared with literate individuals, which might explain the observed lower performance in neuropsychological tests.
To our knowledge, no previous studies have addressed this issue and the relative predictive value of brain volume data compared with neuropsychological tests is not known. For this purpose, we compared the results of neuropsychological tests and calculated cerebral cortical volumes and cortical thicknesses, using MRI volumetry, between normally functioning elderly illiterate and literate individuals.
METHODS
Subjects
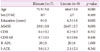
We recruited 7 illiterate and 9 literate subjects, aged 65 and over as of January 2008. All subjects were raised in Goryung County in the southern part of South Korea and had lived as farmers throughout their lives. All were right-handed. Subjects were classified as illiterate if they had never received formal public or private education in reading and writing and also lacked an informal knowledge of reading or writing, including the inability to read or write their own names. These participants had remained illiterate for cultural reasons. In contrast, the literate participants had more than 6 years of public education. All of the literate subjects could read and write their names and addresses, as well as read newspapers and books. Subjects were classified as cognitively normal on the basis of extensive neurological and neuropsychological test interviews. We excluded subjects with neurological or psychiatric illnesses, low visual or auditory acuity, motor weakness, severe systemic illnesses, or lack of motivation. We also excluded secondary causes of cognitive decline with the aid of extensive laboratory tests including complete blood count, thyroid function tests, serum electrolytes, liver function tests, renal function tests, serum calcium, fasting blood sugar, syphilis serology, lipid battery, electrocardiography and chest X-ray. In addition, subjects with cerebral infarction, brain tumor, demyelinating disease, or other significant pathological findings in brain MRI were excluded. The demographic characteristics of the 16 subjects are shown in Table 1. This study was approved by the Institutional Review Board of Daegu Catholic University Medical Center. Informed consent was obtained from all subjects.
Neuropsychological tests
We performed a standardized neuropsychological battery, the Seoul Neuropsychological Screening Battery,15 on all subjects. The battery contains tests for attention, language, praxis, four elements of Gerstmann syndrome, visuoconstructive function, verbal and visual memory, and frontal/executive function. Among these tests, the components that could be scored were: digit span (forward and backward); the Korean version of the Boston Naming Test; written calculations (three problems each in addition, subtraction, multiplication, and division; one point for each correct answer); the Rey-Osterrieth Complex Figure Test, comprising copying, immediate and 20-minute delayed recall as well as recognition; the Seoul Verbal Learning Test (SVLT), comprising three learning-free recall trials of 12 words, a 20-minute delayed recall trial for these 12 items, and a recognition test; the phonemic and semantic Controlled Oral Word Association Test (COWAT); the Stroop Test, comprising word and color reading of 112 items in two minutes; and the Barthel-activities of daily living (ADL), on which only a perfect score was considered normal. The instrumental ADL was also done, using a cut-off point of less than 8.16 The Stroop test was not applied to the illiterate group due to their inability to read.
Brain MRI
MRI data were obtained on a 1.5-T system (MR Excite; GE Medical Systems, Milwaukee, WI, USA). A three-dimensional T1-weighted, spoiled gradient-recalled echo of the whole head, designed to optimally discriminate between brain tissues (echo time=min Full, flip angle=20 degrees, 224 contiguous slices, matrix size=224×320, 1.07×0.75×1.00 mm3 voxels), was acquired. To ensure high quality, all of the raw data underwent a series of visual quality control checks that included the level of intensity homogeneity within/between slices, the amount of movement artifact, and the amount of geometric distortion.17 Native MR images were normalized into a standardized stereotaxic space using a linear transformation and corrected for intensity nonuniformity.1819 The registered and corrected volumes were classified into white mater, gray matter, cerebrospinal fluid, and background using an advanced neural-net classifier.20 The hemispheric surfaces of the inner and outer cortex, which consisted of 40962 vertices, were automatically extracted using the Constrained Laplacian-Based Automated Segmentation with Proximities algorithm.21 Then we employed an iterative surface registration algorithm with an unbiased iterative group template showing enhanced anatomic detail to ensure between-individual correspondence at each vertex of the cortical surface model.22 For regional analysis, automatic lobar parcellation, which had been validated and performed efficiently in previous studies, was applied for dividing individual cortical surfaces into frontal, temporal, parietal, and occipital lobes.2324 The surface-based parcellation was performed using CIVET pipeline (http://www.bic.mni.mcgill.ca/ServicesSoftware/CIVET).
Cortical volume
Extracted inner and outer cortical surfaces in native space were masked to original images. We isolated the voxels of the cerebral cortex that were located between two surfaces. The cortical volume was calculated by measuring the volume of the voxels in the whole cortex and in each lobar region.
Cortical surface area
Cortical surface area, a number which suggests the overall degree of folding, was measured.252627 The middle cortical surface lies at the geometric midpoint between the inner and outer cortical surfaces. It provides a relatively unbiased representation of sulcal versus gyral regions. In contrast, the inner cortical surface model over-represents gyral regions.28 We used the middle cortical surface to calculate the surface area of the whole cortex and of each lobar region, which was the straightforward sum of the areas of the triangles making up the surface model.
Cortical thickness
The inner and outer surfaces had the same number of vertices, and there was a close correspondence between the counterpart vertices of the inner and outer surfaces. Cortical thickness was defined as the Euclidean distance between these linked vertices.29 We measured the averaged value of the thickness in the whole cortex and in each lobar region.
Gyrification index measurement and cortical complexity
The middle cortical surface was divided into sulcal and gyral regions by thresholding the depth map, i.e., the three-dimensional Euclidean distance from each vertex to the nearest voxel on the convex hull volume.2330 The threshold of the depth map was determined from the fact that the human cerebral cortex is a highly folded sheet with 60–70% of its surface area buried within folds.3132 The mean gyrification index was defined as the ratio between the total surface area and the superficially exposed surface area, the latter being the gyral regions in each hemisphere and lobe.33 Cortical complexity reflects the frequency of sulcal and gyral convolutions, which was calculated from a spherical surface mesh deformed hierarchically onto the cortex. The surface inflation technique was applied to the middle cortical surface, and then the rate of decreasing cortical areas with increasing inflation frequency (n=2–256) was estimated as the complexity by least-squares fitting of a linear model.34 Intuitively, a complexity value larger than 2 indicates an increase in the cortical surface detail and cortical folding degree.
Statistical methods and analyses
For group analysis, independent t-test (Mann-Whitney U test) and Pearson's chi-square test for continuous and categorical variables were used to identify differences between the illiterate and literate groups (Table 1 and 2).
The mean value for cortical thickness obtained from each vertex in native space was calculated to provide a map of average cortical thickness across the hemisphere. Localized regional differences in cortical thickness between illiterate and literate subjects was analyzed using an independent two-sample t-test (Table 3). The statistical analysis of regional cortical thickness was performed on each vertex and a statistical map of differences in cortical thickness between illiterate and literate subjects was constructed on a surface model. There were 40962 vertices in the cortical surface model in all vertex-wise analyses, so a control for the false-positive rate for multiple comparisons was included. Correction for multiple comparisons was performed using the false discovery rate calculation at a q-value of 0.05.35 Corrected probability values (p<0.05) from these tests were mapped directly onto the cortical surface template, providing maps of local thickness differences between groups. The statistical significance of group differences in lobar measures such as cortical volume, cortical thickness, surface area, gyrification index, and complexity was assessed with t-tests. SPSS for Windows version 19.0 (SPSS Inc., Chicago, IL, USA) was used for all statistical analyses and p-values<0.05 were regarded as statistically significant.
RESULTS
Neuropsychological tests
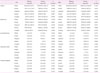
Table 1 presents the general cognitive indices and Table 2 summarizes the results of detailed neuropsychological testing. The mean Mini-Mental Status Examination score of the illiterate group was lower than that of the literate group. In contrast, the mean global Clinical Dementia Rating score of the illiterate group did not show significant differences compared with that of literate group. The physical ADL scores were perfect in both groups and the instrumental ADL did not show significant differences between the two groups (Table 1). Illiterate subjects scored lower in most cognitive domains compared with educated subjects. Specifically, although no difference was noted in forward digit span (p=0.067), illiterate subjects were poorer at backward digit span (p=0.020). They also had lower scores than literate subjects in the Boston naming test (p=0.006), calculations (p=0.001), the Rey figure copy test (p=0.000), free recall (p=0.008), delayed recall (p=0.005), and the recognition test (p=0.000). The SVLT test of free recall (p=0.001) and delayed recall (p=0.013), and the phonemic COWAT (p=0.000) also showed lower scores in the illiterate subjects (Table 2). There was no significant difference in tool-use and tool-free gestures.
Regional tissue volume
Table 3 shows the cortical volume data for illiterate and literate groups. Parietal lobe volume was smaller in illiterate than literate groups in both hemispheres and the difference between illiterate and literate was greater in the right hemisphere (p=0.0016 vs. 0.0427). All the other lobes also showed smaller volumes in the illiterate group, but without reaching statistical significance.
Regional surface area
Table 3 shows the illiterate and literate results for cortical surface area. Parietal lobe surface area was smaller in illiterate than literate groups in both hemispheres. All other lobes also showed smaller surface areas in the illiterate group, but without reaching statistical significance.
Cortical thickness
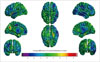
Table 3 shows the cortical thicknesses data for illiterate and literate groups; no lobes showed significant interhemispheric differences. However, there seemed to be a tendency toward smaller cortical thicknesses in the illiterate brain, especially in the right hemisphere and frontal lobe. Fig. 1 shows the vertex-based estimation of the effect of illiteracy on cortical thickness and shows a larger difference in cortical thickness in right hemisphere. Interestingly, the left cuneus showed a greater cortical thickness (mean difference, 3.5 mm) in illiterate than literate groups (Fig. 1).
Gyrification index
Table 3 shows the illiterate and literate group results for gyrification index. No lobes showed significant differences between hemispheres.
Cortical complexity
Table 3 shows the illiterate and literate group results for cortical complexity. No lobes showed significant differences between hemispheres.
DISCUSSION
This study sought to assess whether illiteracy is related to smaller regional brain volume, thinner cortical thickness, and poorer neuropsychological function in elderly normal individuals. The illiterate group showed poorer performance in all cognitive areas, with a few exceptions. Analysis of brain MRI data showed that relative to the literate group, the illiterate group had decreased cortical volume and surface area in both parietal lobes significantly. Interestingly, the illiterate group showed a relatively greater cortical thickness in the left cuneus.
The illiterate group in our cohort was unique in some respects. They lacked formal education only because of their cultural backgrounds and had lived more than 65 years without knowledge of letters. The literate group also was unique. Every literate individual had more than 6 years of education; this period of education confers perceptual expertise regarding letters.36 Moreover, they had the same regional and occupational background as the illiterate group. Therefore, the effects of literacy and formal educat ion in a non-demented elderly population may easily be isolated by comparison of our two groups.
In accordance with our hypothesis, neuropsychological tests showed that the illiterate participants had significantly lower scores in most cognitive tests than literate participants. Interestingly, there were several cognitive tests that did not show significant differences between the two groups. These items were forward digit span, tool-use and tool-free gestures, verbal word recognition, and verbal generation of animals and grocery items. The reason why forward digit span did not show a statistical difference between groups may be explained by the fact that forward digit span measures basic attentional ability, which is unaffected by literacy. In contrast, there was a significant difference in backward digit span between the two groups. Backward digit span demands memorization, reorganization, and articulation of the numbers. Therefore this task may exercise association cortex as well as frontal cortex, which have important roles in working memory.37 The tests of praxis in limb use likewise did not show any differences between the two groups. There are several possible reasons. This kind of praxis is relatively simple and mainly dependent on spatial cognition, analogously to posture, spatial orientation, and skilled movement.3839 An alternative explanation would be that acquisition of motor skills is not highly associated with language function, with the result that literacy does not affect it.4041 The recognition part of the verbal learning test did not show significant differences between the two groups. However, the raw test scores showed better performance in the literate group and we suspect that the small number of recruits caused the insignificant result. Tests of word generation for a specified letter and category showed interesting results. For word generation for specified letters, there was significantly lower performance in the illiterate group, which was expected because of the group's lack of lexical experience. This result may also reflect difficulty with sustained output, concentration, and retrieval.42 In contrast, the word generation test for certain specified categories, namely animal and supermarket items, showed no difference between the two groups. Most studies with AD patients show that category fluency is more severely affected by the disease than letter fluency.434445 Only one study has shown results similar to ours,46 whereas another has shown a relatively high rate of AD patients with severe letter fluency impairment.47 The result of our study may be explained by the fact that the items of these categorical tests were less related to literal stimulation, and by the fact that our illiterate group was especially devoid of literacy, being unable to read or write their own names.
Recent developments in functional brain imaging have revealed two posterior brain systems, the parietotemporal and the occipitotemporal, with lesions of the former system being associated with reading problems.48 A functional MRI study of developmental dyslexia showed that the left parietotemporal cortex is where reading difficulty is localized.49 The left angular gyrus in particular is known to be an important cortical locus of reading.50 Other areas associated with reading ability in the brain include middle temporal gyrus, superior temporal gyrus, inferior frontal gyrus, and middle frontal gyrus.51 The left angular gyrus has also been mentioned as a cortical locus of writing.50 The other areas associated with writing are left superior parietal lobe,52 left posterior inferior temporal cortex,53 bilateral ventral occipitotemporal cortex,54 and thalamus.52 These studies indicate that the parietal lobe is the most important lobe for reading and writing.
We hypothesized that cerebral cortical volume in the illiterate group would be decreased in accordance with the group's low scores on neuropsychological tests, at least in areas associated with reading and writing. Furthermore, since the illiterate individuals in our sample had never received formal education, we also hypothesized that areas of association cortices mediating cognition would show reduced cortical thickness. The distribution of relative reductions in cortical volume was quite comparable to our expectations, with illiterate subjects showing reduced cortical volume and reduced cortical surface area mainly in the parietal lobe. The parietal lobe contains large association areas such as the angular gyrus and supramarginal gyrus. It also is close to Wernicke's area and the primary visual cortex, and performs various roles in interpreting verbal and visual language stimuli. In previous studies, lesions of the left inferior parietal lobule were shown to result in the development of dysgraphia, dyscalculia, right-left disorientation, and finger agnosia, deficits known collectively as Gerstmann syndrome.55 Presently, both parietal lobes showed decreased volume and surface area in the illiterate group. This may indicate that the right parietal lobe also has important roles in literacy and life, functioning as a higher perceptual area for lexical information flowing out of the occipital lobe.
The frontal lobe, the main area of difference between illiterate and literate groups in our previous study with fluorodeoxyglucose PET,14 did not show any volume differences in this study. We do not know the exact answer to this discrepancy. Possible explanations are as follows. Frontal cortex and insular areas are prominent in showing rapid age-related volume loss.56 Therefore, the expected illiteracy effect on frontal cortical volume could have been attenuated by normal aging effects. The small number of subjects also can be the reason of statistical insignificance.
Interestingly, the left cuneus showed a greater cortical thickness in the illiterate compared to the literate group. This is somewhat consistent with the increased glucose metabolism in the left precuneus found in the illiterate group in a previous study.14 Cuneus and precuneus are higher visual areas57 and are associated with velocity processing and estimation of time.58 The increased metabolism and cortical thickness of these areas could be an adaptive response compensating illiteracy. However, the exact reason for this result is not clear from this study and needs further investigation.
This study has limitations. The number of each group is small and there is discrepancy of lesions found between this study and previous study using fluorodeoxyglucose PET.
Our volumetric MRI results are consistent with the results of neuropsychological tests and have identified the posterior part of the cerebrum as a language-associated area.50515253 We assumed that most cerebral cortical areas would show relatively decreased volume and surface area in illiterate subjects because of the weaker neuropsychological performances in this group; in fact, our results revealed decreased volume and surface area only in the parietal lobe. However, in all the lobes of both hemispheres, the illiterate group showed smaller volumes than those of literate, although these effects were not significant. The small number of participants could be the reason for the partial consistency of the results. This study indicated that the neuropsychological performances of normal elderly illiterate individuals are weaker in most aspects than those of literate individuals. Furthermore, this study affirms that the parietal lobe plays an important role in reading and writing acquired during the first several years of life. Overall, literacy acquired in childhood may increase brain volume as well as increasing cognitive performance through the process of brain plasticity and have lifelong effects. The literacy-related differences found here may affect the activities of daily living of individuals and be determining for adoption of life styles that require relatively more cognitive resources.

 XML Download