

 PDF
PDF ePub
ePub Citation
 Print
Print


INTRODUCTION
With the increased utilization of computed tomography (CT), incidental detection of mediastinal masses has become more frequent, with reported prevalence of 0.4–0.9% (123). Anterior mediastinal or prevascular masses may represent various diseases, both benign and malignant (4). The differentiation between cysts and solid masses is important because surgery or tissue acquisition is required for solid masses, while treatment is not usually required for non-neoplastic cysts unless complications occur (5).
Contrast-enhanced CT is the standard modality for evaluating anterior mediastinal lesions (46). However, differentiating between cystic and solid masses on CT is sometimes not possible, because cysts can be of high attenuation and mimic solid lesions (7), and because of pseudo-enhancement (8), especially in small lesions (5). This limitation is partly responsible for the high non-therapeutic thymectomy rate, which has been reported to be 22–68% (5910).
The International Thymic Malignancy Interest Group suggested a structured approach for anterior mediastinal lesions. The higher soft tissue contrast and tissue characterization properties of magnetic resonance imaging (MRI) make it a prime modality for distinguishing cystic from solid lesions (11). Indeed, MRI has been reported to be useful for characterizing anterior mediastinal masses (12131415). Nevertheless, previous studies have evaluated the magnetic resonance (MR) features of cysts in a qualitative manner. A qualitative evaluation alone may be open to misinterpretation due to observer inexperience and cardiovascular motion; quantitative measurement of MRI parameters may help overcome such limitations. Therefore, the purpose of our study was to develop quantitative MRI criteria differentiation of cystic from solid masses in the anterior mediastinum.
Go to : 
MATERIALS AND METHODS
This study was approved by the Institutional Review Boards of all participating institutions and informed consent was waived.
Development Dataset
To develop differentiation criteria, we collected data from two institutions (Seoul National University Hospital [institution A] and Seoul National University Bundang Hospital [institution B]) with the following criteria: 1) MRIs for the evaluation of an anterior mediastinal lesion taken between June 2008 and January 2018; 2) surgical resection of the lesion; and 3) available pathologic diagnosis. Finally, 18 patients were included in the development dataset (15 from institution A, 3 from institution B; 10 males, 8 females; mean age, 52.2 years).
Image Acquisition
MRIs from institution A were obtained with a 3T scanner (MAGNETOM Skyra, Siemens Healthineers, Erlangen, Germany) using a standardized protocol (Table 1).
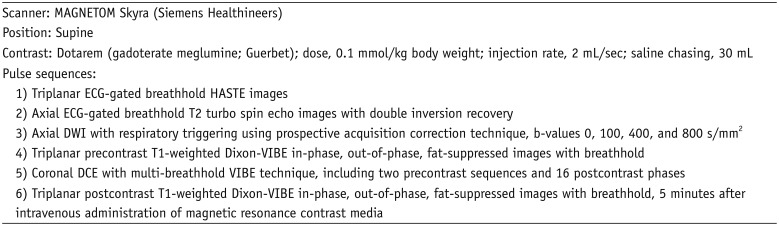
Table 1
Standardized MRI Protocol in Institution A
![]()
MRIs from institution B were obtained with 3T and 1.5T scanners (MAGNETOM Skyra; Discovery MR750, GE Healthcare, Milwaukee, WI, USA; and Achieva, Philips Healthcare, Best, the Netherlands) using various protocols. The protocols included at least the following sequences: 1) axial T2-weighted images without fat-suppression, 2) axial T1-weighted images without fat-suppression, 3) precontrast and postcontrast axial T1-weighted images with fat-suppression, and 4) diffusion-weighted images (DWIs) with corresponding apparent diffusion coefficient (ADC) maps.
Image Analyses
The following image variables were obtained and analyzed:
Size: One-dimensional measurements of the lesion were performed on precontrast T1-weighted images in three orthogonal planes. The largest value was recorded as the size of the lesion.
Normalized T1 and T2 signal intensity (nT1 and nT2): To assess T1 and T2 signal intensities (SIs) of the lesion, SIs of lesions were measured on representative images with regions of interest (ROIs) covering the entire lesion. Sagittal T1-weighted in-phase images and sagittal T2-weighted half-Fourier-acquired single-shot turbo spin echo (HASTE) images were preferentially used for evaluation of T1 and T2 SIs, respectively. The nT1 and nT2 values were defined as fraction values; SI of the lesion divided by SI of cerebrospinal fluid (CSF). For measurement of the SI of CSF, the image with the grossly largest CSF space without flow artifacts in the same sequence and was selected. SIs were measured with ROIs covering as large a CSF space as possible.
Normalized ADC (nADC): A parametric ADC map was obtained from DWIs. The ADCs of lesions were measured on representative images with ROIs covering the entire lesion. Afterwards, nADCs were obtained as a fraction value, ADC of the lesion divided by that of CSF. Images with severe motion artifacts precluding adequate discrimination of the lesion on the ADC map were excluded from the analyses.
Relative enhancement ratio (RER): For the quantitative analysis of contrast enhancement, we measured the RER of the lesion. A work-in-progress software (MRI Arithmetics, Siemens Healthineers) was used for non-rigid registration between axial precontrast and postcontrast T1-weighted fat-suppression images and acquisition of parametric maps of pixel-wise RER values. The equation for the RER is as follows:

in which SIPre and SIPost indicate SI on precontrast and postcontrast images, respectively. Finally, the RER was measured on the parametric map with ROIs covering the entire lesion.
Validation Dataset
Two validation datasets were collected. Validation dataset 1 included MRIs of 15 patients (8 males and 7 females; mean age, 55.1 years) from another institution (Samsung Medical Center; institution C), with the following criteria: 1) MRIs for the evaluation of an anterior mediastinal lesion taken between March and November 2017; and 2) available pathologic diagnosis. The images were obtained from one of three scanners (MAGNETOM Skyra; Achieva; and MAGNETOM Avanto, Siemens Healthineers). All data included the following sequences: 1) axial T2-weighted HASTE images; 2) axial T1-weighted images without fat-suppression; 3) axial precontrast and postcontrast T1-weighted images with fat-suppression; and 4) DWIs with corresponding ADC maps.
Validation dataset 2 included 11 patients from institution A (4 males and 7 females; mean age, 54.3 years) with clinically diagnosed cysts with the following criteria: 1) MRIs for the evaluation of an anterior mediastinal mass obtained between December 2014 and December 2015; 2) MRI features of a benign cyst (i.e., lack of internal enhancement, mural nodule, wall thickening, or septation) upon qualitative evaluation by an experienced thoracic radiologist (13 years of experience in interpreting thoracic MRI); and 3) no growth for > 2 years in follow-up imaging. The acquisition protocol was the same as used for the data in the development dataset from institution A.
Observer Tests
To evaluate whether our criteria can improve the performance of radiologists' qualitative assessment, we conducted observer tests. Two thoracic radiologists (observer 1 and observer 2, 5 and 2 years of experience after residency, respectively) participated in the tests. In the first session, observers qualitatively evaluated all available images from all pathologically confirmed cases and were asked to determine whether the lesion was a cyst or a solid mass. In the second session, observers re-evaluated images after a 2 month washout period, referring to the developed differentiation criteria and results of quantitative measurements.
Statistical Analyses
We used SPSS version 23.0 (IBM Corp., Armonk, NY, USA) for statistical analyses. Variables were compared using the Mann-Whitney U test. To identify the differentiation threshold, receiver operating characteristic (ROC) analyses were performed. Correlations between variables were evaluated with Spearman rank correlation analyses. Sensitivities and specificities were calculated regarding cyst as a positive diagnosis. Inter-observer agreements were evaluated with Cohen's kappa coefficient. P values < 0.05 were considered to indicate statistical significance.
Go to :
RESULTS
Comparison between Cysts and Solid Masses in Development Dataset
Among the development dataset, 6 were cysts, while 12 were solid masses. The pathologic diagnosis of cysts included thymic cysts (n = 3), a pericardial cyst, a bronchogenic cyst, and a non-specific cyst (n = 1, respectively). Chronic inflammation accompanied two thymic cysts, while none of the cysts showed internal hemorrhage. For solid masses, pathologic diagnoses were thymomas (n = 5), thymic carcinomas (n = 3), thymic neuroendocrine tumors (n=2), cavernous hemangioma, and Rosai-Dorfman disease (n = 1, respectively).
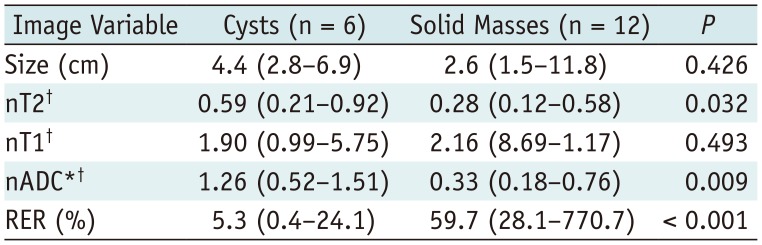
Cysts had significantly higher nT2 (0.59 vs. 0.28; p = 0.032) and nADC (1.26 vs. 0.33; p = 0.009), and lower RER (5.3% vs. 59.7%; p < 0.001) than solid masses (Table 2, Figs. 1, 2, 3).
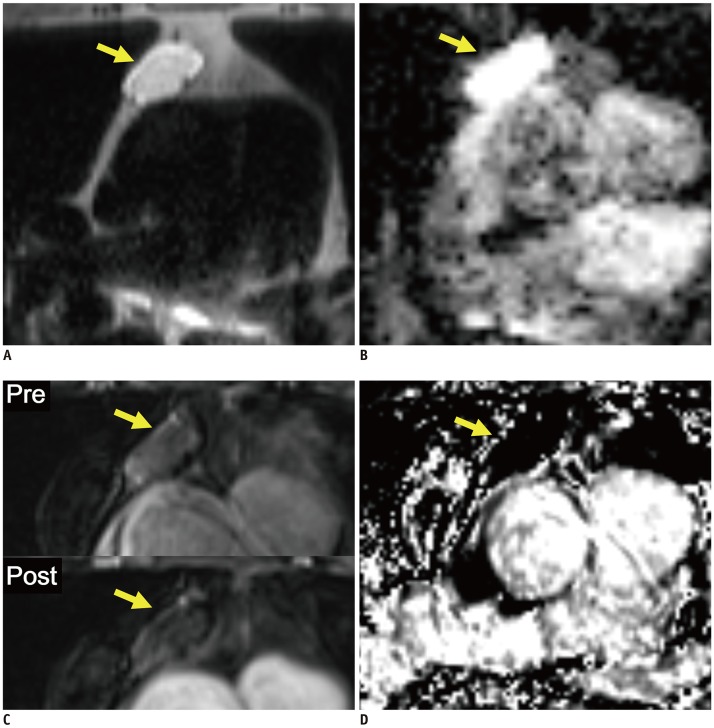 | Fig. 1Representative case from development dataset (cyst).Axial T2-weighted HASTE image (A), ADC map (B), pre- and post-contrast fat-suppressed T1-weighted images (C), and RER map (D) from 70-year-old male patient revealed 3.1 cm mass in anterior mediastinum (arrows). nT2, nADC, and RER values were 0.92, 1.50, and 5.3%, respectively. Pathologic diagnosis after surgical resection was thymic cyst. ADC = apparent diffusion coefficient, HASTE = half-Fourier-acquired single-shot turbo spin echo, nADC = normalized ADC, nT2 = normalized T2 signal intensity, RER = relative enhancement ratio
|
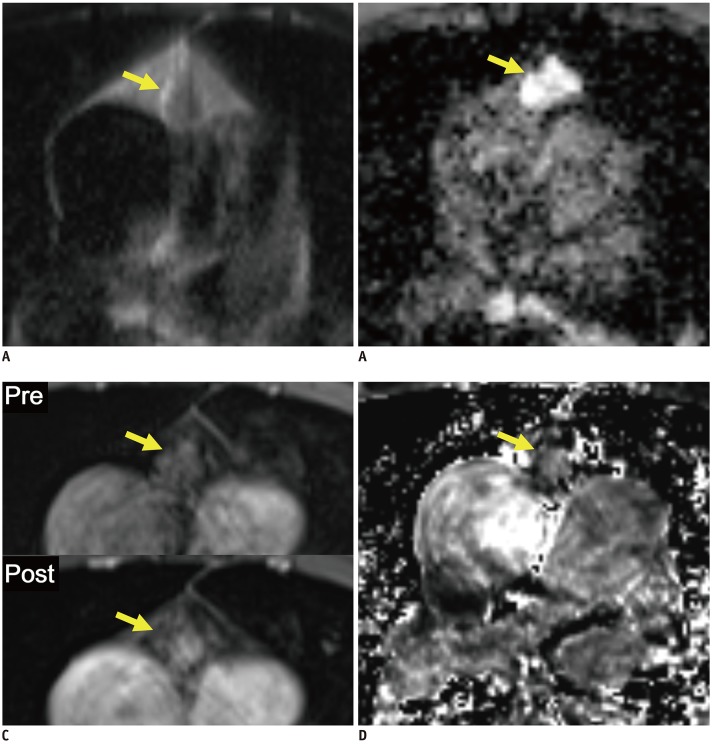 | Fig. 2Representative case from development dataset (solid mass).Axial T2-weighted HASTE image (A), ADC map (B), pre- and post-contrast fat-suppressed T1-weighted images (C), and RER map (D) from 65-year-old male patient revealed 1.6 cm mass in anterior mediastinum (arrows). nT2, nADC, and RER values were 0.32, 0.76, and 59.6%, respectively. Pathologic diagnosis after surgical resection was thymoma, type B2.
|
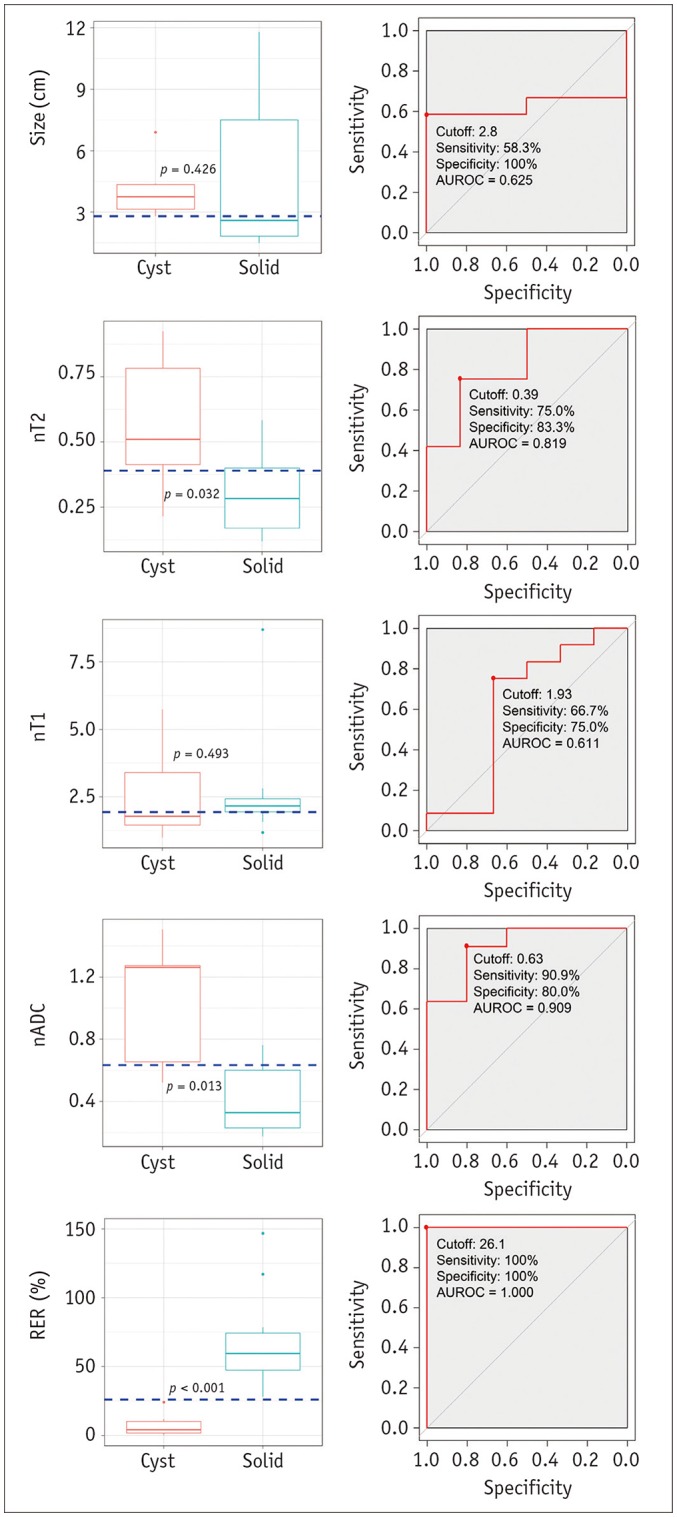 | Fig. 3Boxplots and ROC curves for differentiation between cysts and solid masses in development dataset.Boxplots in left column show results of comparison of image variables between cysts and solid masses. nT2, nADC, and RER differed significantly between cysts and solid masses. Horizontal dashed lines indicate cutoff values developed in ROC analyses. ROC curves in right column show results of ROC analyses for differentiation between cysts and solid masses. Although nT2, and nADC appeared to be significant variables, RER showed perfect separation between cysts and solid masses. nT2, nT1, and nADC are fraction values without units. AUROC = area under receiver operating characteristic curve, ROC = receiver operating characteristic
|
Table 2
Comparison of Image Variables between Cysts and Solid Masses in Development Dataset
All data indicate median values with ranges in parentheses. *Missed in two cases (one cyst and one solid mass), †Fraction values without units. nADC = normalized apparent diffusion coefficient, nT1 = normalized T1 signal intensity, nT2 = normalized T2 signal intensity, RER = relative enhancement ratio
![]()
Development of Differentiation Criteria
Table 3 and Figure 3 show the results of the ROC analyses. nT2, nADC, and RER were significant variables for differentiation. Three criteria for differentiating cysts from solid masses were developed: 1) nT2 > 0.39; 2) nADC > 0.63; and 3) RER < 26.1%.
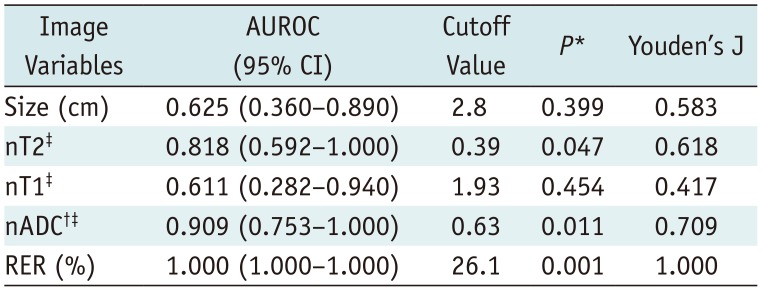
Table 3
Results of ROC Analyses to Define Differentiation Criteria between Cysts and Solid Masses in Development Dataset
![]()
Validation of the Differentiation Criteria
Among validation dataset 1, 8 were cysts and 7 were solid masses. Table 4 shows the results of the comparison between cysts and solid masses in validation dataset 1. The RER, ADC, and nT2 criteria showed sensitivities of 87.5%, 100%, and 75.0%, and specificities of 100%, 40.0%, and 57.4%, respectively (Table 5).
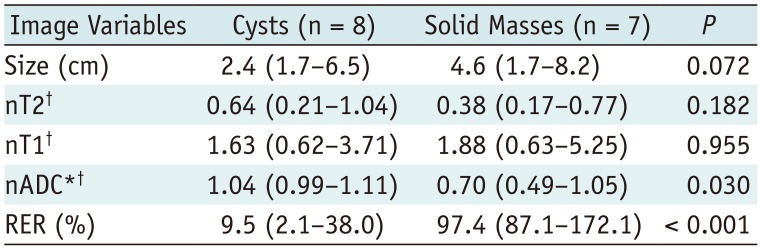
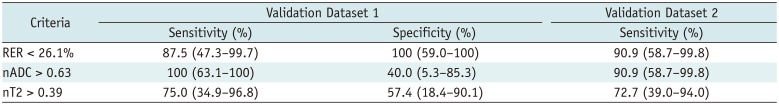
Table 4
Comparison of Image Variables between Cysts and Solid Masses in Validation Dataset 1
![]()
Table 5
Performances of Differentiation Criteria in Validation Datasets
![]()
In validation dataset 2, the median follow-up duration was 34 months (range, 25–54 months). Applying the developed criteria, sensitivities of the RER, ADC, and nT2 criteria were 90.9%, 90.9%, and 72.7%, respectively (Table 5).
In correlation analyses between image variables, there was a negative correlation between RER and nT2, with marginal statistical significance (ρ = −0.490; p = 0.075).
Observer Tests
Results of observer tests are summarized in Table 6. Both sensitivities and specificities were improved in the second session, in both observers. Inter-observer agreement was also improved when referring to our differentiation criteria.
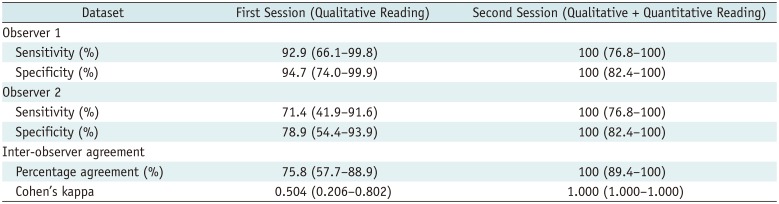
Table 6
Results of Observer Test
![]()
Go to :
DISCUSSION
We quantitatively compared normalized MRI parameters of pathologically confirmed cysts and solid masses in the anterior mediastinum, developed criteria for differentiating between cysts and solid masses, and validated MRI parameter performance on separate datasets.
Bright T2 SIs with high ADCs are of paramount value for diagnosing typical cysts (7121617). In a recent study (18), an ADC cutoff value of 2.5 × ·10−3 mm2/sec showed perfect differentiation between cysts and solid masses in the mediastinum. In our study, although nT2 and nADC differed significantly between cysts and solid masses, substantial overlap was observed, and nADC- and nT2-based criteria showed unsatisfactory performance in the validation datasets. This result can be explained by internal hemorrhage or inflammation of cysts, which may alter both the cystic contents and MRI features.
Lack of enhancement is a salient feature for differentiating cysts from solid masses. However, sometimes it is challenging to determine the presence of enhancement, especially in small lesions. In CT images, subtle increased attenuation of cysts after contrast administration or ‘pseudo-enhancement’ has been well described (1920). However, in MRI, the degree of enhancement suitable for differentiating cysts from solid masses has rarely been investigated. In our study, we quantitatively evaluated the degree of enhancement in cysts and solid masses after accurate registration of precontrast and postcontrast images. As expected, most cysts showed an RER < 25%, without overlap with RER in solid masses. A cutoff RER of 26.1% showed excellent performance.
Half (7/14) of pathologically confirmed cysts in our study showed an RER > 10%. This so-called ‘MR-pseudo-enhancement’ might be an important pitfall in differentiation between cysts and solid masses. Motion artifacts, inherent noise, or partial volume averaging with adjacent enhancing structures may have contributed to the MR-pseudo-enhancement (21). In addition, we found a negative correlation between RER and nT2, with marginal significance in pathologically confirmed cysts. In other words, cysts with pseudo-enhancement may show low T2 SI, suggesting that non-water contents due to hemorrhage or inflammation may contribute to pseudo-enhancement.
In our observer tests, misinterpretation of cysts and solid masses occurred in 6–24% of cases, and inter-observer disagreements were noted in 24.2% of subjective evaluations by radiologists. Impressively, both observers perfectly differentiated cysts and solid masses with the assistance of our differentiation criteria. Although the test was performed in a small population, we believe our quantitative criteria can improve both radiologists' performance and inter-observer agreement.
One aspect worth mentioning is that thymoma may undergo cystic degeneration and show a predominantly cystic appearance (22). There was no cystic thymoma in our population, and our criteria may not work in cystic thymomas. If cystic lesions have an irregular enhancing wall, septation, or mural nodule, the possibility of cystic thymoma should be considered, regardless of quantitative measurement results.
In addition to the intrinsic shortcomings of a retrospective study, our study has several limitations. First, a limited number of pathologically confirmed cases were available. Because patients with definitive cysts on MRI rarely undergo surgery, it was difficult to obtain sufficient pathologically confirmed cases, especially for cysts. Second, as the criteria in our study were developed with data from a small number of scanners with various protocols, it was uncertain whether these criteria would work in data from different scanners or protocols. Although we tried to overcome this limitation by normalizing MRI parameters by those of CSF and validating the criteria in independent datasets, further validation with a larger population is required. Finally, for the validation dataset 2, the reference standard was dependent on MRI findings and follow-up imaging, rather than pathologic diagnosis. However, these cases showed MRI features of definitive cysts, in which malignant transformation has been not reported and follow up is not recommended (23).
In conclusion, thoracic MRI with an RER cutoff value of 26.1% can appropriately differentiate cysts from solid masses of anterior mediastinum, and this criterion can be used to supplement the qualitative assessment.
Go to :
 XML Download