

 PDF
PDF ePub
ePub Citation
 Print
Print


INTRODUCTION
Iodinated contrast-induced acute kidney injury (CI-AKI) has been identified as a specific form of acute renal function damage associated with the use of an iodinated contrast agent (CA) (12). In clinical practice, CI-AKI is a major health concern, especially for diabetic patients who are more prone to CI-AKI when compared to healthy individuals (3456). As previously reported, the rate of CI-AKI occurrence in diabetic patients could be as high as 29.4%, even in the absence of preexisting renal insufficiency (7). However, the underlying mechanism that places diabetic patients at a higher risk of CI-AKI needs to be investigated.
Due to the rapid development of the functional magnetic resonance imaging (fMRI) methodology, it may be possible to acquire valuable information on the pathophysiology of CI-AKI when it follows the onset of diabetes in a patient (8). Preclinical studies have demonstrated that blood oxygenation level-dependent (BOLD) imaging could serve as a reliable noninvasive method to measure the renal oxygen content in both humans and animals (91011). In addition, intravoxel incoherent motion (IVIM) imaging could detect the diffusion of water molecules and perfusion-dependent diffusion in vivo (12131415). Previous studies have reported that a decrease in pure molecular diffusion coefficient (D), pseudo-diffusion coefficient (D*), and perfusion fraction (f) values was detected when IVIM imaging was conducted on CI-AKI rat models while an increase in apparent transverse relaxation rate (R2*) values was detected when BOLD imaging was conducted on contrast-induced rat models (1216).
Although the occurrence of medullary hypoxia in the kidney has been reported previously (17), the association between renal hypoxia and renal failure has not been systematically evaluated. Recent reports have demonstrated that the expression of hypoxia-inducible transcription factor-1α (HIF-1α) is correlated with hypoxia in CI-AKI (1718), and thus may lead to an increase in the R2* value (16). In addition, accumulating evidence has shown that the overexpression of HIF-1α increases angiogenesis by inducing vascular endothelial growth factor (VEGF) expression (1920). It is noteworthy to mention that hypoxia is the main stimulus for HIF-1α and VEGF expression and production (21).
The objective of this study was to determine whether IVIM and BOLD imaging could noninvasively identify changes in renal water diffusion, perfusion, and oxygenation during acute renal damage in diabetic rabbits after the administration of a CA. The IVIM and BOLD images were compared to detect changes in the histology and the expression of HIF-1α and VEGF at different time points after the administration of the CA.
MATERIALS AND METHODS
Establishment of the Diabetic Rabbit Model
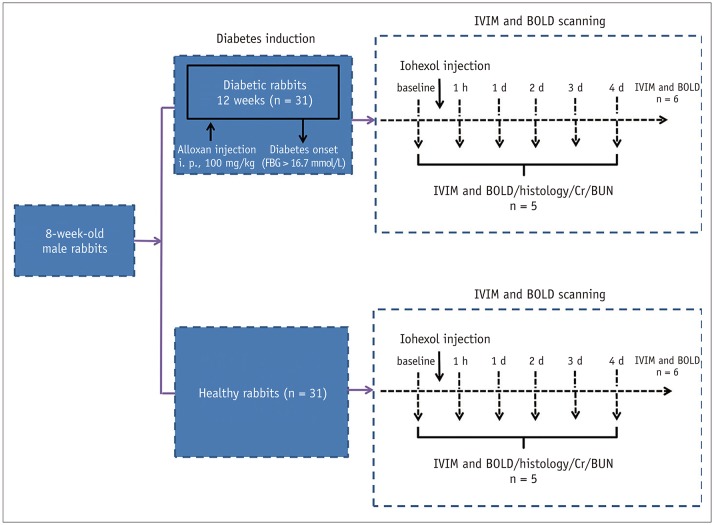
This study was approved by China Medical University and was performed in accordance with the guidelines of the institutional animal care and use committee. A total of 62 8-week-old male New Zealand white rabbits (body weight, 2.5–3.0 kg) were used. The diabetic rabbit model was established by administering a single intravenous injection of 100 mg/kg body weight of alloxan freshly dissolved in 0.9% saline after a 12-hour overnight fasting period (22). The rabbits that became diabetic (fasting blood glucose levels > 16.7 mmol/L) were used in the study 12 weeks after the administration of alloxan (2223).
Experimental Setup
Before the magnetic resonance imaging (MRI), the rabbits were anesthetized with 3% pentobarbital sodium (0.5 mL/kg of body mass). Following this, iohexol 350 (350 mgI/mL, 830 mOsm/kg H2O; Omnipaque, GE Healthcare, Shanghai, China) that was preheated at 37℃ was intravenously injected at a dose of 2.5 g I/kg body weight (2425).
Firstly, since the intra-group comparisons of the baseline values showed significant differences, 6 out of the 31 diabetic rabbits were imaged longitudinally before and 1 hour, 1 day, 2 days, 3 days, and 4 days after iohexol administration to investigate renal changes during CI-AKI. Then, 5 randomly selected diabetic rabbits were euthanized at the end of the study (4 days). Secondly, to validate the fMRI findings, 5 diabetic rabbits were randomly selected from the remaining rabbits for blood measurements and histological studies after MRI scanning at the 5 time points (baseline, 1 hour, 1 day, 2 days, 3 days). Meanwhile, 6 out of the 31 healthy rabbits underwent IVIM and BOLD examinations at the baseline (pre-contrast), and at 1 hour, 1 day, 2 days, 3 days, and 4 days after the iohexol administration, and 5 randomly selected rabbits were euthanized at the end of the study (4 days). The remaining animals were randomly sacrificed for further analysis after MRI scanning at the baseline, and at 1 hour, 1 day, 2 days, and 3 days (n = 5 each) (Fig. 1).
Experimental Procedure
All MRI scans were performed using a clinical 3T Twin Speed MR scanner (GE Healthcare, Milwaukee, WI, USA) with a cardiac matrix coil. The details of the sequences obtained with the optimized MRI parameters are shown in Supplementary Table 1 (in the online-only Data Supplement). The functional feature of the advanced workstation software (GE Healthcare) was used for image analysis. The quantitative regional IVIM parameters and R2* values were calculated using manually defined regions of interest (ROIs) for each of the anatomic layers (the cortex [CO] and the outer medulla [OM]) (26). A circular ROI was placed in the renal CO (30–35 mm2) and OM (35–40 mm2) regions (Supplementary Fig. 1 in the online-only Data Supplement). The ROIs drawn over the inner medulla were not analyzed due to the presence of the renal pelvis and calyx.
Apparent transverse relaxation rate (R2* = 1/T2*) is a measure of the deoxygenated hemoglobin content in the tissue, which in turn reflects the partial pressure of hypoxia in the tissue (27). The diffusion-weighted signal intensity depends on a cylindrical two-compartment model in the voxel (Equation 1) (28). D is the molecular diffusion coefficient of pure tissue. D* is the pseudo-diffusion coefficient, and f is the perfusion fraction of the voxel. where S0 is the signal intensity in the absence of diffusion weighting (b = 0), and Sb is the signal intensity with the diffusion gradient b.
Blood samples (1.5–2.0 mL) were obtained from the marginal ear vein and were immediately centrifuged at 3200 rpm (4℃) for 15 minutes. After the MRI, the right kidneys were removed, cut into small pieces, and subsequently fixed in 4% buffered paraformaldehyde. The inner medulla was excluded from the analysis. The pieces were then cut into 5-µm slices and stained with hematoxylin and eosin (H&E) and with Masson's trichrome. Cortical alterations were graded as follows: normal kidney, 0; minimal injury (0–25%), 1; moderate injury (25–50%), 2; intermediate injury (50–75%), 3; and severe injury (75–100%), 4 (29). The severity of tubular injury was graded based on the levels of tubular necrosis and the proteinaceous casts observed: 0, no damage; 1, mild; 2, moderate (< 25%); 3, severe (25–50%); and 4, very severe (> 50%) (30).
The details outlining the immunostaining methods have been previously described (31), and the antibodies used are listed in Supplementary Table 2 (in the online-only Data Supplement). The areas displaying HIF-1α+ nuclei and VEGF+ podocyte expression were quantified using ImageJ software (https://imagej.nih.-gov/ij/download.html).
Statistical Analysis
Statistical analysis was performed using SPSS software (SPSS 21; IBM Corp., Armonk, NY, USA). A p value < 0.05 was considered statistically significant. The IVIM parameters and R2* values were statistically compared with the baseline values using repeated-measures analysis of variance (ANOVA), and the Bonferroni post hoc test was used for further comparisons. The semi-quantitative pathological damage was statistically analyzed using a one-way ANOVA. The Kruskal-Wallis test was used to analyze the non-continuous parameters. The Spearman correlation coefficient was used to assess the relationships of the IVIM parameters and R2* values with the histological scores of right kidneys of all the animals at the various time points.
RESULTS
General Characteristics of the two Treatment Groups
In general, the animals did not show any signs of discomfort after the CA administration. As shown in Supplementary Table 3 (in the online-only Data Supplement), the fasting blood glucose levels of all the diabetic rabbits were significantly higher than those of the healthy rabbits. The mean body and kidney weight and the kidney/body weight ratio were significantly different between the two groups (all p < 0.05).
As shown in Supplementary Table 4 (in the online-only Data Supplement), the serum creatinine (Cr) and blood urea nitrogen (BUN) concentrations reached their maximum values on day 3 in the diabetic rabbits with the contrast agent (DCA) group (p < 0.05), whereas they were slightly increased without statistical differences after the iohexol administration in the healthy rabbits with the contrast agent (NCA) group.
Intra-Renal Diffusion and Hemodynamics Measured by IVIM
Figure 2 shows the time course of the IVIM parameters measured in the two groups. A comparison of the temporal changes in the IVIM results between the two groups is shown in Figure 3. The data of the two contrast groups are shown in Table 1.
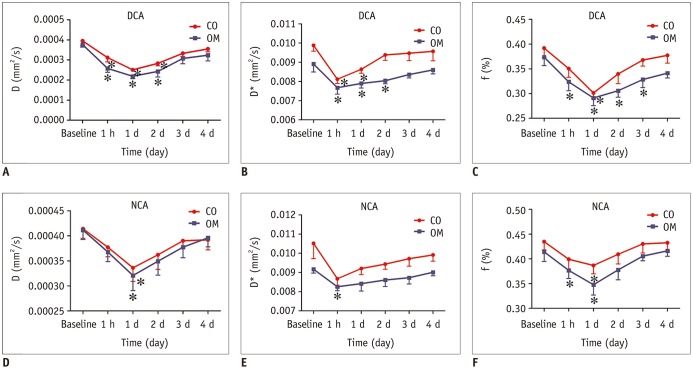
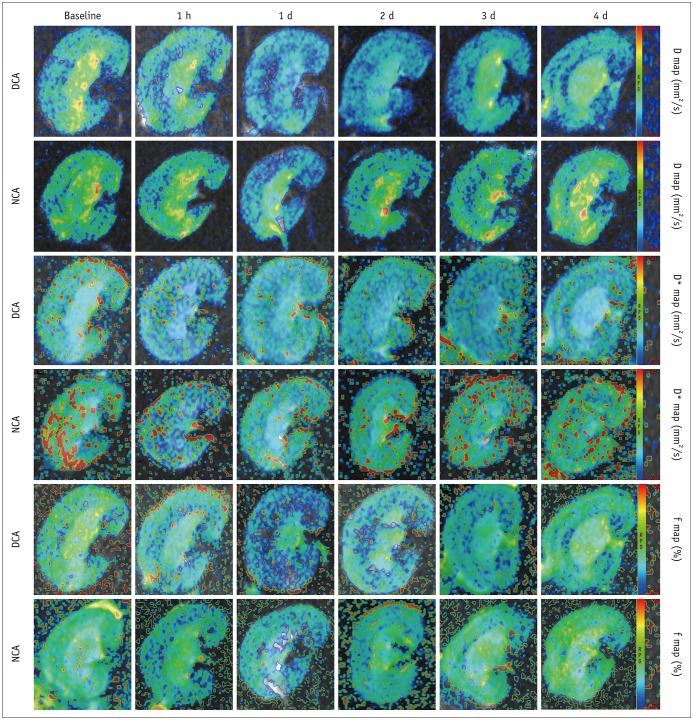
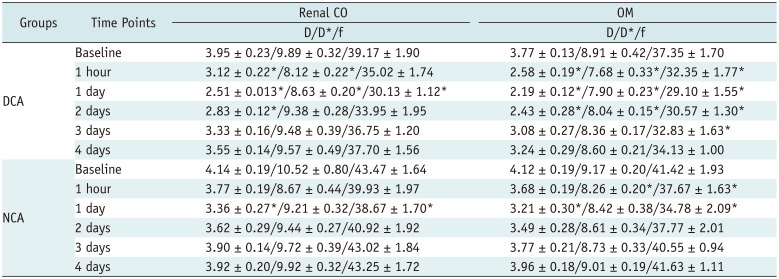
Fig. 2
Temporal changes in IVIM measurements in two groups.
(A–C) DCA group, (D–F) NCA group. Serially measured parameters (baseline, 1 hour, 1 day, 2 days, 3 days, and 4 days after CA injection) in 6 representative animals were recorded. Asterisk indicates p < 0.05 compared with baseline values. CA = contrast agent, CO = cortex, D = pure tissue molecular diffusion coefficient, D* = pseudo-diffusion coefficient, DCA = diabetic rabbits with contrast agent, f = perfusion fraction of voxel, NCA = healthy rabbits with contrast agent, OM = outer medulla
![]()
Fig. 3
Representative IVIM images of two groups at corresponding time points.
Maps were produced with same window and level settings. Maximum D and f signal changes appeared after day 1, whereas D* values appeared after 1 hour, followed by gradual recovery toward baseline values at subsequent time points.
![]()
Table 1
Mean Values of D (× 10−4 mm2/s), D* (× 10−3 mm2/s), and f (%) Recorded after Injection of Contrast Agent for Two Groups
![]()
In the DCA group, the D values were significantly decreased 1 hour, 1 day, and 2 days post-injection in the CO and OM of the kidneys compared to the baseline values (−21.1% with respect to baseline, p = 0.004 [CO, 1 hour]; −31.7% with respect to baseline, p < 0.001 [OM, 1 hour]; −36.4% with respect to baseline, p < 0.001 [CO, 1 day]; −41.9% with respect to baseline, p < 0.001 [OM, 1 day]; −28.4% with respect to baseline, p = 0.001 [CO, 2 days]; −35.5% with respect to baseline, p = 0.002 [OM, 2 days]), and they were still significantly lower compared to the baseline values afterwards (reduced by 10.1% [CO]; 14.1% [OM]). In the NCA group, iohexol caused a much shorter duration of having reduced D values compared to the baseline, lasting 1 day in the CO (−18.8% with respect to baseline, p = 0.015) and 1 day in the OM (−22.1% with respect to baseline, p = 0.043). After 2 days, the D values gradually returned close to the baseline levels.
With regard to perfusion measurements, a remarkable decline in the D* values in the OM was observed in the DCA group after 1 hour (−13.8% with respect to baseline, p = 0.009) and was only slightly alleviated after 2 days (−9.8% with respect to baseline, p = 0.044). In the CO, a prominent reduction in the D* values compared to the baseline values was observed after 1 hour to 1 day (−17.9% with respect to baseline at 1 hour, p = 0.001; −12.7% with respect to baseline at 1 day, p = 0.018), followed by a progressive increase starting from day 2. In the NCA group, iohexol only resulted in a progressive decrease in the D* values in the OM by approximately 8.2% of the baseline values at 1 hour after the injection time (p = 0.001).
With regard to the f values in the renal OM, deficiency in the CA-induced medullary perfusion level aggravated within 1 hour to 3 days when compared to the baseline levels (−13.4% with respect to baseline, p = 0.012 [1 hour]; −22.1% with respect to baseline, p = 0.007 [1 day]; −18.2% with respect to baseline, p = 0.008 [2 days]; and −12.1% with respect to baseline, p = 0.001 [3 days]) and remained at low levels until day 4. In the CO, the f values reached their maximum by day 1 (−23.1% with respect to baseline, p = 0.002), but they subsequently returned to baseline levels by day 2. In the NCA group, the f values were significantly lower compared to the baseline levels and were reduced by 11.0% in the CO (p = 0.046) and by 16.0% in the OM (p = 0.025) after day 1.
Intra-Renal Oxygenation by BOLD
Figure 4A, B illustrates representative R2* images for each time point in the 2 groups after the iohexol injection. Figure 4C, D summarizes the R2* time course in the 2 groups. Table 2 summarizes the R2* values after the contrast injection in the 2 groups.
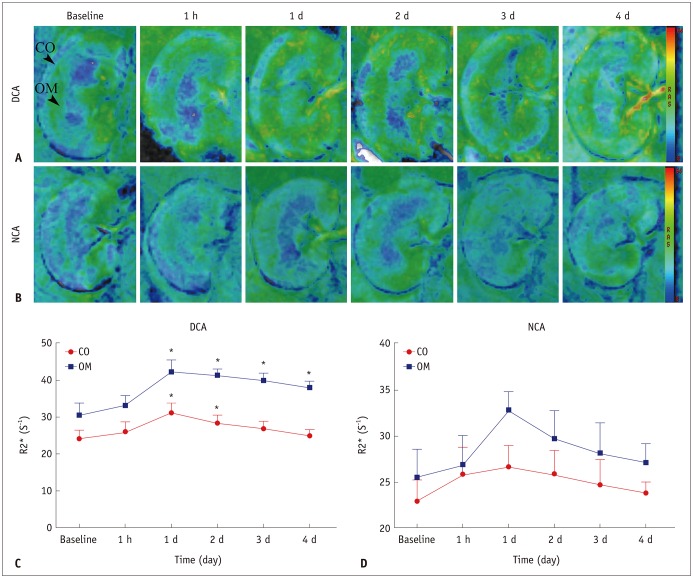
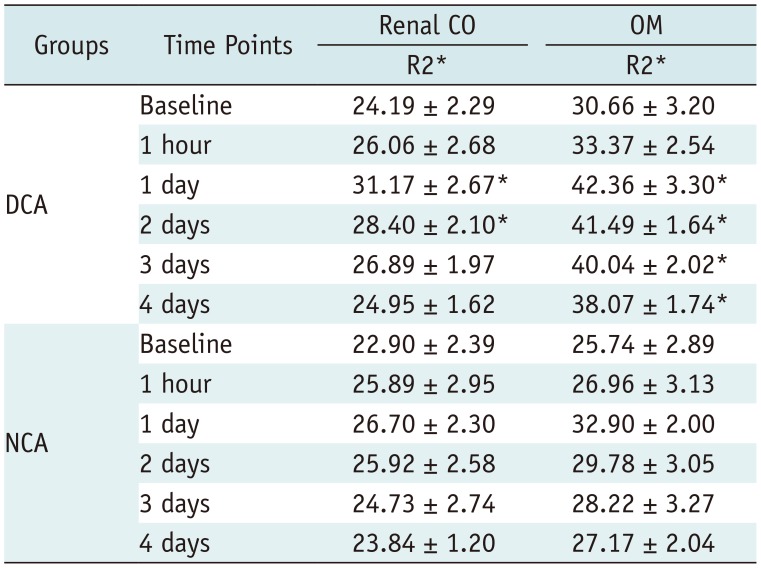
Fig. 4
R2* maps for two groups obtained at each time point.
A. R2* maps in DCA group until day 4. B. R2* maps in NCA group until day 4. C, D. Each data point was average of R2* measurements in 6 rabbits from same group at one scan time. For each group, sharp increase in R2* values was observed after day 1 in two anatomical layers; subsequently, R2* values returned to baseline over time. Asterisk indicates p < 0.05 compared with baseline values. R2* = apparent transverse relaxation rate
![]()
Table 2
Mean Values of R2* (s−1) Recorded after Injection of Contrast Agent for Two Groups
![]()
In the DCA cohort, the R2* values were significantly higher by 17.4–28.9% compared to baseline values at 1–2 days after the contrast injection in the renal CO (p = 0.01 and 0.029, respectively). In the renal OM, the R2* increased by 24.2% by the end of the study period (day 4, p = 0.021). In the NCA group, the mean R2* values in the OM were higher by 15.7–27.8% compared to baseline values on days 1 and 2 after the iohexol injection; however, no significant changes were observed in the 2 renal regions at any of the later time points.
Histological Analysis
The cortical and medullary regions of the kidneys of the two groups are shown in Figure 5. At 1 hour, the proximal and distal convoluted tubular epithelial cells were enlarged, and vacuolization was observed in the renal CO while proteinaceous casts were observed in the renal OM. In addition to vacuolization, small numbers of inflammatory cells, tubular collapse, and extensive nuclear necrosis were observed on day 1. On day 4, vacuolation and significantly increased extracellular matrix deposition were observed in both the glomerulus and tubule regions (Fig. 6).
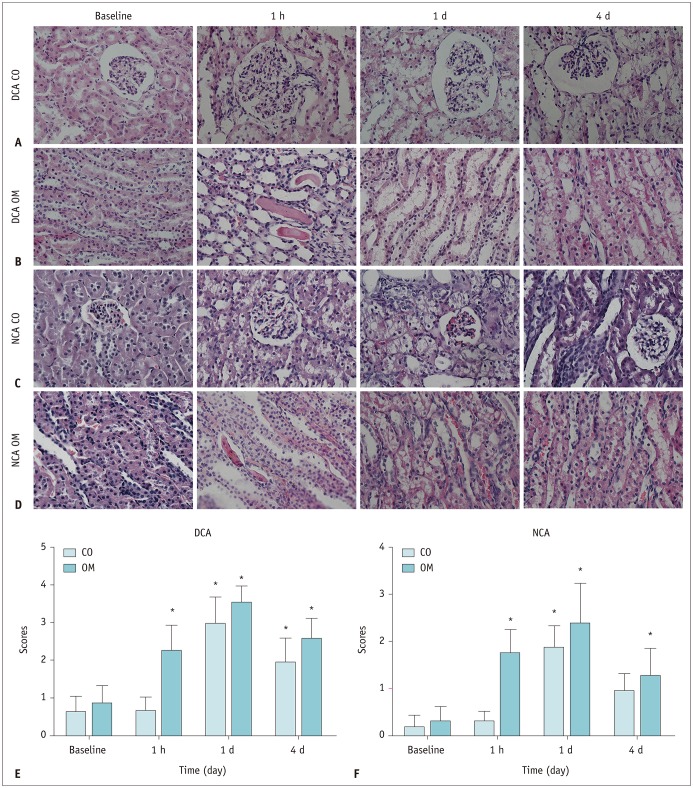

Fig. 5
Representative micrographs of hematoxylin and eosin staining of kidney in two groups.
(A, B) DCA group, (C, D) NCA group (original magnification, × 400), (E, F) severity of histopathological injury. *p < 0.05 (compared with baseline values).
![]()
Fig. 6
Representative micrographs of kidney with Masson's trichrome staining.
(A, C) diabetic rabbits, (B, D) DCA post day 4, (E, G) healthy rabbits, and (F, H) NCA post day 4 (original magnification × 200). In DCA group, Masson's trichrome staining showed gradual increase in percentage of interstitial fibrosis, while in NCA group, small amount of interstitial fibrosis was observed after day 4.
![]()
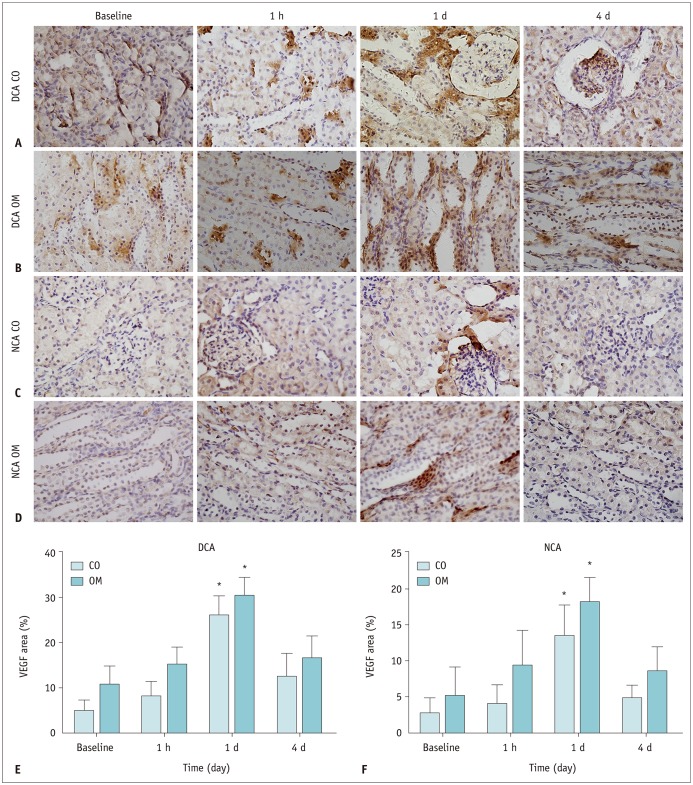
As shown in Figure 7, a marked nuclear accumulation of HIF-1α were detectable in the renal CO and OM after day 1. Following this, HIF-1α expression levels declined over time; however, they were still detectable after day 4 in the diabetic group. In contrast, HIF-1α staining denoting hypoxia was not detected in the healthy rabbits after day 1. As with HIF-1α, the VEGF staining was observed in regions of extreme tissue hypoxia. However, they were no longer detectable after day 4 in the DCA group and after day 2 in the NCA group (Fig. 8).

Fig. 7
Time course of HIF-1α expression after iohexol injection in each group.
(A, B) DCA group, (C, D) NCA group (original magnification × 400). (E, F) Nuclear staining score for HIF-1α in two groups. Expression of HIF-1α slightly increased after 1 hour in all anatomical layers and was significantly higher after day 1 compared to baseline in 2 groups. *p < 0.05 vs. baseline values. HIF-1α = hypoxia-inducible transcription factor-1α
![]()
Correlation between fMRI Parameters and Renal Injury and HIF-1α Expression Scores and Cr Levels
As shown in Figure 9A, C, and D, renal injury scores in the OM correlated well with the D values (r = −0.740, p < 0.001), f values (r = −0.754, p < 0.001), and R2* values (r = 0.759, p < 0.001). However, only a modest correlation was observed between the renal injury scores and the D* values (r = −0.406, p = 0.0013) (Fig. 9B). In addition, very good correlations were observed between the expression scores of HIF-1α and the D, D*, f, and R2* values (r = −0.857, p < 0.001; r = −0.716, p < 0.001; r = −0.781, p < 0.001; and r = 0.863, p < 0.001, respectively) (Fig. 9E–H). A modest correlation was observed between Cr levels and the D, D*, and f values (r = −0.609, p < 0.001; r = −0.519, p < 0.001; and r = −0.563, p < 0.001, respectively) (Fig. 9I–K), whereas the Cr correlated well with the R2* values (r = 0.752, p < 0.001) (Fig. 9L). The correlations of fMRI parameters with histological injury, HIF-1α expression, and Cr in the renal CO are presented in Supplementary Figure 2 (in the online-only Data Supplement).
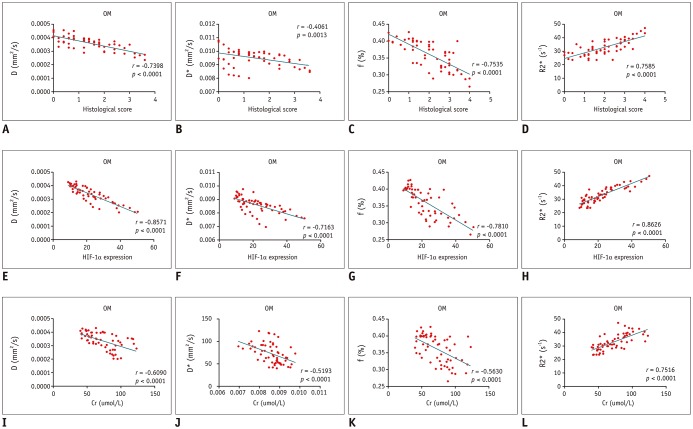
Fig. 9
Correlation between functional MRI parameters and pathological scores in OM.
Significant correlations of renal histological scores with D, f, and R2* values (A, C, and D) and fair correlations of renal histological scores with D* values (B). Significant correlations of renal HIF-1α scores with D, D*, f, and R2* values (E–H). Significant correlations of Cr with R2* values (L) and moderate correlations of Cr with D, D*, and f values (I–K).
![]()
DISCUSSION
The diabetic cohort displayed prolonged changes in the parameters measured in this study compared to the healthy cohort. The D and D* values in the diabetic cohort gradually decreased from 1 hour to 2 days from the baseline levels while the f values also gradually decreased during the first 3 days after the iohexol injection. It should be noted that an earlier significant decrease in the D* values was observed at 1 hour. The peak changes in the R2* were observed on day 1, and the R2* was correlated with HIF-1α and Cr measurements. However, pronounced changes in the IVIM parameters and R2* values in the NCA group were observed on day 1 after the iohexol injection. These findings support the feasibility of using IVIM and BOLD imaging to study CI-AKI in diabetic patients.
The decrease in the D values indicated that iohexol induced a progressive reduction in intrarenal diffusion in the diabetic rabbits. This result can be attributed to several conditions. First, this reduction may be associated with renal tissue edema and inflammatory cell infiltration, which could be detected by the results from H&E staining. Ries et al. (32) also found a reduction in the apparent diffusion coefficient in diabetic rabbits and in case of edematous cellular damage. In addition, a decrease in the D values is followed by a subsequent development of interstitial renal fibrosis and glomerular atrophy. Observing the area affected by fibrosis using Masson's staining supports this hypothesis. An association between decreased water diffusion and tissue fibrosis has already been shown in a rat model of liver fibrosis (33). Lastly, a CA disrupts the renal pathology by necrosis of the renal tubular epithelial cells, proteinaceous casts in renal tubules, and medullary congestion, which negatively correlates with the successive aggravation of diffusion deficiency (34).
Significant decreases in the D* and f values were observed in the diabetic rabbits, suggesting a reduction in blood flow. This may be due to vasculopathy in the pathogenesis of diabetic nephropathy (35). The elevated levels of VEGF also suggest impaired renal endothelial function, as has been reported in several previous studies (1936). After iohexol administration, the decreased medullary blood flow could aggravate and be prolonged. The early D* and f response to iohexol was primarily due to sustained vasoconstriction (within the first hour), which was demonstrated previously by Rauch et al. (37). The renal vascular dysfunction in diabetic rabbits may be caused by an increased sensitivity to renal vasoconstriction and ischemia due to the increased generation of reactive oxygen species (38) and a decrease in nitric oxide-dependent vasodilation (3). Similarly, complete renal ischemia in diabetic rats caused accelerated renal injury with lesions (39).
With respect to contrast-induced kidney damage, we found that the R2* was significantly higher in the diabetic rabbits compared to in the healthy rabbits, and these observations were correlated with HIF-1α levels. The CA administration aggravated physiological medullary hypoxia in an acute-on-diabetes renal failure compared to an acute-on-healthy renal failure (8). Chronic renal disease is a significant risk factor for acute renal dysfunction following renal hypoxia and toxicity (40). We hypothesized that OM microvascular depletion and hypoxia in diabetes predispose individuals to tubular hypoxic damage during acute insults. Furthermore, hyperfiltration, which is a characteristic of the early stages of diabetic nephropathy, likely results in increased sodium load to the tubules, resulting in enhanced oxygen consumption (41). We found that HIF-1α, a member of the ubiquitous master regulators of hypoxic adaptation family, accumulates in the hypoxic regions identified by VEGF expression.
In this study, a persistent elevation of R2* values was observed in the DCA group. The hypothesis is that exacerbated hypoxia occurs secondary to CI-AKI and predisposes the kidney to develop chronic renal disease (4243). CI-AKI does not seem like a secondary result, since exacerbated medullary hypoxia may trigger and aggravate the development of chronic disease (4244). Regarding renal safety, when a CA is administered to patients with a predilection to develop chronic renal failure, they should have follow-up fMRI monitoring while in hospital and 1–4 days after being discharged.
This study had a few limitations. Quantitative comparisons were performed using the mean values of manually drawn ROIs, which made the analysis prone to error. For the diabetic cohort, several of the fMRI parameters failed to recover to the baseline levels even after 4 days. Hence, additional studies should be performed for a longer period to measure these parameters.
In summary, when there is an increase in the expression of AKI markers, the impaired kidney is in a critical condition due to the onset of CI-AKI, leading to a lower renal tolerance to iohexol. Therefore, a combination of BOLD-fMRI and IVIM-fMRI can detect the structural and functional damage to the kidneys before the established clinical markers for kidney disease become apparent.
 XML Download