

 PDF
PDF ePub
ePub Citation
 Print
Print


INTRODUCTION
Osteosarcoma is the most common primary malignant bone tumor in childhood and adolescence. Since neoadjuvant chemotherapy was introduced in the 1970s, patients' long-term survival rates have dramatically improved (1). Combined surgery and chemotherapy leads to long-term, disease-free survival in approximately 60% of patients with a localized extremity lesion (2). To date, more than 90% of chemotherapy-induced tumor necrosis in osteosarcoma has been considered as the most reliable predictive indicator of survival (3). However, histological tumor necrosis can only be assessed postoperatively. In clinical practice, knowledge of tumor necrosis in vivo is very important to allow physicians to modify chemotherapy regimens during the course of chemotherapy and to allow surgeons to individualize surgical planning (limb-sparing or amputation); ineffective chemotherapy may potentially increase the risk of iatrogenic toxicity or formation of resistant clones (4). Patients' subjective responses and clinical examinations have proven less than satisfactory (5). Therefore, it would be desirable to have an imaging surrogate to monitor response to neoadjuvant chemotherapy prior to surgical resection.
To overcome these limitations, several modalities, including radiography, computed tomography (CT), and conventional magnetic resonance imaging (MRI), have been used to monitor tumor chemotherapy response. However, these anatomical imaging modalities are insufficient to monitor tumor necrosis due to the overlap of different morphological features resulting from chemotherapy, such as edema, granulation tissue, and fibrosis (6). Several recent studies have reported on the usefulness of dynamic MRI for the assessment of tumor necrosis after chemotherapy (57). However, the routine use of dynamic MRI has been limited by its time-consuming nature and heavy workload for post-processing.
Diffusion weighted imaging (DWI) is a non-invasive, functional MRI modality. Mounting evidence has shown that DWI could directly monitor tumor therapeutic response and that apparent diffusion coefficient (ADC) values were closely related to tumor necrosis (891011121314). However, this imaging modality assumes that water diffusion in tissue follows Gaussian diffusion behavior. In fact, water diffusion is heterogeneous because of the presence of various barriers and compartments in the tissue microstructure, especially in bone tumors. Diffusion kurtosis imaging (DKI) offers a method of evaluating diffusional heterogeneity and structural connectivity in complex biological tissues, which may potentially augment conventional diffusion techniques for better monitoring of response to treatment. In previous studies, DKI has been used to monitor treatment response in patients with locally advanced rectal cancer and advanced nasopharyngeal carcinoma (1516). However, to our knowledge, there is no published study regarding the application of DKI for monitoring chemotherapy response in patients with osteosarcoma. Therefore, our goal was to determine whether DKI has the power to further monitor tumor necrosis in patients with osteosarcoma.
Go to : 
MATERIALS AND METHODS
Patients
Our prospective study was approved by the Ethics Committee of Shanghai Sixth People's Hospital (YS-2016-064), and the written informed consent was obtained from all patients in this study. The inclusion criteria for patients were as follows: 1) newly pathological diagnosis of primary high=grade extremity osteosarcoma and no treatment before the MRI scan; 2) completion of neoadjuvant chemotherapy and surgery; 3) MRI scans obtained before and after the completion of neoadjuvant chemotherapy, with a time interval between the first MRI and the initiation of neoadjuvant chemotherapy of no more than 2 weeks, and a time interval between follow-up MRI and surgery of no more than 2 weeks. Thirty-two consecutive patients were prospectively registered between March 2016 and February 2017. Three patients were excluded due to serious motion artifacts after neoadjuvant chemotherapy. Thus, 29 patients (women, n = 9; men, n = 20; age range, 7–34 years; mean age, 17.6 ± 7.8 years) were enrolled in this study. All patients received four cycles of chemotherapy at intervals of 2–3 weeks. The chemotherapy regimen was a combination of cisplatin at a dose of 40 mg/m2 and doxorubicin at a dose of 25 mg/m2 for 3 days.
MRI Protocols
All studies were performed using a 3T superconducting magnetic resonance (MR) scanner (MAGNETOM Verio, Siemens Healthineers, Erlangen, Germany) with a dedicated eight-channel body array coil. Conventional MR sequence included fat-saturated T2-weighted sequences (repetition time [TR]/echo time [TE], 4000 msec/104 msec; field of view [FOV], 380 mm; image matrix, 384 × 384; section thickness, 5 mm) in the coronal, sagittal and axial planes and a coronal T1-weighed sequence (TR/TE 600 msec/20 msec; FOV, 380 mm; image matrix, 384 × 384; section thickness, 5 mm). Contrast-enhanced MRI was performed using fat-saturated T1-weighted sequences in the coronal, sagittal, and transverse planes after injection of 0.1 mmol/kg diethylenetriaminepentaacetic acid (Magnevist, Bayer AG, Berlin, Germany) into the median cubital vein. The scan parameters were identical to those described above.
DKI was obtained before contrast material injection. DKI (with b values of 0, 500, 1000, 1500, 2000, and 2500 sec/mm2) was performed in the axial plane using an echo planar sequence with fat-suppression (TR/TE, 3400 msec/72 msec; FOV, 380 mm; image matrix, 384 × 384; section thickness, 5 mm; flip angle, 180°; voxel size, 2.0 × 2.0 × 5 mm3; acquisition time, 4 minutes 37 seconds). The diffusion gradients were encoded in three orthogonal directions.
MR Image Analysis
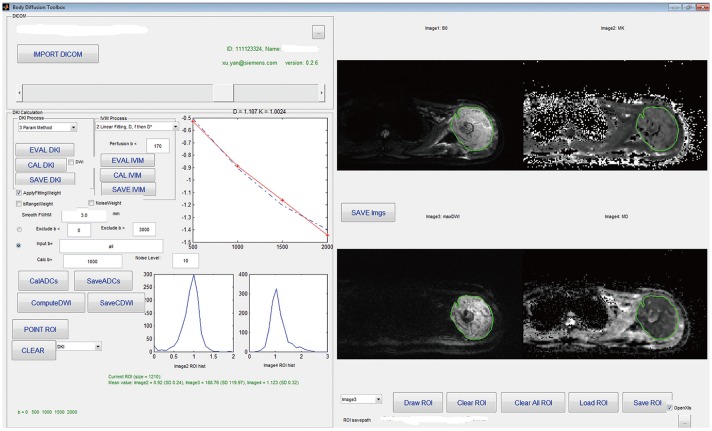
The parameter maps of both DKI and DWI were obtained using the prototype post-processing software “Body Diffusion Toolbox” created with MATLAB (Math Works, Natick, MA, USA) (17). An ADC map was calculated using a monoexponential model (with b values of 0 and 1000 sec/mm2) based on the following equation: ln (S) = ln (S0) − b · ADC, where S is the signal intensity at diffusion-weighting value b, and S0 is signal intensity at b = 0. The kurtosis and diffusivity maps were calculated from DKI with b values of 0, 500, 1000, 1500, 2000, and 2500 sec/mm2 based on the DKI equation: ln (S) = ln (S0) − b · D + 1/6 · b2 · D2 · K, where S is the signal at b value, S0 is the baseline signal without diffusion gradient, K is kurtosis, and D is diffusivity.
DKI was imported into the software to obtain the final fitted images (ADC map, mean diffusivity [MD] map, and mean kurtosis [MK] map). The region of interest (ROI) of pre-chemotherapy was manually drawn on the axial plane encompassing the largest area of tumor on the b0 image while simultaneously avoiding encircling distortion artifacts and macroscopically visible necrotic, cystic, and hemorrhagic areas using the T2-weighted images (T2WI) and enhanced T1-weighted image (T1WI) as a guide (10). The largest area of the tumor was selected by two musculoskeletal radiologists, each with 20 years of diagnostic imaging experience, in consensus, and who were blinded to the patients' histologic information. The ROI was automatically matched on diffusivity maps and kurtosis maps. The pixel-based mean value was calculated, and ADC, MD, and MK values were obtained by the software. An example of an ROI is shown in Figure 1. For patients with good response after chemotherapy, the ROI was drawn on the same area that was initially used in the pre-chemotherapy MRI.
The tumor volume was independently calculated by two musculoskeletal radiologists. The maximal intramedullary extension of each lesion was measured from the coronal plane on T1WI, while the widths and depths were measured from the axial plane on fat-saturated T2WI. When these two reviewers found more than 10% discrepancy in tumor volume, the tumors were re-measured, and agreement was reached by consultation. The tumor volume was then calculated using the standard mathematical formula for an ellipsoid (0.52 × length × width × depth) (18).
We defined change ratio (ΔX) in the ADC, MD, and MK values and tumor volume using following formula (14): ΔADC = (ADCpost − ADCpre) / ADCpre, ΔMD = (MDpost − MDpre) / MDpre, ΔMK = (MKpost − MKpre) / MKpre, ΔVolume = (Volumepost − Volumepre) / Volumepre.
Histopathologic Evaluation
The resected specimen in at least two of the largest longitudinal sections and in various axial sections was examined by two experienced pathologists, and the tumor necrosis rate was determined. Tumor necrosis was graded as grade I for 0–49% necrosis, grade II for 50–89% necrosis, grade III for 90–99% necrosis, and grade IV for 100% (19). Patients with grade III or IV (≥ 90% necrosis) were considered good responders, while those with grade I or II (< 90% necrosis) were considered poor responders.
Statistical Analysis
Statistical software packages (SPSS 16.0, SPSS Inc., Chicago, IL, USA; and MedCalc 14.0, MedCalc, Mariakerke, Belgium) were used to perform the statistical analyses. Two radiologists' measurements of ADC, MK, and MD values were analyzed using the interclass correlation coefficient (ICC). All data were first subjected to normal distribution using the Kolmogorov-Smirnov test. The differences between good responders and poor responders in various MRI parameters were compared using a two-tailed Student's t test. The relationship between tumor necrosis and various MRI parameters was determined by Pearson's correlation analysis. The diagnostic performances of various MRI parameters were analyzed using receiver operating characteristics and the best threshold, sensitivity, and specificity were calculated. The area under the curve (AUC) of various MRI parameters were compared using the nonparametric statistical methods proposed by DeLong et al. (20). P values less than 0.05 were considered to be statistically significant.
Go to :
RESULTS
Subject Characteristics
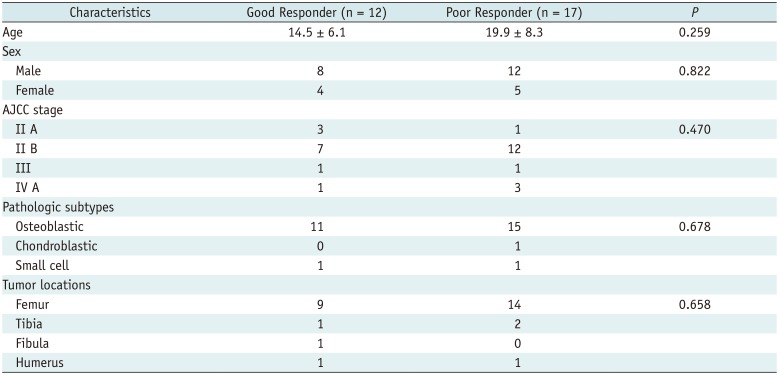
The characteristics of all patients are summarized in Table 1. In the present study, 2 patients underwent amputation, while the others underwent segmental resection and prosthetic replacement. Based on tumor size, a mean of 24 (range, 14–41 pieces) resected specimens from each patient was used to assess tumor response to neoadjuvant chemotherapy. Seventeen patients showed poor response, and 12 patients showed good response (Figs. 2, 3). There was a similar age and sex composition between groups (p = 0.259 and p = 0.822, respectively), and no significant difference was observed in the tumor American Joint Committee on Cancer stages and pathologic subtypes (p = 0.470 and p = 0.678, respectively).
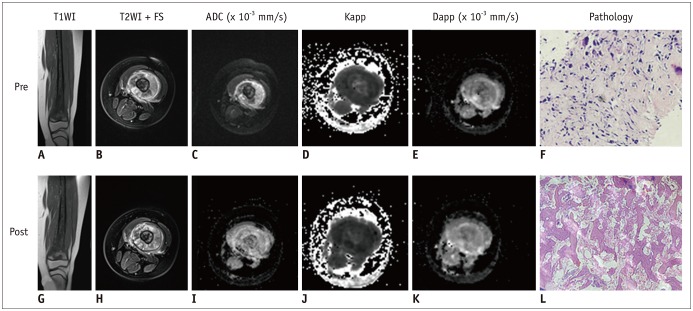 | Fig. 2Nine-year-old female with osteosarcoma in left femur and histopathology of poor responder.Images before (A–F) and after (G–L) chemotherapy are shown. A. Coronal T1WI shows tumor located in metaphysis of left distal femur and extended to diaphysis. B. Axial T2WI with FS shows tumor heterogeneity. C. ADC map shows hyperintense tumor (ADC = 0.97 × 10⁻³ mm2/s). D. MK map shows mixed high and low signal intensity tumor (MK = 0.85). E. MD map shows mixed high and low signal intensity tumor (MD = 1.37 × 10⁻³ mm2/s). F. Photomicrography (HE, × 200) confirms osteosarcoma. G. Coronal T2WI shows no significant change in intramedullary extension. H. Axial T2WI with FS magnetic resonance image shows changes in tumor structure compared to that of pre-chemotherapy. I. ADC value increased after chemotherapy (ADC = 1.43 × 10⁻³ mm2/s). J. MK value decreased after chemotherapy (MK = 0.61). K. MD value also increased after chemotherapy (MD = 1.87 × 10⁻³ mm2/s). L. Photomicrography (HE, × 200) shows viable cellular areas. Necrosis was found in 60% of tumor. ADC = apparent diffusion coefficient, Dapp = diffusivity map, FS = fat saturation, HE = hematoxylin and eosin stain, Kapp = kurtosis map, MD = mean diffusivity, MK = mean kurtosis, T1WI = T1-weighted imaging, T2WI = T2-weighted imaging
|
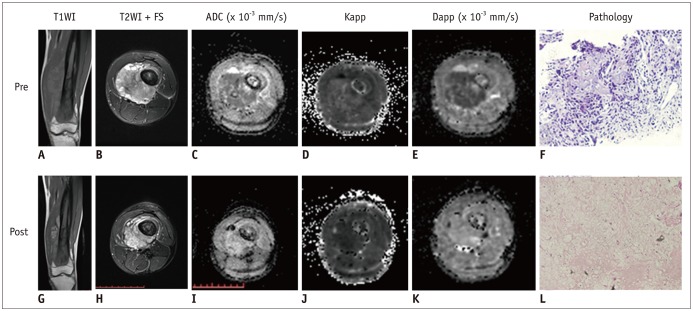 | Fig. 3Nineteen=year-old male with osteosarcoma and histopathology of good responses to neoadjuvant chemotherapy.Images before (A–F) and after (G–L) chemotherapy are shown. Compared to pre-chemotherapy, tumor size decreased on axial fat-saturated T2WI (B–H) whereas intramedullary extension changed little on coronal T1WI (A, G). ADC value significantly increased from 0.89 × 10⁻³ mm2/s to 1.72 × 10⁻³ mm2/s (C, I), whereas MK values significantly decreased from 0.93 to 0.53 (D, J). MD value also significantly increased from 1.26 × 10⁻³ mm2/s to 2.33 × 10⁻³ mm2/s (E, K). F. Photomicrography (HE, × 200) showed osteosarcoma with CT-guided biopsy before chemotherapy. L. Photomicrography (HE, × 200) depicts tumor necrosis rate of approximately 95% after chemotherapy.
|
Table 1
Summary of Clinicopathological Characteristics of All Patients
![]()
Reproducibility and Changes in MRI Parameters Based on the Histologic Response
The ICC of the two radiologists' measurements were 0.891 (95% confidence interval [CI]: 0.555, 0.977), 0.951 (95% CI: 0.782, 0.990), and 0.936 (95% CI: 0.720–0.986) for MDpre, MKpre, and ADCpre, respectively. The ICC for MDpost, MKpost, and ADCpost were 0.890 (95% CI: 0.553, 0.976), 0.826 (95% CI: 0.359, 0.962), and 0.926 (95% CI: 0.682, 0.984), respectively. There was good reproducibility for DKI-derived parameter analysis.
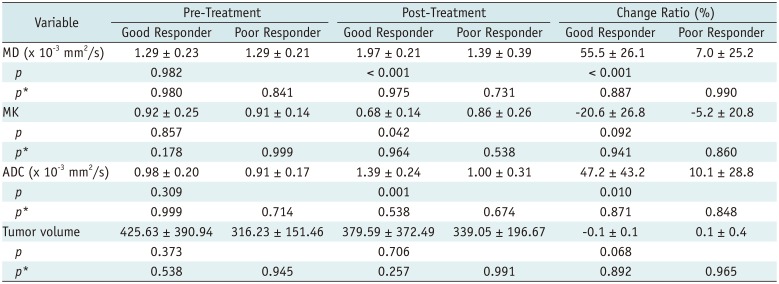
MDpre/post, MKpre/post, and ADCpre/post values and tumor volumepre/post exhibited normal distributions in both groups (Table 2). MDpost and ADCpost values were significantly higher in good responders (p < 0.001 for both), and MKpost values were lower in poor responders (p = 0.042). MD and ADC increased by 55.5 ± 26.1% and 47.2 ± 43.2%, respectively, while MK decreased by −20.6 ± 26.8% in good responders relative to the baseline. The ΔMD and ΔADC in good responders were significantly higher than those in poor responders (p < 0.001 and p = 0.01, respectively). However, no significant difference was observed in ΔMK (p = 0.092). Tumor volumepost and Δtumor volume between groups also did not reach statistical significance (p = 0.706 and p = 0.068, respectively) (Fig. 4, Table 2).
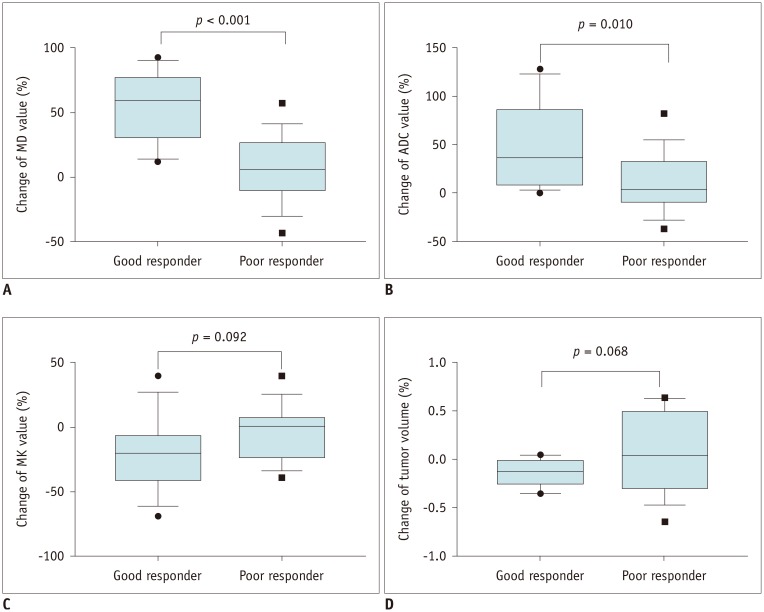 | Fig. 4Box plots show ΔMD10th, ΔADC10th, ΔMK10th, and Δtumor volume10th in good responders and poor responders.
A. Compared to poor responders, there was statistically significant difference in ΔMD of good responders (p < 0.001). B. ΔADC was significantly higher in good responders than in poor responders (p = 0.010). C. No significant difference in ΔMK was observed between good responders and poor responders (p = 0.092). D. There was also no significant difference in Δtumor volume (p = 0.068). ΔX = change ratio
|
Table 2
Comparison of Various MRI Parameters between Good Responders and Poor Responders
![]()
Relationship between Tumor Necrosis and Imaging Indexes, and Diagnostic Performance Analyses
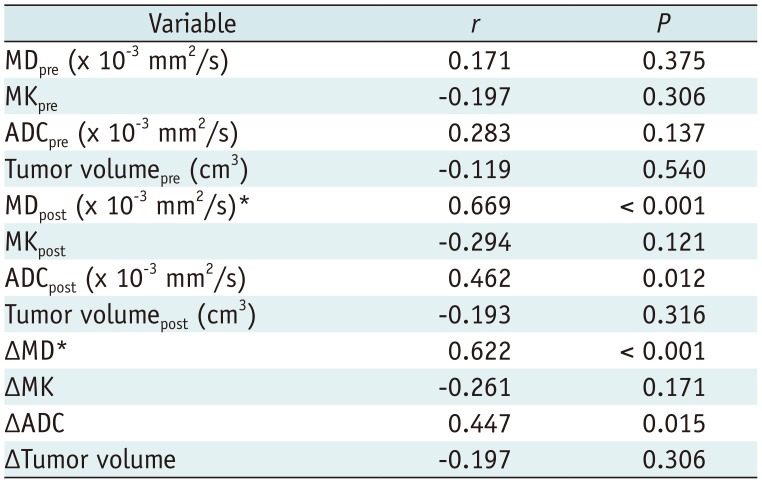
The correlation between tumor necrosis rate and MRI indexes are summarized in Table 3. MDpost and ΔMD showed high correlation (r = 0.669 and r = 0.622, respectively) with tumor necrosis rate (Fig. 5). ADCpost and ΔADC were positively correlated with tumor necrosis rate (r = 0.462 [p = 0.012] and r = 0.447 [p = 0.015], respectively), while MKpost and ΔMK showed no significant correlation (p = 0.121 and p = 0.171, respectively).
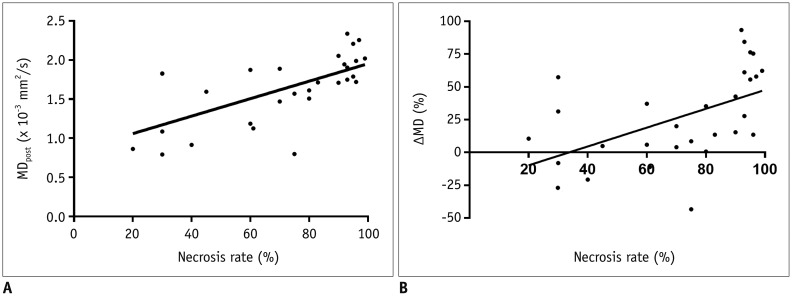 | Fig. 5Scatterplot showing relationship between tumor necrosis rate and MDpost and ΔMD.
A. MDpost was positively correlated with necrosis rate (r = 0.669, p < 0.001). B. ΔMD also showed positive correlation with necrosis rate (r = 0.622, p < 0.001).
|
Table 3
Correlation between Tumor Necrosis Rate and Diffusion-Weighted MRI Parameters
![]()
Table 4 shows various MRI parameters to access good response to chemotherapy. MDpost resulted in the highest AUC of 0.91 (95% CI: 0.753, 0.986. p < 0.001), with the optimal cutoff at 1.61 × 10⁻³ mm2/s (sensitivity, 100%; specificity, 70.6%). For comparison of MDpost, ADCpost, and MKpost, MDpost had higher diagnostic performance than ADCpost (p = 0.037) and MKpost (p = 0.011). ADCpost and MKpost had a similar diagnostic performance (p = 0.058). For comparison of ΔMD, ΔADC, and ΔMK, ΔMD presented the highest AUC of 0.92 (95% CI: 0.759, 0.988. p < 0.001), with the optimal cut off at 13.5% (sensitivity, 100%; specificity, 70.6%). Similarly, ΔMD showed higher diagnostic performance than ΔADC (p = 0.033) and ΔMK (p = 0.037). No significant difference was observed in the diagnostic performance of ΔADC and ΔMK (p = 0.434) (Fig. 6).
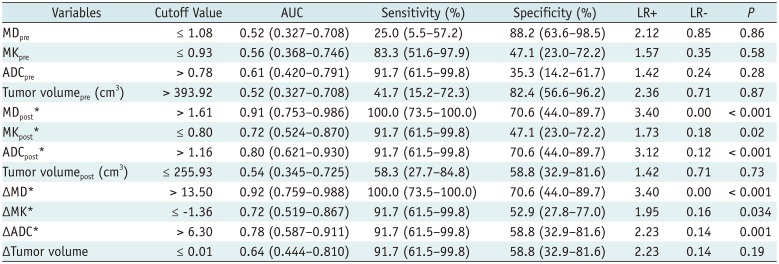
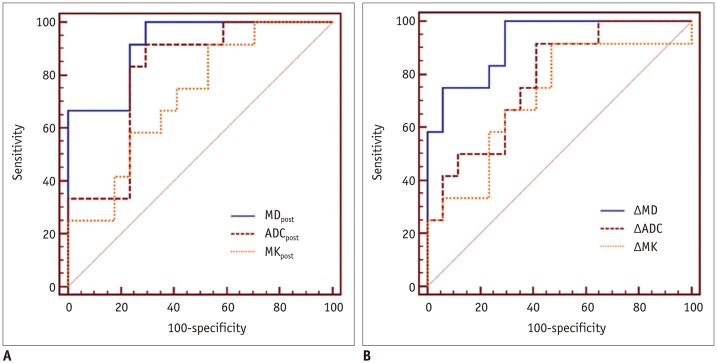 | Fig. 6A. ROC curves showing diagnostic performance of MDpost, ADCpost, and MKpost in assessing good response to neoadjuvant chemotherapy. MDpost resulted in highest AUC of 0.91 (95% CI: 0.753, 0.986. p < 0.001), and MDpost had higher diagnostic performance than ADCpost (p = 0.037) and MKpost (p = 0.011). B. ROC curves showing diagnostic performance of ΔMD, ΔADC, and ΔMK. ΔMD presented highest AUC (0.92, 95% CI: 0.759, 0.988, p < 0.001), with optimal cutoff value at 13.5% (sensitivity, 100%; specificity, 70.6%), and ΔMD showed higher diagnostic performance than ΔADC (p = 0.033) and ΔMK (p = 0.037). AUC = area under curve, CI = confidence interval, ROC = receiver operating characteristic
|
Table 4
Diagnostic Performance for Diffusion-Weighted MRI Indexes in Assessing Good Response
![]()
Go to :
DISCUSSION
Our initial findings showed that MD may potentially serve as an optimal surrogate imaging biomarker for histological tumor necrosis in patients with osteosarcoma.
Until now, there has been no agreement on the relationship between histological tumor necrosis and ADC values. Uhl et al. (21) and Hayashida et al. (14) confirmed the ability of DWI to distinguish good and poor responders based on a short series. However, with a larger series of osteosarcoma patients, Oka et al. (13) and Bajpai et al. (12) found no significant difference between good and poor responders in terms of ADC measured at the end of the chemotherapy. In our present study, the results showed a significant difference in MDpost and ΔMD between patients with good and poor responses. Compared to MDpost and ΔMD in poor responders, those in good responders were significantly increased, which may be due to post-chemotherapeutic changes, such as cell and intracellular membrane injury or cell death, or a decrease in tumor cell density could cause an expansion of the extracellular space and lead to free diffusion of extracellular water.
Compared to ΔADC, ΔMD showed higher diagnostic performance and higher correlation with tumor necrosis. These may be explained as follows: first, the DWI model supposed that water diffusion in tissue was normally distributed and that signal intensity presented linear decay as the b values increased, whereas the DKI model analyzed the water diffusion as a non-Gaussian phenomenon by a polynomial model. MD is the corrected diffusion coefficient accounting for non-Gaussian behavior, which could better reflect water diffusivity. Second, the ADC measurement only reflects the degree of water molecular diffusion hindered in extracellular space, and easily influenced by tissue architectural properties such as vessel and extracellular space tortuosity (22). In contrast, MD could reflect water's molecular heterogeneous properties at the nanoscopic level including its polar nature and 3-dimensional array (23). Third, ADC could not specifically reflect cellular density on water motion; it was influenced by the presence of a greater concentration of macromolecules and increased viscosity (24).
In contrast to MDpost, MKpost in poor responders was higher than that in good responders. Studies showed that higher MK values indicated increased irregularity and heterogeneity of tissue microstructure as well as the amount of interface of cellular tissues (25). In poor responders, tumors were insensitive or resistant to chemotherapy; the toxicity of anti-tumor chemotherapeutics may induce mitochondrial and organelle swelling, increase the nuclear-cytoplasmic ratio of tumor cells, or induce mitosis of tumor cells and proliferate and form new colonies. Moreover, after chemotherapy, slight necrosis, hemorrhage, granulation tissue formation, and fibrosis further increase structural complexity (26). Surprisingly, no significant difference was observed in ΔMK between good and poor responders. On one hand, this may be related to the small number of subjects. On the other hand, in some areas of chemotherapy-induced viscous or turbid fluid, MD was reduced while MK was not increased. Moreover, compared to ADCpost, ΔADC, and MKpost, ΔMK had lower specificity, which may be related to the intrinsic nature of osteosarcoma. Compared with other tissues, bone tumors may exhibit faster signal decays as b values increase (27). Furthermore, in good responders, there was extensive inflammatory cell infiltration, interstitial fibrosis, and granulation tissue in the bone marrow cavity with the tumor necrosis. This may partially explain our findings.
Our study also showed no significant difference in the change in tumor volumes between good responders and poor responders. Although the change in tumor size remains the standard modality for monitoring response to treatment in current international therapy optimization trials, our findings confirmed that this is not sufficient to monitor tumor regression. This is mainly because chemotherapy-induced response in intraosseous or mineralized tumor partitions can leave imprints that lead to only a little change in tumor volumes, especially in tumors with little or no soft tissue component (6). Moreover, in some patients with good response, tumor volume was stable or even larger than pre-chemotherapy due to cystic degeneration (12).
There are several potential limitations in our study. First, the number of subjects was small, which may result in biased conclusions. Second, the follow-up period was relatively short, and we could not analyze the relationship between survival rate and DKI parameters. Third, DKI required a relatively long acquisition time, which may have increased motion artifacts. Fourth, irregular tumor shapes may not fit well into an ellipsoid formula, which may cause under- or over-estimation of tumor volume. Fifth, CT-guided biopsy pre-chemotherapy may slightly affect tumor composition and measurement in MD, MK, and ADC values. Sixth, the minimal b value of 0 for DKI was used in our study, which might have increased the intravoxel incoherent motion effects. Finally, early mid-therapy and the time course of DWI kinetic parameter changes should be explored further.
In summary, MD is a promising biomarker for monitoring tumor response to preoperative chemotherapy in patients with osteosarcoma, and MDpost and ΔMD were found to serve as potentially optimal surrogate imaging biomarkers for histological tumor necrosis, which will contribute to decisions regarding individual surgical planning, additional treatment, and follow-up strategies.
Go to :
 XML Download