

 PDF
PDF ePub
ePub Citation
 Print
Print


INTRODUCTION
In patients with gastric cancer, surgical resection is the gold standard for curative treatment. However, gastric cancers are often diagnosed at an advanced stage, leading to poor prognosis (12). To improve the patients' outcomes, neoadjuvant, adjuvant, and palliative therapeutic options have been actively investigated in many clinical trials (12). Accurate classification and risk stratification of patients with gastric cancers at initial diagnosis are important for making management decisions and predicting prognosis (3). The endoscopic biopsy specimen is used to determine the histologic type and grade of gastric cancer but has limitation to represent the entire tumor due to intratumoral heterogeneity; quantitative imaging analysis including a larger tumor area has potential to reflect the histologic characteristics of the tumor more accurately (45) and can be applied even in patients with unresectable gastric cancers.
Perfusion imaging techniques are utilized in many oncologic fields as they provide quantitative imaging biomarkers which reflect the tumor's microvascular structures and/or function (67891011). Perfusion imaging of the stomach has been considered as challenging due to peristaltic movement; however, due to recent advances in image registration and fast imaging technique, studies have shown the technical feasibility of perfusion CT (PCT) and dynamic contrast-enhanced (DCE) MRI for evaluating gastric cancers (121314). In addition, reports have indicated that the tumor perfusion parameters of PCT or DCE-MRI differ significantly according to the tumor stage and histologic grade of gastric cancer (1214), and can be used as prognostic predictors of the tumor response to palliative chemotherapy (13). More recently, double contrast-enhanced ultrasound (CEUS) with the combined use of oral and intravenous ultrasound contrast agents has been introduced as a reliable diagnostic method to evaluate both the morphologic features and enhancement patterns of gastric cancers (15). Reports have indicated that CEUS is useful in the differential diagnosis (1516), preoperative gross classification (17), and T-staging (18) of gastric cancers. Moreover, the respiratory motion correction techniques in free-breathing CEUS (19) enable accurate quantification of the tumor perfusion of gastric cancers (2021).
While both CEUS and PCT can provide information related to tumor perfusion, CEUS has advantages over PCT in terms of safety profile, cost, and lack of ionizing radiation (22); hence if CEUS is confirmed as a suitable alternate to PCT for quantification of tumor perfusion, it may be beneficial especially to patients with renal dysfunction or pediatric patients, and those enrolled in clinical trials who undergo repeat monitoring of response.
This study aimed to assess the feasibility of quantitative DCE CEUS for use in patients with advanced gastric cancers and investigate the relationship between CEUS parameters and PCT parameters of gastric cancers as well as their correlation with histologic features.
Go to : 
MATERIALS AND METHODS
Study Population
This prospective study was approved by our Institutional Review Board. Written informed consent was obtained from each patient. This study population was a subgroup of a prospective study which primarily aimed to evaluate the performance of PCT in patients with gastric cancers. Inclusion criteria were as follows: 1) patients with biopsy-proven gastric cancers staged as advanced gastric cancers (T2 or greater) through endoscopy scheduled to undergo baseline PCT who were enrolled in the main study; 2) those who provided informed consent to undergo CEUS for gastric cancers after undergoing PCT. Patients whose gastric cancers were not clearly visualized through B-mode ultrasound imaging before CEUS were excluded. From December 2015 to August 2016, among those patients scheduled to undergo baseline PCT for gastric cancers, 53 patients were assessed for eligibility using B-mode ultrasonography after ingesting 500–1000 mL of water by one of two radiologists with 5 and 15 years of experience in CEUS, respectively. Among these, 10 patients were excluded as their gastric cancers were not clearly visible on ultrasound imaging. Finally, 43 patients (23 male individuals and 20 female individuals) with mean (± standard deviation) age of 61.4 (± 15.0) years (age range, 19–85 years) were enrolled in the study. Some PCT data from this study population (n = 19) were also included in the prior study to assess the performance of PCT for predicting histologic features (23). Different from the prior study (23), the current study aimed to evaluate the performance of CEUS and correlation between CEUS and PCT.
PCT Protocol
All PCT examinations were performed on a 64-slice multidetector CT scanner (SOMATOM Definition; Siemens Healthineers, Erlangen, Germany). Each patient was administered an intravenous injection of 10 mg of hyoscine butylbromide (Buscopan®; Boehringer Ingelheim Korea, Seoul, Korea) 5 minutes prior to the PCT study to minimize bowel movement, and 500–1000 mL of water immediately prior to the PCT study to distend the stomach. After acquisition of non-contrast images, the scan location for PCT was determined according to the site of the gastric cancer. A total of 40 mL of a non-ionic iodinated contrast agent (350 mgI/mL; iobitridol, Xenetix 350; Guerbet, Aulnay-sous-Bois, France) was administered at a rate of 5 mL/sec followed by 50 mL of normal saline at the same rate using a power injector via the antecubital vein. Acquisition of PCT images was started 6 seconds after injection of the contrast agent and lasted for 60 seconds including 15 phases at 3.6-second interval. The following acquisition parameters were used: scan range of 8 cm, rotation time of 0.4 seconds, effective tube current of 100 mAs at 80 kVp, and slice thickness of 3 mm. All patients were asked to breathe quietly during the PCT examination.
CEUS Protocol
CEUS examinations were performed on the same day of the PCT examinations using a single ultrasound scanner (LOGIQ E9, GE Healthcare, Milwaukee, WI, USA) with a convex array probe (1–6 MHz) by one of the two radiologists who also assessed the eligibility of the patients. Patients were requested to maintain nil per os status for at least 4 hours prior to the CEUS examination. After the patients had ingested 500–1000 mL of water, B-mode ultrasound was performed in supine or left lateral decubitus position, and the imaging plane showing the largest tumor dimension at parallel axis to the respiratory-related movement of the tumor was selected. All patients were requested to breathe quietly during the CEUS examination. CEUS images were obtained in contrast-specific ultrasound mode with the following parameters: harmonic mode, dynamic range of 69 dB, mean gain of 24 dB, mechanical index of 0.15–0.17, and imaging frame rate of approximately 11 frames per second. Immediately after intravenous bolus administration of 2.4 mL of SonoVue® (Bracco, Milan, Italy) via the antecubital vein (18-guage or 20-gauge cannula) followed by 5-mL normal saline, continuous scanning was conducted for 90 seconds without changing the position of the probe. The raw digital data were stored as cine loops and exported as Digital Imaging and Communications in Medicine files for further analysis.
Image Analysis
Post-processing of PCT and CEUS was performed by one radiologist who was blinded to the histologic features and operation records.
PCT analysis was performed using a post-processing platform with dedicated PCT software (Syngo Volume Perfusion CT body®; Siemens Healthineers). First, motion correction using a non-rigid registration method was applied. Subsequently, the abdominal aorta was selected as the input artery, and perfusion analysis was performed using a combination of the maximum slope approach and delayed Patlak analysis. Through PCT software, a freehand region of interest (ROI) was drawn on the gastric cancer in the representative axial plane so as to include the largest tumor dimension, and blood flow (BF) (mL/100 g/min), blood volume (mL/100 g), time to peak (TTPCT) (second), mean transit time (MTTCT) (second), and permeability surface product (mL/100 g/min) of the selected ROI were automatically calculated.
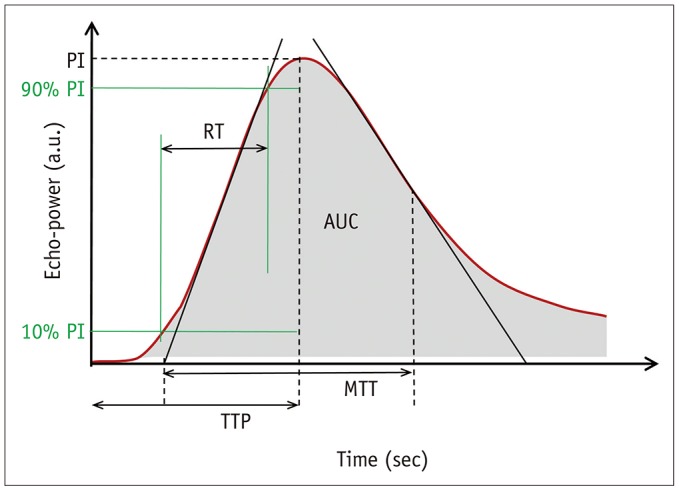
CEUS analysis was performed using a post-processing platform with dedicated CEUS software (VueBox®; Bracco) (19). After applying automatic in-plane motion correction, a freehand ROI was drawn on the gastric cancer lesion. CEUS studies were determined to be of diagnostic image quality according to the quality of fit (QOF) provided by the software, which represents the degree of agreement between the raw data and fitted mathematical model. If the QOF was less than 50% in up to three attempts of placement of the ROI, the CEUS examination was regarded as non-diagnostic. The CEUS software then provided quantitative CEUS parameters of the selected ROI including the peak intensity (PI), area under the curve (AUC), rise time (RT) from 10% to 90% of the PI, TTPUS, and MTTUS (Fig. 1).
Histologic Analysis
In all patients who underwent surgical resection of gastric cancers, the pathologic T and N-stage according to the American Joint Committee on Cancer 7th edition classification, tumor differentiation status (well-differentiated [WD], moderately-differentiated [MD], or poorly-differentiated [PD]) and histologic type (poorly cohesive carcinoma [PCC] or non-PCC) were reported. In immunohistochemistry analysis, the expression levels of epidermal growth factor receptor (EGFR) and human epidermal growth factor receptor 2 (HER-2) were scored as follows: 0, no membrane staining; 1+, faint or partial staining; 2+, moderate staining; and 3+, strong staining.
Statistical Analysis
Gastric cancers with technical success and those with technical failure were compared with regards to the tumor location and Borrmann type based on the endoscopic reports. In all patients with CEUS images of diagnostic quality, the correlation between CEUS and PCT parameters of gastric cancers was analyzed using Spearman's rank correlation analysis. In addition, in patients who had undergone gastrectomy, the CEUS and PCT parameters were compared according to histologic features (T-staging, ≤ T2 vs. ≥ T3; N-staging, N0 vs. N-positive; tumor differentiation, WD or MD vs. PD; histologic type, PCC vs. non-PCC; EGFR or HER-2 expression, 0 or 1+ vs. 2+ or 3+) using Mann-Whitney test. A p value of less than 0.05 was considered as statistical significance. All statistical analyses were performed using commercially available statistical software (MedCalc®, version 17.9.2; MedCalc Software, Ostend, Belgium).
Go to :
RESULTS
Among the 43 patients included in this study, CEUS examinations of 38 patients (88.4%) were classified as diagnostic quality for the assessment of gastric cancers indicating technical success of CEUS, while the other five patients (11.6%) were classified as non-diagnostic quality indicating technical failure. The comparison of tumor characteristics of patients with technical success versus failure of CEUS is shown in Table 1. Gastric cancers at the upper location (cardia, fundus, or high body) showed a significantly higher technical failure rate than those at the lower location. Among the 38 patients with technical success, gastrectomy was performed in 22 patients and the interval between CEUS and surgery was 28.4 ± 10.2 days (mean ± standard deviation) (range, 11–44 days). The detailed histologic features of gastric cancers in patients who underwent surgical resection are shown in Table 2.
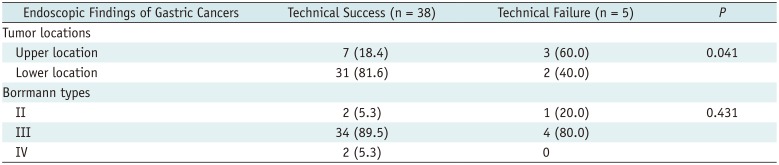
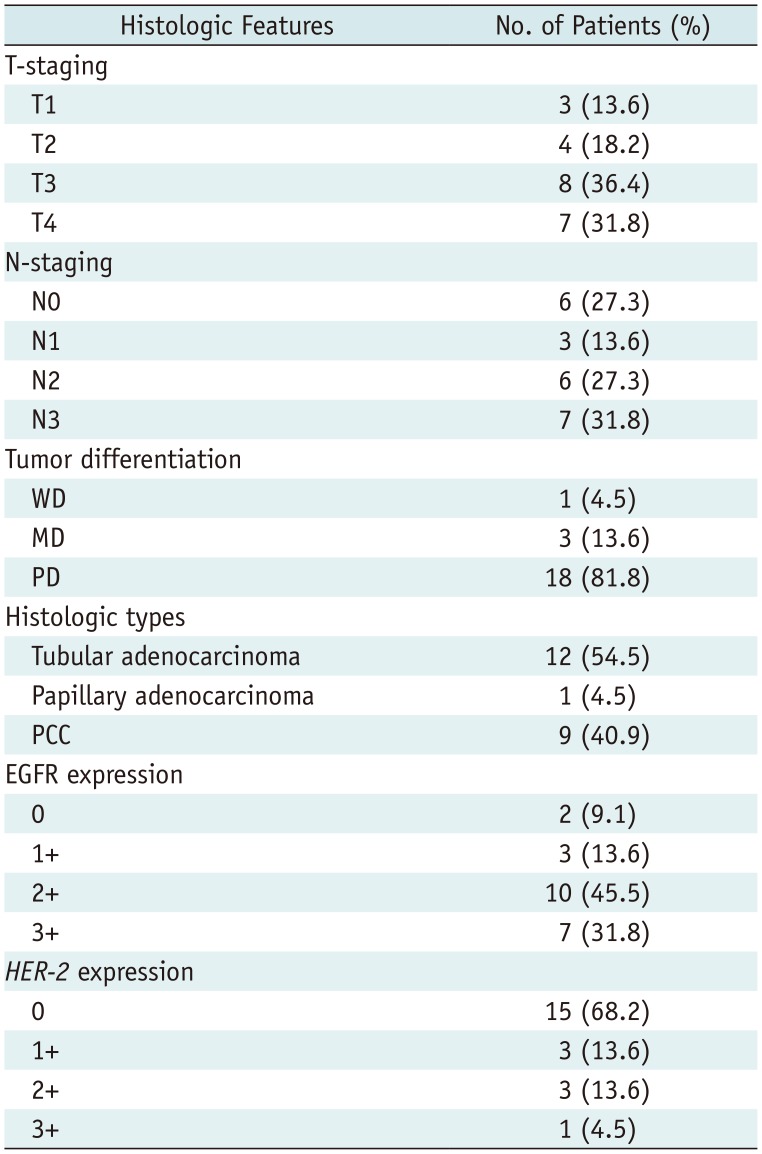
Table 1
Characteristics of Gastric Cancers in Patients with Technical Success and Failure on CEUS
![]()
Table 2
Histologic Features of Gastric Cancers in Patients Who Underwent Gastrectomy (n = 22)
0, no membrane staining; 1+, faint or partial staining; 2+, moderate staining; and 3+, strong staining. EGFR = epidermal growth factor receptor, HER-2 = human epidermal growth factor receptor 2, MD = moderately-differentiated, PCC = poorly cohesive carcinoma, PD = poorly-differentiated, WD = well-differentiated
![]()
Correlation between CEUS and PCT Parameters
Among the quantitative parameters of CEUS and PCT, the time-related parameters of RT and TTPUS of CEUS showed significant positive correlations with TTPCT (rho = 0.327 and 0.374, p = 0.045 and 0.021, respectively); the other CEUS parameters showed no significant correlations with any PCT parameters (Table 3).
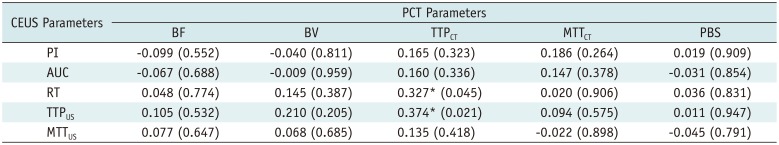
Table 3
Correlation between CEUS Parameters and PCT Parameters of Gastric Cancer
![]()
Comparison of CEUS and PCT Parameters according to Histologic Features
CEUS and PCT parameters according to the histologic features of gastric cancers in patients who underwent surgical resection are described in Tables 4 and 5, respectively.
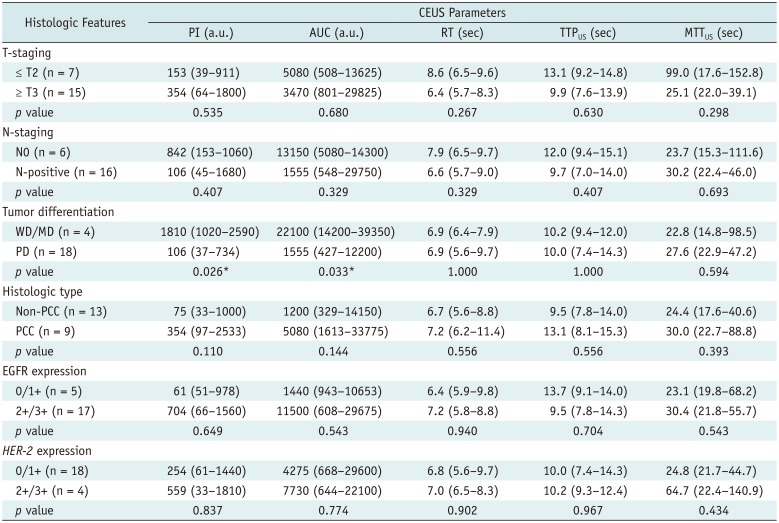
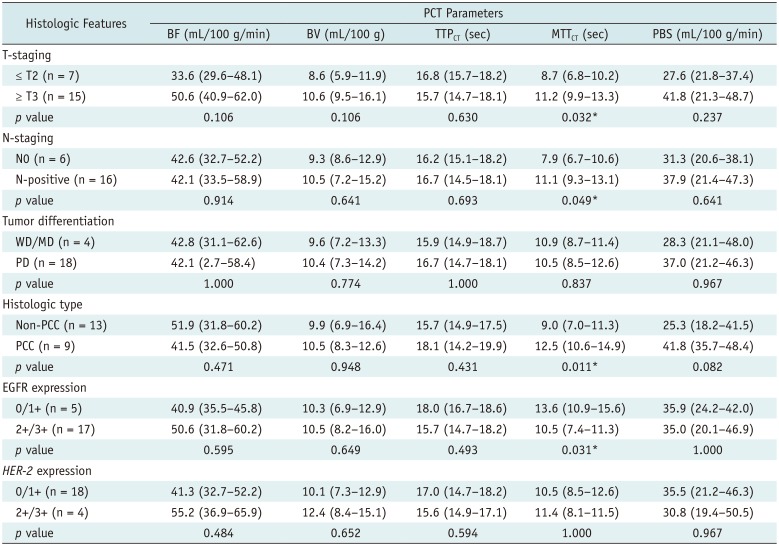
Table 4
Comparison of CEUS Parameters according to Histologic Features of Gastric Cancer
![]()
Table 5
Comparison of PCT Parameters according to Histologic Features of Gastric Cancer
![]()
Among the CEUS parameters, the amplitude-related parameters of PI and AUC showed significant differences according to the tumor differentiation status (WD/MD vs. PD: median PI, 1810 a.u. vs. 106 a.u., p = 0.026; median AUC, 22100 a.u. vs. 1555 a.u., p = 0.033, respectively) (Table 4). Representative examples are shown in Figures 2 and 3.
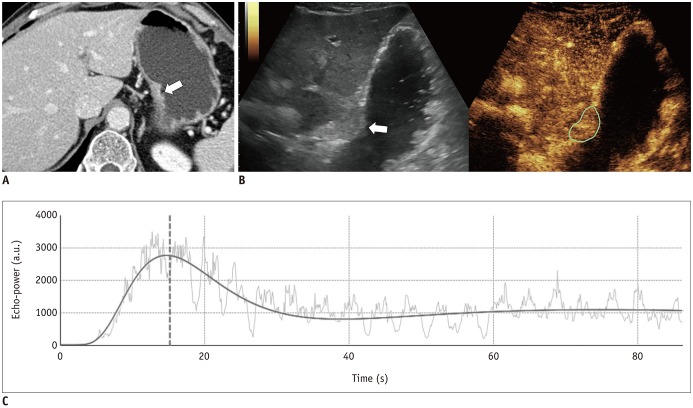 | Fig. 2Sixty-two-year-old male patient with surgically-proven pT2N0 gastric cancer of moderately-differentiated adenocarcinoma.
A. Preoperative contrast-enhanced CT image shows enhancing ulceroinfiltrative mass (arrow) at level of gastric mid body. B. CEUS image shows enhancing mass (arrow, green ROI) at corresponding location of water-distended stomach. C. Time-intensity curve analysis reveals PI of 2619 a.u. and AUC of 48820 a.u. ROI = region of interest
|
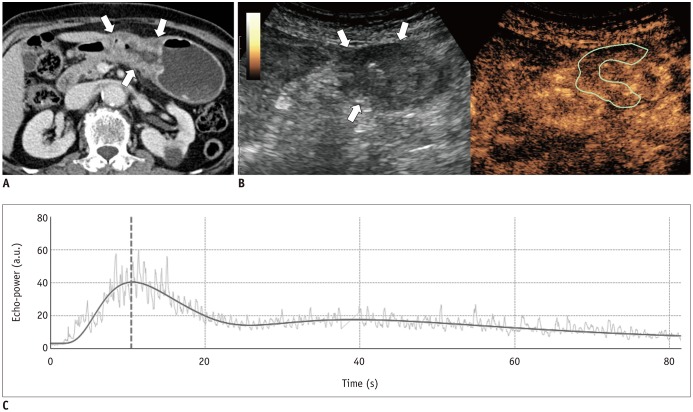 | Fig. 3Eighty-two-year-old female patient with surgically-proven pT3N0 gastric cancer of poorly-differentiated adenocarcinoma.
A. Axial CT image shows ulceroinfiltrative mass involving gastric low body and antrum (arrows). B. CEUS image reveals mass (arrows, green ROI) showing mild enhancement. C. Time-intensity curve analysis reveals PI of 36.9 a.u. and AUC of 342.0 a.u.
|
Among the PCT parameters, MTTCT showed significant differences according to the histologic types (PCC or non-PCC), T-staging (≤ T2 vs. ≥ T3), N-staging (N0 vs. N-positive), and the expression level of EGFR (≤ faint vs. ≥ moderate staining) (p < 0.05) (Table 5); none of the PCT parameters showed significant differences according to the tumor differentiation (p > 0.05).
Go to :
DISCUSSION
Our study results demonstrated the feasibility of CEUS to quantify the tumor perfusion of gastric cancers with a high success rate (88.4%, 38/43). Gastric cancers have been regarded as non-suitable targets for CEUS as lesions are frequently obscured by bowel gas on ultrasonography and can be highly affected by the patients' respiratory motion. However, these limitations have been substantially overcome by double contrast-enhanced technique for data acquisition (15) and motion-correction algorithms for data post-processing (19) which were used in our study. Considering that perfusion analysis of gastric cancers is gaining increasing attention in the preoperative assessment as well as monitoring of treatment response in patients with gastric cancer (1314), CEUS is a promising tool that can be used as a non-invasive approach without concerns of ionizing radiation or renal dysfunction (24). However, it should be noted that perfusion quantification through CEUS can be applied in select patients with visible lesions on gray-scale images using the double contrast-enhanced technique and gastric cancers of the lower location in the stomach as indicated by the technical success rate attained in our study.
Studies to assess the perfusion of gastric cancers have mainly focused on PCT than CEUS (122325) but CEUS has recently shown promising results (26). However, the interchangeability or differences between the parameters derived from CEUS and PCT remain unknown. In this study, assessment of the relationship between the CEUS and PCT parameters of gastric cancers revealed that time-related parameters of RT and TTPUS of CEUS showed significant positive correlations with TTPCT of PCT, while PI, AUC, and MTTUS of CEUS showed no significant correlations. These results are in agreement with those of previous studies on liver tumors which demonstrated the correlations between the arterial perfusion parameters of CEUS and PCT but not that of the portal perfusion parameters (2728). RT and TTPUS as well as TTPCT are considered to reflect tissue vascularity and hence show high values in tumors with high vascularity and low values in tumors with low vascularity. In contrast, MTTUS and MTTCT were not correlated in our study possibly due to the use of different contrast agents of different enhancement kinetics between the modalities (pure intravascular agent of CEUS and diffusible agent of PCT). Considering that MTT indicates the average time taken by blood to pass through the capillary network, higher tumor vascularity and arteriovenous shunts may shorten the MTTUS as well as the MTTCT (6); whereas, the leaky vasculature of the tumor would prolong the MTTCT and have no effect on the MTTUS (29) as ultrasound contrast agents do not leak into the interstitial space. This difference may explain the result of our study of poor correlation between the MTTCT and MTTUS. These results suggest that CEUS and PCT are not interchangeable in the perfusion quantification of gastric cancers.
In our study, the comparison of perfusion parameters according to the histologic features of gastric cancers indicated that the amplitude-related parameters of PI and AUC of CEUS showed significantly higher values in WD or MD cancers than in PD cancers, while none of the PCT parameters showed significant differences according to tumor differentiation. PI and AUC of CEUS are indicators of the degree of enhancement and reflect the vascularity of gastric cancers (20) as well as other tumor types such as colorectal, ovarian, and prostate cancers (303132). Our study results of lower PI and AUC values for the PD tumor type are in agreement with those of previous studies of lower density of the microvessel based on histology (33) and lower BF on PCT (34) in PD gastric cancers. Nevertheless, several previous studies have demonstrated that PD gastric cancers show higher microvessel density (35) or higher values of perfusion imaging parameters (25) than WD or MD tumors. To clarify the relationship between the CEUS parameters and histologic features, further studies including multivariate analysis of a larger study population to control confounding variables are needed. With regard to PCT, in our study, the MTTCT showed higher values in the tumors of more advanced T and N-stage and PCC type, and lower values in the tumors with higher EGFR expression, while none of the CEUS parameters showed significant differences according to these histologic features. Therefore, our study results suggested that the combined CEUS and PCT parameters would provide more detailed characteristics of the tumor perfusion in gastric cancer patients.
Our study has some limitations. First, our study population was relatively small and the reference standard for histologic features was obtained in only a subgroup of patients who underwent gastrectomy. Second, we performed two-dimensional perfusion analysis of CEUS which has capability to provide information of a single slice of the tumor. Moreover, although we selected an image plane containing the largest tumor dimension, the image plane for CEUS may not have been identical to that for PCT; to overcome this limitation, volumetric analysis of the tumor perfusion is a promising tool to accurately reflect the heterogeneity of the whole tumor. Third, our study indicated that some CEUS parameters may be useful to predict the pathologic prognostic features of gastric cancers, however, it did not directly assess the predictive values of the patients' outcomes. Further prospective studies with long-term follow-up are required to determine the prognostic function of CEUS in patients with gastric cancer.
In conclusion, CEUS is technically feasible for quantification of the tumor perfusion in patients with gastric cancers and provides correlative and complementary information to that through PCT to enable predicting histologic features.
Go to :
 XML Download