

 PDF
PDF ePub
ePub Citation
 Print
Print


INTRODUCTION
Primary Budd-Chiari syndrome (BCS) is a rare disorder caused by obstruction of the hepatic venous outflow tract (1), resulting in elevated hepatic congestion, portal hypertension, and possible cirrhosis and increased liver stiffness (LS) (23). LS can be assessed by elastographic techniques such as transient elastography (TE) and magnetic resonance elastography (MRE) (3456). A previous study showed that TE is a useful noninvasive tool for evaluating hepatic congestion and it provides indirect insights into the outcomes and benefits of interventional therapy in patients with BCS (7). However, TE has significant limitations. There are no real-time or gray-scale imaging options and it is difficult to measure LS values in obese patients and patients with ascites (5).
In recent years, MRE has proved to be a promising diagnostic tool with high reproducibility and repeatability for assessing LS and fibrosis (8910). However, most studies have only assessed patients with fibrosis caused by hepatitis and non-alcoholic fatty liver (11). The main aim of this study was to measure LS using MRE in patients with BCS and to assess the usefulness of measuring LS to evaluate endovascular intervention outcomes.
Go to : 
MATERIALS AND METHODS
This prospective clinical study was approved by the local Institutional Review Board. Written informed consent was obtained from all patients.
Subjects
Between December 2016 and August 2018, a total of 28 patients were identified with suspected BCS based on clinical and radiologic examinations. Magnetic resonance imaging (MRI) and magnetic resonance venous angiography were performed in all 28 patients. Only patients who had primary BCS and had no liver tumor were included in the final analysis. Among the 28 patients, 23 fulfilled these criteria. These patients comprised of 13 males and 10 females with a mean age of 42.6 ± 12.6 years (range 31–56 years), and a mean body mass index of 21.3 kg/m2 (range 17.3–23.7 kg/m2).
MRE and Endovascular Intervention
All MRE examinations were performed with a 3T clinical unit (Discovery 750w, GE Healthcare, Milwaukee, WI, USA) equipped with a 32-element phased-array coil. A 19-cm-diameter, 1.5-cm-thick passive pneumatic driver was placed over the right rib cage at the level of the xiphoid process to generate 60-Hz shear waves. Magnitude and unwrapped phase difference wave images were acquired with a two-dimensional spin-echo echo-planar MRE sequence using the following parameters: repetition time/echo time = 1000/59 ms, matrix: 64 × 64, 8-mm thickness with no gap, and 42-cm field-of-view (12). Four transverse slices through the largest transverse dimension (including the three main hepatic veins [HVs]) of the liver were obtained during a 24-second breath-hold at the end of expiration. All patients underwent two MRE examinations before the interventional treatment started. When the first examination was completed, the patient was repositioned before the second scan was performed.
For patients who had undergone only balloon dilation, a third MRE examination was performed within three days after the interventional therapy. The inferior vena cava (IVC) balloon had a diameter of 26–30 mm and a length of 40–50 mm (Optimed, Ettlingen, Germany; or Cook Medical, Bloomington, IN, USA). The HV balloon had a diameter of 10–14 mm and a length of 40 mm (Cook Medical). The pressure gradient between either the HV or IVC and the right atrium was measured through catheterization before and after angioplasty.
Patients were followed-up one month after treatment, and clinical presentation and laboratory variables were recorded.
Quantitative MRE Analysis
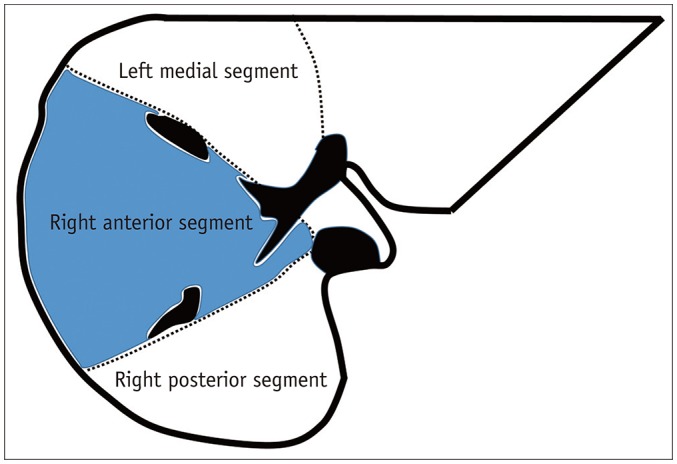
MRE wave images, elastograms, and confidence maps were automatically generated on the scanner. Two radiologists (one with seven years of experience in abdominal MRI and the other with four years of experience) reviewed the MRE images separately; they were blinded to each other's analyses and the treatment information. A central liver section slice including three main HVs and most of the liver parenchyma was selected for LS analysis. Regions of interest (ROIs) were drawn on each of the three liver segments (the right posterior, right anterior, and left medial segments). The method was designed to allow the placement of an ROI as large as possible with free-hand drawing on the anatomical and wave images. ROIs included the greatest part of the liver parenchyma in each segment, excluding large blood vessels (Fig. 1). The average LS values of 15 patients who were treated with balloon therapy were recorded before and after interventional treatment (LS value = [Reader 1 first + Reader 2 first + Reader 1 second + Reader 2 second] / 4).
Statistical Analysis
All statistical analyses were performed using statistical software (SPSS, v. 20.0, IBM Corp., Armonk, NY; GraphPad Prism 5.0, GraphPad Software, Inc., La Jolla, CA, USA).
The LS values in the three measured segments obtained in the first and second MRE acquisitions were compared using Wilcoxon signed-rank tests. MRE reproducibility was evaluated using the intraclass correlation coefficient (ICC) and 95% Bland-Altman limits of agreement. Agreement between the two readers was assessed using ICCs for each measured segment and each acquisition. An ICC > 0.75 was considered to represent excellent agreement.
Wilcoxon signed-rank tests and Fisher's exact tests were used to compare BCS patients before and after endovascular intervention. The correlation between changes in LS and pressure gradient values before and after treatment was analyzed using Pearson correlation analysis. For all analyses, p < 0.05 was considered significant.
Go to :
RESULTS
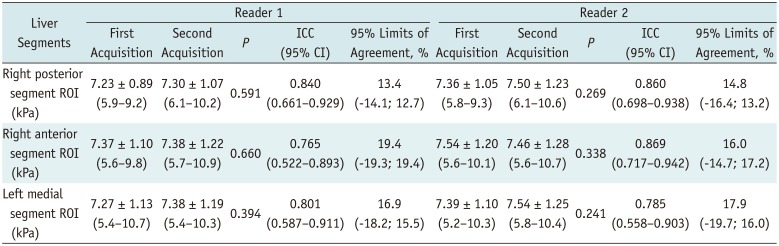
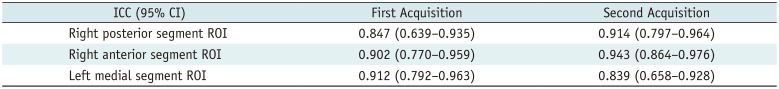
The three segmental LS values of the 23 included study patients ranged from 5.2 kPa to 10.9 kPa, with a mean of 7.39 ± 1.03 kPa. The LS values obtained in the first and second acquisitions are summarized in Table 1. The mean LS values of the 23 patients obtained by the readers before treatment were not significantly different between the two acquisitions for any of the three different segments (p = 0.241–0.660). The agreement for LS measurements between the first and second acquisitions was excellent for all three hepatic segments (ICCs = 0.765–0.869) (Fig. 2). The 95% Bland-Altman limits of agreement ranged from 13.4% to 19.4% (Fig. 3). Inter-reader agreement for LS values was excellent in all measured acquisitions and segments (ICCs = 0.839–0.943) (Table 2).
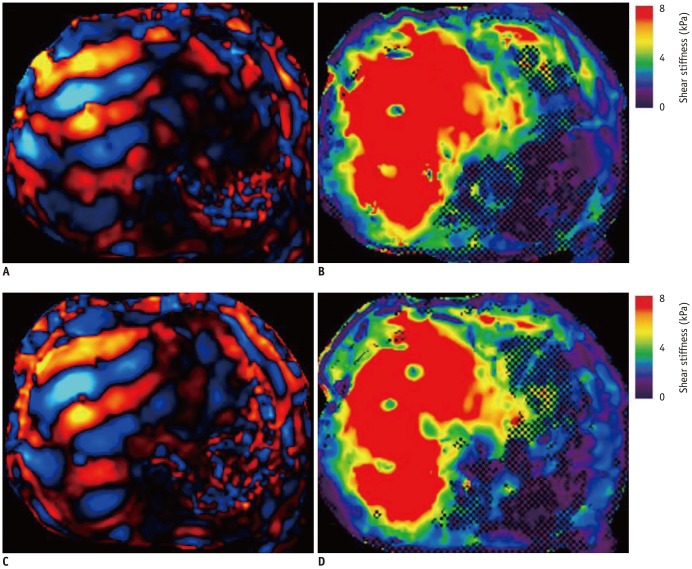 | Fig. 2MRE measurement of LS.Two liver MRE scans were performed to assess reproducibility in patient with BCS. First (A, B) and second (C, D) MRE results are shown. A, C. Wave images. B, D. MREs. There were no significant differences between two elastograms. BCS = Budd-Chiari syndrome, LS = liver stiffness, MRE = magnetic resonance elastography
|
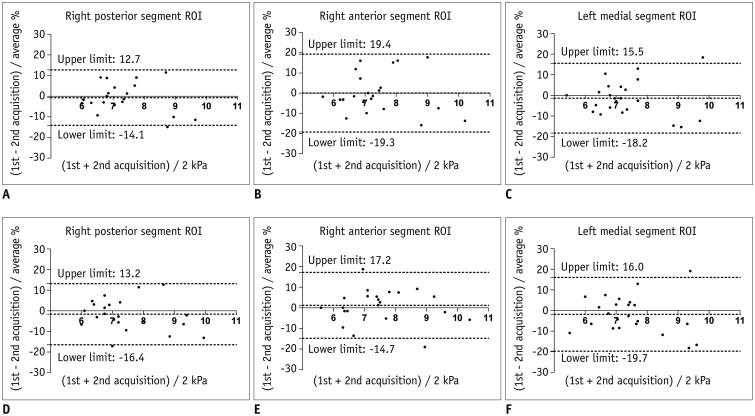 | Fig. 3Bland-Altman analysis between two MRE scans for each reader (A–C, Reader 1; D–F, Reader 2) and for each measured segment.X-axes show means of measured LS values, and Y-axes show differences between LS values as percentage of their mean.
|
Table 1
Distributions of LS Values between First and Second Acquisitions (n = 23)
![]()
Table 2
ICC Comparison between Two Readers (n = 23)
![]()
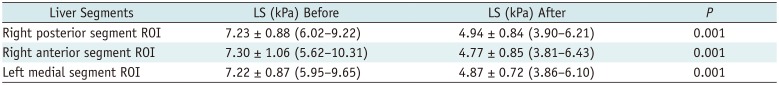
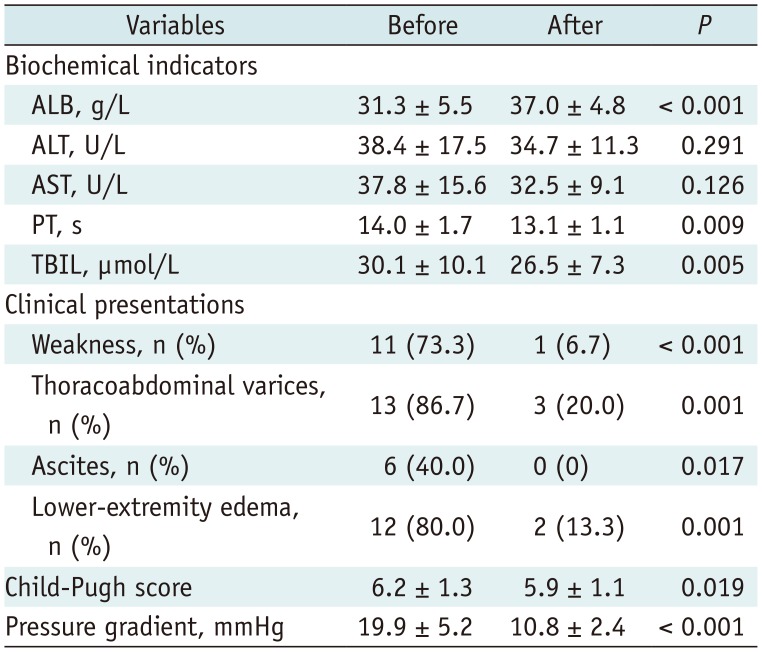
Fifteen patients (65.2%) underwent balloon dilation therapy. Eight patients (34.8%) with stents did not undergo MRE after treatment to prevent the radiofrequency from heating the stent and to avoid imaging artifacts due to stent susceptibility. Among the 15 subjects who underwent balloon dilation therapy, the post-procedural mean LS values were lower than the pre-procedural values for all three hepatic segments: LS of the right posterior segment = 7.23 ± 0.88 kPa (before) vs. 4.94 ± 0.84 kPa (after), LS of the right anterior segment = 7.30 ± 1.06 kPa (before) vs. 4.77 ± 0.85 kPa (after), and LS of the left medial segment = 7.22 ± 0.87 kPa (before) vs. 4.87 ± 0.72 kPa (after) (all p = 0.001) (Table 3). The changes in LS values were statistically significant (p < 0.05) (Figs. 4, 5). There was also a correlation between changes in the LS and pressure gradient before and after treatment (r = 0.651, p = 0.009). The clinical manifestations of all 15 patients significantly improved after therapy (Table 4).
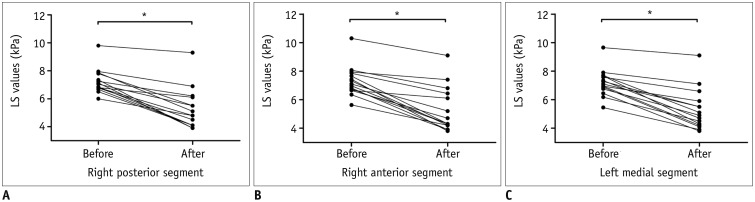 | Fig. 4LS values decreased significantly after intervention in all three segments.
A. Right posterior segment. B. Right anterior segment. C. Left medial segment. *p < 0.05.
|
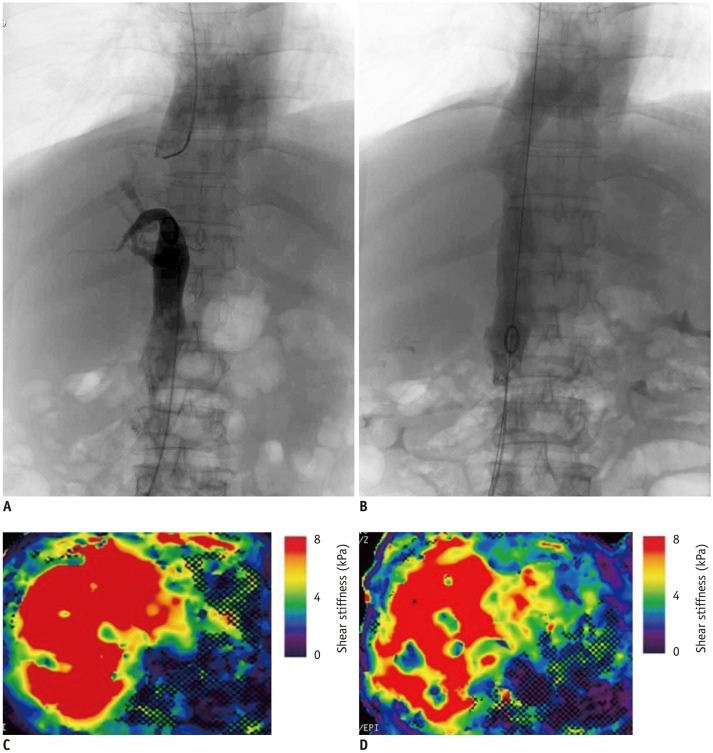 | Fig. 5Changes in digital subtraction angiography (A. before, B. after) and MRE (C. before, D. after) in patient with BCS who underwent interventional treatment.
A. IVC obstruction. B. Free blood flow in IVC after balloon dilation. C, D. Post-procedural LS values (6.17 kPa) were lower than pre-procedural measurements (7.53 kPa). IVC = Inferior vena cava
|
Table 3
Distributions of LS Values Before and After Treatment (n = 15)
![]()
Table 4
Comparison of Clinical Characteristics Before and After Treatment (n = 15)
![]()
Go to :
DISCUSSION
Previous studies have demonstrated that MRE is a useful noninvasive technique for detecting hepatic fibrosis, and LS values can be used to grade fibrosis (131415). Lee et al. (16) reported good repeatability and reproducibility of the LS measurement using MRE. In their study, 94 patients underwent MRE for one of the following reasons: evaluation for hepatocellular carcinoma (n = 26), liver metastases (n = 24), viral hepatitis, or liver cirrhosis (n = 8), routine follow-up for another malignancy (n = 32), and evaluation for other reasons (n = 4). BCS was not specifically mentioned in their study. Primary BCS is a rare disorder caused by thrombosis of the HV or IVC. Hepatic venous outflow obstruction results in congestion and ischemia that can eventually lead to atrophy and fibrosis in BCS (17). In addition, ascites and different types of intra- and extrahepatic collateral circulations are frequently detected in BCS (1819). One study found that massive ascites was an independent factor associated with failure of liver MRE (20). The reliability of LS measurement in BCS was previously unknown. Our results indicate that MRE is a useful tool for evaluating LS in BCS patients with high repeatability and reproducibility.
Endovascular intervention has proved to be more effective than open surgery for the treatment of BCS. Specifically, in patients with membranous IVC occlusion, a single balloon dilation can achieve better results (21). Because endovascular intervention is both minimally invasive and effective, it has been the first choice for BCS treatment (21). The mainstays of BCS therapy include restoring HV outflow tract patency and reducing hepatic congestion. Decreased ascites volume, resolution of hepatomegaly, and significant reduction of the stenotic HV/IVC pressure gradient after intravascular surgery may lead to decreased liver congestion (22). In the present study, the LS values of 15 patients who had undergone balloon dilation decreased after the procedure, probably partially due to an immediate reduction in liver congestion. This finding is consistent with the observations of Mukund et al. (7) who used TE to assess changes in hepatic congestion following endovascular intervention in BCS.
We also found a correlation between changes in LS and pressure gradient before and after treatment, which might indirectly confirm the effect of liver congestion on LS. Clinical manifestations were also significantly improved one month after balloon dilation therapy. Based on our findings and previous studies, we hypothesize that two components affect LS in BCS patients: liver congestion and fibrosis. Therefore, we propose that MRE can be used for follow-up monitoring of these patients after interventional treatment.
Our study has several limitations. First, due to its invasiveness, we did not perform liver biopsies, which might directly confirm the effect of liver congestion on LS. Second, segmental intrahepatic variations might occur in patients with BCS, which might affect precise ROI positioning (7). We measured only the largest area of the liver, and not the left lateral segment, to avoid possible diaphragmatic and cardiac motion artifacts. Third, although inter-examination and inter-reader repeatability were assessed, we did not assess intra-reader repeatability. Furthermore, because we evaluated the short-term reproducibility of LS measurements, our results might overestimate reproducibility. Fourth, due to the variable degree of stenosis of the HV or IVC in each patient, certain individual differences were observed during the evaluation of the effectiveness of its interventional treatment. Moreover, considering the possibility of the radiofrequency heating the stent and the imaging artifacts due to stent susceptibility, we only included patients treated with balloon dilation. The assessment of patients treated with stents should be pursued in future studies.
In conclusion, two examinations in BCS patients showed that MRE-based LS measurements are repeatable. MRE can be used to monitor these patients after interventional treatment.
Go to :
 XML Download