

 PDF
PDF ePub
ePub Citation
 Print
Print


INTRODUCTION
Tumor angiogenesis is the proliferation of blood vessels penetrating into cancerous tumors, and it enables the tumors to grow, progress to invasive cancer, and metastasize (12). From a pathological perspective, intratumoral microvessel density (MVD) is the gold standard for assessing tumor angiogenesis. High MVD is associated with a greater likelihood of metastasis of the invasive carcinoma (3). A meta-analysis of patients with breast carcinoma showed that MVD is related to both relapse-free and overall survival, and that high MVD significantly predicts poor survival in node-negative and node-positive patients (4).
Radiological assessment of tumor angiogenesis would be helpful because it is noninvasive, evaluates the whole tumor, and can be used for monitoring during and after treatment. Ultrasound (US) is a real-time, nonradiative, and convenient imaging modality to evaluate tumor vascularity. Color or power Doppler imaging is a widely available US technique to indirectly evaluate tumor vascularity. Doppler imaging can be adjunctive to B-mode US in differentiating between malignant and benign breast tumors by detecting malignant Doppler signs, such as hypervascularity, central vascularity, and penetrating vessels (567). However, because of the limitations in evaluating microvessels, there is a significant overlap in Doppler features between benign and malignant tumors (8). The loss of Doppler signals from microvessels explains the inconsistent correlations between Doppler signals and MVD (910).
The recently developed US microflow imaging methods can overcome these limitations. Superb Microvascular Imaging (SMI) eliminates the clutter, preserves low-velocity flow signals, and has improved sensitivity to microvessels within tumors. SMI has superior capabilities for detecting more microvessels and characterizing their morphological details (1112131415). Contrast-enhanced US (CEUS), using microbubble contrast agents, is another useful approach for evaluating tumor microflow. Within the vasculature, US contrast agents produce marked amplification of the flow signals and provide microvascular information (16). CEUS improves the diagnostic performance of B-mode US (17181920), but is not used routinely because of the need for intravenous contrast injection and a lack of consensus about the acquisition technique and interpretation method (21).
Although previous investigations have suggested the superiority of these two vascular techniques in evaluating microvessels of breast cancers, their real clinical benefit should be further evaluated by investigating whether these techniques can provide additional information in diagnosing breast cancer or selecting the lesions requiring tissue confirmation. In addition, the vascular characteristics on SMI and CEUS should be verified histologically through correlation with MVD and other histologic prognostic markers.
The purpose of this prospective study was to investigate the effect of US microflow assessment using SMI and CEUS in distinguishing malignant from benign solid breast masses as well as the association between quantitative and qualitative US vascular parameters and histologic MVD.
Go to : 
MATERIALS AND METHODS
Patients
This study was approved by our Institutional Review Board. Signed informed consent was obtained from all patients. Between January and October 2016, 165 patients were scheduled to undergo US-guided biopsy for suspicious breast masses assessed as category 4 or 5 according to the Breast Imaging Reporting and Data System (BI-RADS) (22). Fifty-nine patients were excluded for the following reasons: ipsilateral breast excision or radiation therapy within 2 years (n = 32); contraindications for US contrast agents, such as pregnancy, severe hypertension, coronary artery disease, dobutamine medication, or drug hypersensitivity (n = 20); or refusal to participate (n = 12). Finally, 101 patients participated in this research.
If a patient had multiple suspicious masses, the single most suspicious mass was selected as a representative lesion and was studied using SMI and CEUS before biopsy. Three patients were excluded because of inadequate image quality. Finally, 98 masses (mean size, 18.7 mm; range, 6–61 mm) in 98 women (mean age, 45.6 years; range, 20–76 years) were included. Fifty-four of the 98 patients had clinical symptoms: palpable lump (n = 42), pain (n = 9), and bloody nipple discharge (n = 3).
US Analysis
US imaging was performed using the Aplio 500 system (Canon Medical Systems Corp., Tokyo, Japan) with a 5- to 14-MHz linear transducer by one radiologist with 18 years of experience in breast imaging. After a target mass was identified on B-mode US, color-mode SMI was performed before the biopsy. Table 1 summarizes the morphologic characteristics and final assessment categories on B-mode US of 98 masses according to the BI-RADS, 5th edition (22). Vascular images were obtained from the region of interest (ROI), and the image parameters for SMI were as follows: velocity scale < 3 cm/sec; dynamic range, 21 dB; and frame rate, 27–60 frames/sec. The plane with the richest vessels was selected as the representative image for evaluation.
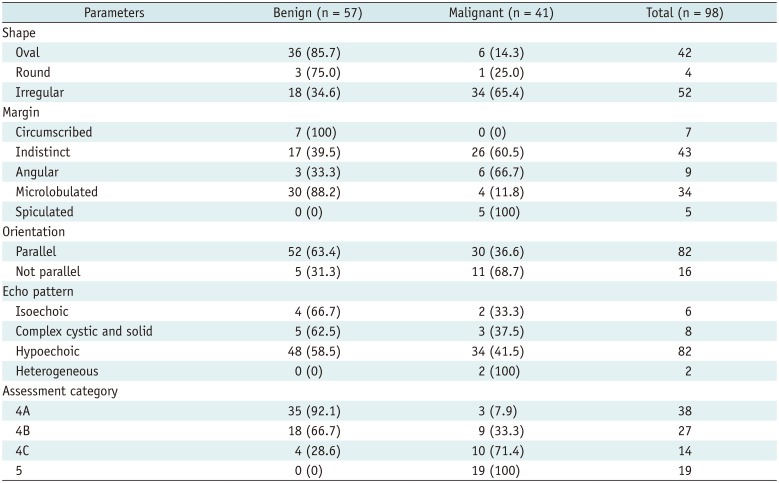
Table 1
Morphologic Characteristics and Assessment Category on B-Mode US
![]()
CEUS examination was performed using the SonoVue contrast agent (Bracco S.p.A. Milan, Italy) immediately after SMI. The CEUS image parameters were as follows: mechanical index, 0.08; frame rate, 10 frames/sec; gain, 80; and dynamic range, 65 dB. The contrast agent was mixed with 5 mL of saline and injected via a cubital vein in a bolus fashion. First, 3.6 mL of the contrast agent was administered, and continuous scanning was performed for 2 minutes to acquire the video clip for the time-intensity curve analysis. After an 8-minute wait from the first contrast injection, 1.2 mL of the contrast agent was administered, and the video clip was recorded for 1 minute (172324). Twenty milliliters of saline was administered after each injection of the contrast agent. In total, the CEUS examination lasted approximately 15 minutes from patient preparation to image acquisition. After image acquisition, US-guided core needle biopsy with a 14-gauge automated gun system (Max-Core gun; Bard, Covington, GA, USA) (n = 90) or a 9- or 12-gauge vacuum-assisted biopsy (ATEC, Hologic Inc., Marlborough, MA, USA) (n = 8) was performed on the same day. The tissue biopsy site was selected in areas with the richest blood vessels to match the SMI and CEUS planes.
The images acquired using SMI and CEUS were analyzed, in consensus, by two radiologists with 12 and 5 years of experience, respectively, in breast imaging. The readers were blinded to the clinical symptoms, histopathological findings, and other vascular imaging features (SMI or CEUS). The readers first assessed the SMI images and then CEUS images. The time interval between the two analyses was 2 months. If there was a disagreement, another radiologist with 18 years of experience in breast imaging reviewed the image until consensus was achieved.
For the SMI images, we evaluated the vascular index as a quantitative parameter, and vessel morphology, distribution, and the presence of penetrating vessels as qualitative parameters. The vascular index (%) indicates the ratio between the pixels for the Doppler signal and those for the whole lesion, calculated using a dedicated software (VI test app, Canon Medical Systems Corp.) (Fig. 1). Vessel morphology was categorized as simple (dot-like or linear) or complex (branching or shunting). Vessel distribution was categorized as peripheral (all vessels located at the margin) or central (any vessel detected within the lesion).
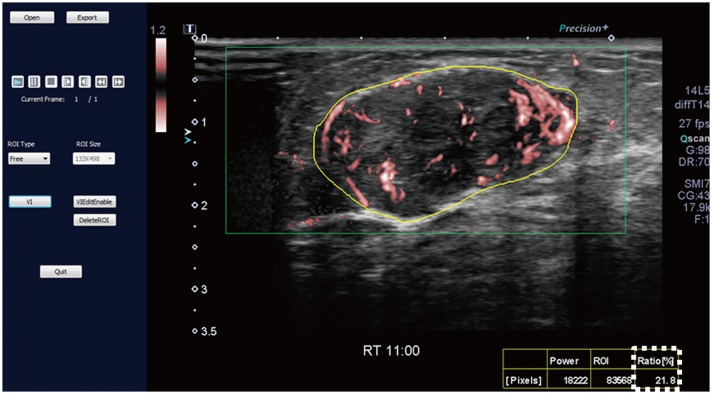 | Fig. 1SMI image and measurement of vascular index.SMI image is opened in dedicated software (VI test app, Canon Medical Systems Corp.) to measure vascular index. Setting yellow-free ROI along boundary of lesion causes vascular index (box outlined by dotted line) to be automatically calculated. Vascular index (%) indicates ratio between pixels for Doppler signal and those for total lesion. ROI = region of interest, SMI = Superb Microvascular Imaging
|
For the CEUS video clips, the enhancement patterns were evaluated as qualitative parameters, and the time-intensity curve was analyzed as the quantitative parameter (1724). Qualitative parameters were categorized as follows: enhancement degree (hyper-, iso-, or hypo-enhancement), enhancement order (centripetal, centrifugal, or diffuse), enhancement margin (circumscribed or noncircumscribed), internal homogeneity (homogeneous or heterogeneous), and the presence of penetrating vessels and perfusion defects. The quantitative parameters of the time-intensity curve were obtained using a built-in software (25). The ROI was selected in the area of the strongest enhancement, and its size was set to the default value of 3 (mean, 6.9 ± 0.3 mm2; range, 5.6–7.5 mm2). The quantitative parameters were categorized as follows: peak intensity (× 10−5 arbitrary units [AU]), the maximum intensity of the time-intensity curve; time to peak (second), the time needed to reach the peak intensity; mean transit time (second), the time when the intensity is higher than the mean value; slope (× 10−5 AU/sec), the maximum wash-in velocity of the contrast agent; area under the curve (× 10−5 AU·sec), integral value of the curve associated with the total blood volume and the sum of the area wash-in and area wash-out (Fig. 2). Quantitative analysis was performed three times for each lesion, and the mean value of each parameter was used as the final value. The first contrast injection images were mainly used to evaluate the quantitative and qualitative parameters. The secondary contrast injection images were analyzed when it was difficult to determine the qualitative parameters because of extremely fast contrast filling in the first contrast injection images.
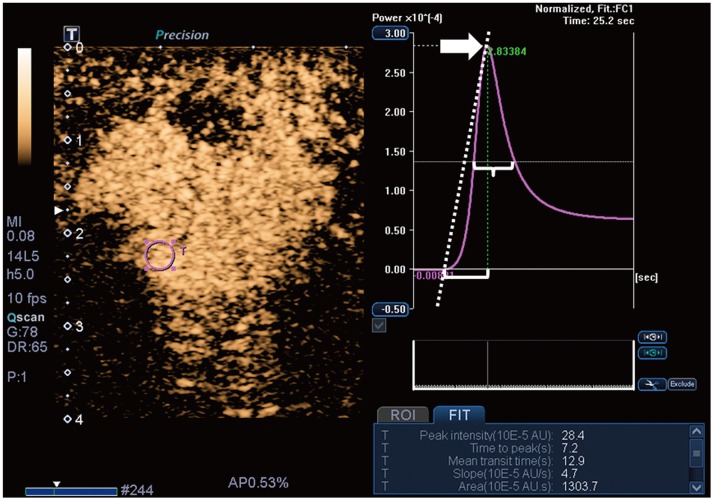 | Fig. 2CEUS image and time-intensity curve analysis.Time-intensity curve analysis of CEUS video clip was performed using built-in software. Setting ROI (pink circle) in area of strongest enhancement causes following quantitative parameters to be automatically calculated: peak intensity (arrow), time to peak (bracket), mean transit time (brace), slope (dotted diagonal line), and area under curve. AU = arbitrary units, CEUS = contrast-enhanced ultrasound
|
Histologic Analysis
Histologic examination was performed by a pathologist who had 17 years of experience in breast pathology. MVD of the breast masses was assessed by immunostaining using a mouse monoclonal CD34 antibody (QBEnd-10, Dako, Agilent Technolgies Inc., Santa Clara, CA, USA). First, each slice of the breast mass sections was examined at low magnification (× 10) to identify the three most vascularized areas or “hot spots” (Eclipse Ni microscope, Nikon, Tokyo, Japan). Second, the microvessels were counted under high magnification (× 200), and the mean counts of the three areas were recorded as MVD.
Histologic diagnoses of the breast masses were performed according to the World Health Organization's classification (26). In invasive ductal carcinomas, the immunohistochemical staining results of biomarkers, including estrogen receptor (ER), progesterone receptor (PR), human epidermal growth factor receptor 2 (HER2), and Ki67, were evaluated. The Allred scoring system was used to assess ER and PR, with a score of more than 2 points being considered positive (27). HER2 expression was considered positive when membrane 3+ HER2 staining was observed on immunohistochemistry or membrane 2+ HER2 staining with HER2 gene amplification was observed on silver in situ hybridization. Ki67 expression of 14% or more was considered positive.
Statistical Analysis
To compare the US vascular parameters of SMI and CEUS between benign and malignant masses, the t- or Mann-Whitney test and the chi-square or Fisher's exact test were used. Subgroup analysis was performed according to lesion size (< 10 mm or ≥ 10 mm). The diagnostic performance of SMI and CEUS was obtained using the receiver operating characteristic (ROC) curve analysis with logistic regression analysis. We obtained the optimum cutoff value for quantitative parameters by using the ROC curve analysis with Youden's index. We re-assessed BI-RADS category 4A masses by adding significant vascular parameters on SMI or CEUS suggestive of a benign nature to evaluate whether the corresponding parameter could be used to downgrade overvalued masses and reduce unnecessary biopsy. We compared the diagnostic performance between the original BI-RADS assessment and BI-RADS assessment plus vascular parameters by using the pairwise comparison of ROC curves. For the evaluation of diagnostic performance, category 3 masses were considered test negative and category 4A or higher masses were considered test positive.
We analyzed the association between histologic MVD and US vascular parameters with a significant difference between benign and malignant masses by using the Mann-Whitney test for qualitative parameters and Spearman's correlation for quantitative parameters. To assess the correlation of MVD with the histologic biomarkers in invasive ductal carcinoma, the t- or Mann-Whitney test was used. P values less than 0.05 were considered statistically significant. Statistical analyses were performed using IBM SPSS Statistics for Windows, Version 20.0 (IBM Corp., Armonk, NY, USA).
Go to :
RESULTS
Histologic Diagnoses
Final histopathological diagnoses revealed 57 benign and 41 malignant masses. Table 2 shows the detailed histopathological results. For the 41 malignant masses, either breast-conserving surgery or modified radical mastectomy was performed. Among the 57 benign masses, 16 were removed surgically or via US-guided vacuum-assisted excision, and 41 were followed up with US for 492–755 days (mean, 617 days) and were found stable.
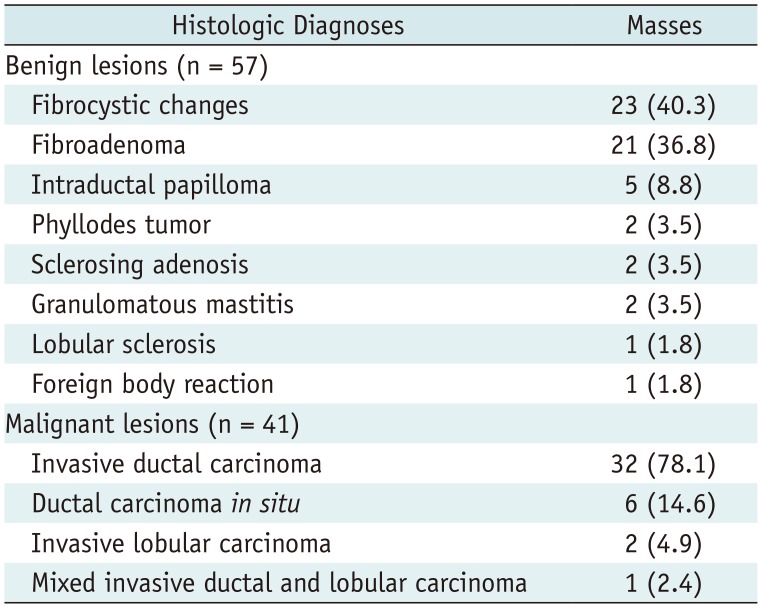
Table 2
Histologic Diagnoses
![]()
Comparison of SMI and CEUS Parameters between Benign and Malignant Masses
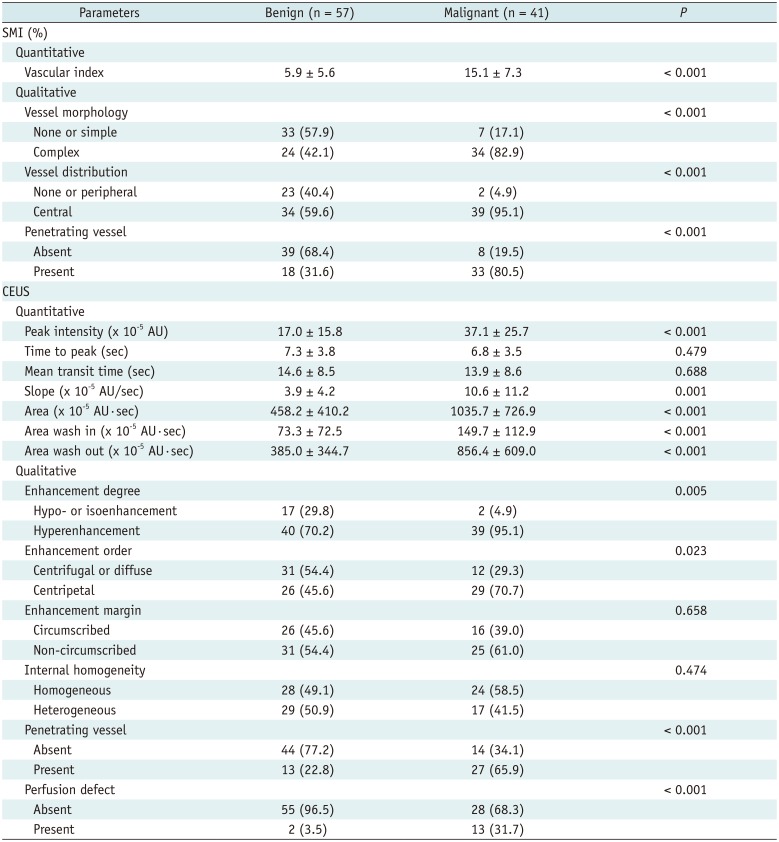
For SMI, malignant masses exhibited a higher vascular index (15.1 ± 7.3 vs. 5.9 ± 5.6) and more frequent complex vessel morphology (82.9% vs. 42.1%), central vascularity (95.1% vs. 59.6%), and penetrating vessels (80.5% vs. 31.6%) (all, p < 0.001). For CEUS, malignant masses exhibited higher peak intensity (37.1 ± 25.7 vs. 17.0 ± 15.8, p < 0.001), larger slope (10.6 ± 11.2 vs. 3.9 ± 4.2, p = 0.001) and area (1035.7 ± 726.9 vs. 458.2 ± 410.2, p < 0.001), and more frequent hyperenhancement (95.1% vs. 70.2%, p = 0.005), centripetal enhancement (70.7% vs. 45.6%, p = 0.023), penetrating vessels (65.9% vs. 22.8%, p < 0.001), and perfusion defects (31.7% vs. 3.5%, p < 0.001). The rest of the CEUS parameters did not differ between benign and malignant masses (Table 3). Figures 3 and 4 list the imaging findings for malignant and benign tumors, respectively.
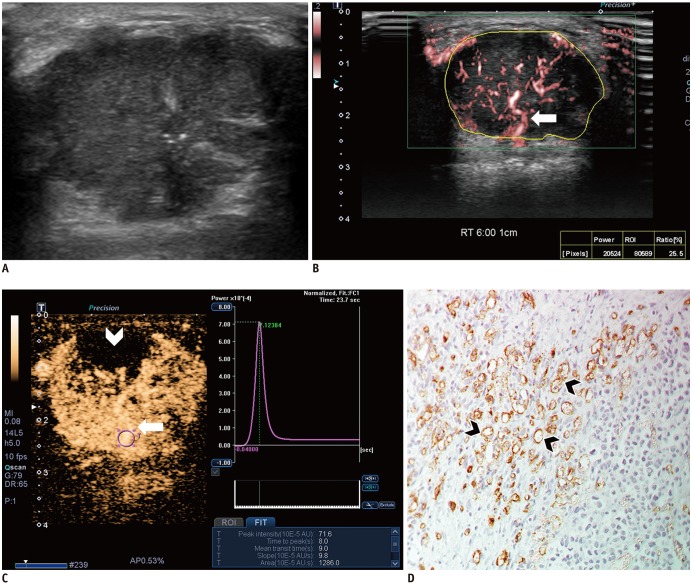 | Fig. 3Images from 44-year-old woman with invasive ductal carcinoma.
A. B-mode image shows 29-mm, irregular, indistinct, hypoechoic mass with internal microcalcifications, which is assessed as BI-RADS category 4C. B. SMI image shows penetrating vessel (arrow) and branching vessels. Vascular index is 25.5%. C. CEUS image shows hyperenhancement of lesion with penetrating vessel (arrow) and perfusion defect (arrowhead). Time-intensity curve shows strong and fast enhancement: peak intensity, 71.6 × 10⁻⁵ AU; slope, 9.8 × 10⁻⁵ AU/sec; and area under curve, 1286 × 10−5 AU·sec. D. Microvessels (arrowheads) are assessed via immunohistochemical staining with CD34, and mass shows high MVD, 69.3 (× 200 magnification). BI-RADS = Breast Imaging Reporting and Data System, MVD = microvessel density
|
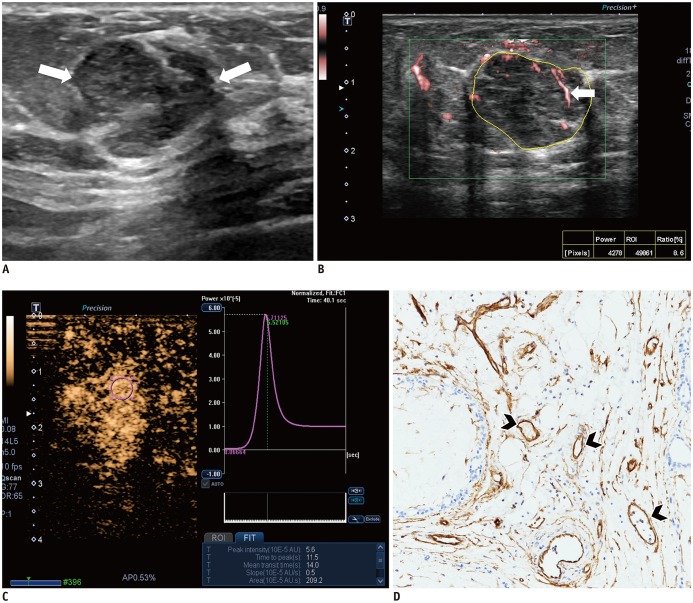 | Fig. 4Images from 54-year-old woman with fibroadenoma.
A. B-mode image shows 16-mm, irregular, indistinct, hypoechoic mass, which is assessed as BI-RADS category 4B (arrows). B. SMI image shows dot-like or linear vessels (arrow). Vascular index is 8.6%. C. CEUS image shows hyperenhancement of lesion without penetrating vessel or perfusion defect. Time-intensity curve shows slow and weak enhancement: peak intensity, 5.6 × 10⁻⁵ AU; slope, 0.5 × 10⁻⁵ AU/sec; and area under curve, 209.2 × 10⁻⁵ AU·sec. D. Microvessels (arrowheads) are assessed via immunohistochemical staining with CD34, and mass shows low MVD, 15.0 (× 200 magnification).
|
Table 3
Comparison of SMI and CEUS Parameters between Benign and Malignant Masses
![]()
Lesions measuring < 10 mm included 19 masses (13 benign and 6 malignant), and those measuring ≥ 10 mm included 79 masses (44 benign and 35 malignant). Subgroup analysis of the lesions measuring < 10 mm showed that central vascularity on SMI was the only significant difference between benign and malignant masses (38.5% vs. 100%, p = 0.018). Although the vascular index tended to be higher for malignant masses than for benign masses (11.7 ± 2.0 vs. 5.7 ± 1.5, respectively, p = 0.064), this difference was not significant. The other parameters for SMI and CEUS did not differ between benign and malignant masses (all p > 0.05).
Subgroup analysis of the lesions measuring ≥ 10 mm showed results similar to those for entire lesions. Malignant masses exhibited a higher vascular index (15.7 ± 7.6 vs. 6.0 ± 5.7, p < 0.001), more frequent complex vessel morphology (85.7% vs. 20.5%, p < 0.001), central vascularity (94.3% vs. 65.9%, p = 0.002), and penetrating vessels (85.7% vs. 31.8%, p < 0.001) on SMI, and higher peak intensity (40.2 ± 25.8 vs. 18.3 ± 16.6, p < 0.001), larger slope (11.6 ± 11.7 vs. 3.9 ± 4.3, p = 0.001) and area (1139.5 ± 732.0 vs. 496.9 ± 420.3, p < 0.001), more frequent hyperenhancement (97.1% vs. 75.0%, p = 0.009), centripetal enhancement (71.4% vs. 38.6%, p = 0.006), penetrating vessels (68.6% vs. 15.9%, p < 0.001), and perfusion defects (34.3% vs. 4.5%, p = 0.001) on CEUS.
Diagnostic Performance of SMI and CEUS
The diagnostic performance of SMI and CEUS using the parameters showing significant differences between benign and malignant masses indicated no statistical difference: sensitivity (78.1% vs. 65.9%, p = 0.166), specificity (75.4% vs. 86.0%, p = 0.109), positive predictive value (PPV) (69.6% vs. 77.1%, p = 0.283), negative predictive value (82.7% vs. 77.8%, p = 0.338), and the area under the ROC curve (AUC) (0.853 vs. 0.841, p = 0.803) (Table 4).
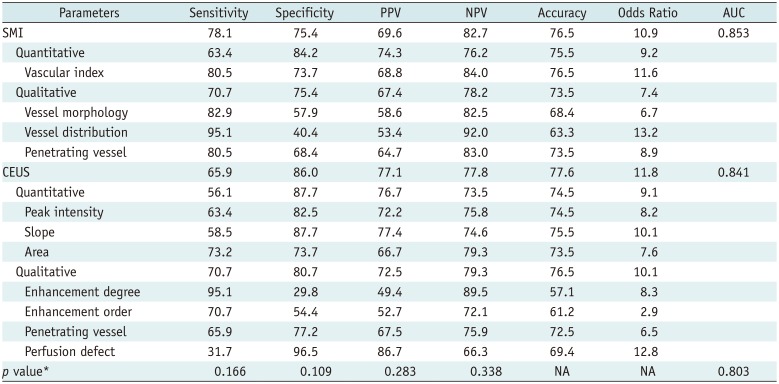
Table 4
Diagnostic Performance of SMI and CEUS in Distinguishing Malignant from Benign Masses
![]()
The optimal cutoff values for the quantitative parameters of SMI and CEUS were as follows: vascular index on SMI, 8.9 (80.5% sensitivity, 73.7% specificity, and 0.844 AUC); peak intensity on CEUS, 27.0 (63.3% sensitivity, 82.5% specificity, and 0.765 AUC); slope on CEUS, 7.1 (58.5% sensitivity, 87.7% specificity, and 0.749 AUC); and area on CEUS, 583.4 (73.2% sensitivity, 73.7% specificity, and 0.776 AUC).
Effect of the Vascular Parameters of SMI and CEUS on Downgrading BI-RADS Category 4A Masses
Table 5 shows the number of downgraded masses and diagnostic performance when adding a single vascular parameter or a combination of several parameters of SMI or CEUS on B-mode US. The SMI parameter showing the largest number of downgraded masses without missing the cancer was the vascular index (26 downgraded masses), and the corresponding CEUS parameter was enhancement degree (8 downgraded masses). Upon adding all the SMI parameters for conservative assessment, unnecessary biopsies could be avoided in 12 masses with improved PPV for biopsy recommendations (47.7% vs. 41.8%) and AUC (0.605 vs. 0.500, p < 0.001) without loss of sensitivity (100%) compared to the original BI-RADS assessment. Upon adding all the CEUS parameters, unnecessary biopsies could be avoided in five masses with improved PPV for biopsy recommendation (44.1% vs. 41.8%) and AUC (0.544 vs. 0.500, p = 0.020).
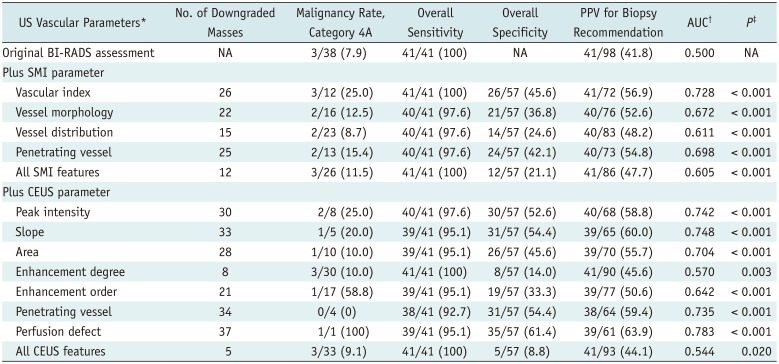
Table 5
Effect of Downgrading BI-RADS Category 4A Masses on Basis of Benign Vascular Parameters of SMI and CEUS
Data are expressed as numbers (%). *Following benign vascular features were used in downgrading mass assessed as BI-RADS category 4A (n = 38) to category 3: vascular index < 8.9, none or simple vessel morphology, none or peripheral vessel distribution, absence of penetrating vessel on SMI, and peak intensity < 27.0, slope < 7.1, area < 583.4, hypo- or isoenhancement, centrifugal or diffuse enhancement, absence of penetrating vessel or perfusion defect on CEUS, †For evaluation of AUC, category 3 masses were considered ‘test negative’ and category 4A or higher masses were considered ‘test positive’, ‡p value was that to null hypothesis that there is no change in AUC with addition of vascular parameter (pairwise comparison of ROC curve).
![]()
Association between US Vascular Parameters and MVD
All qualitative US parameters with significant differences between benign and malignant masses had significant differences in MVD (all, p ≤ 0.016) (Table 6). Masses with complex vessel morphology, central distribution, and penetrating vessels on SMI (all, p < 0.001), and hyperenhancement (p = 0.016), centripetal enhancement (p = 0.007), penetrating vessels (p < 0.001), and perfusion defect (p < 0.001) on CEUS had higher MVD.
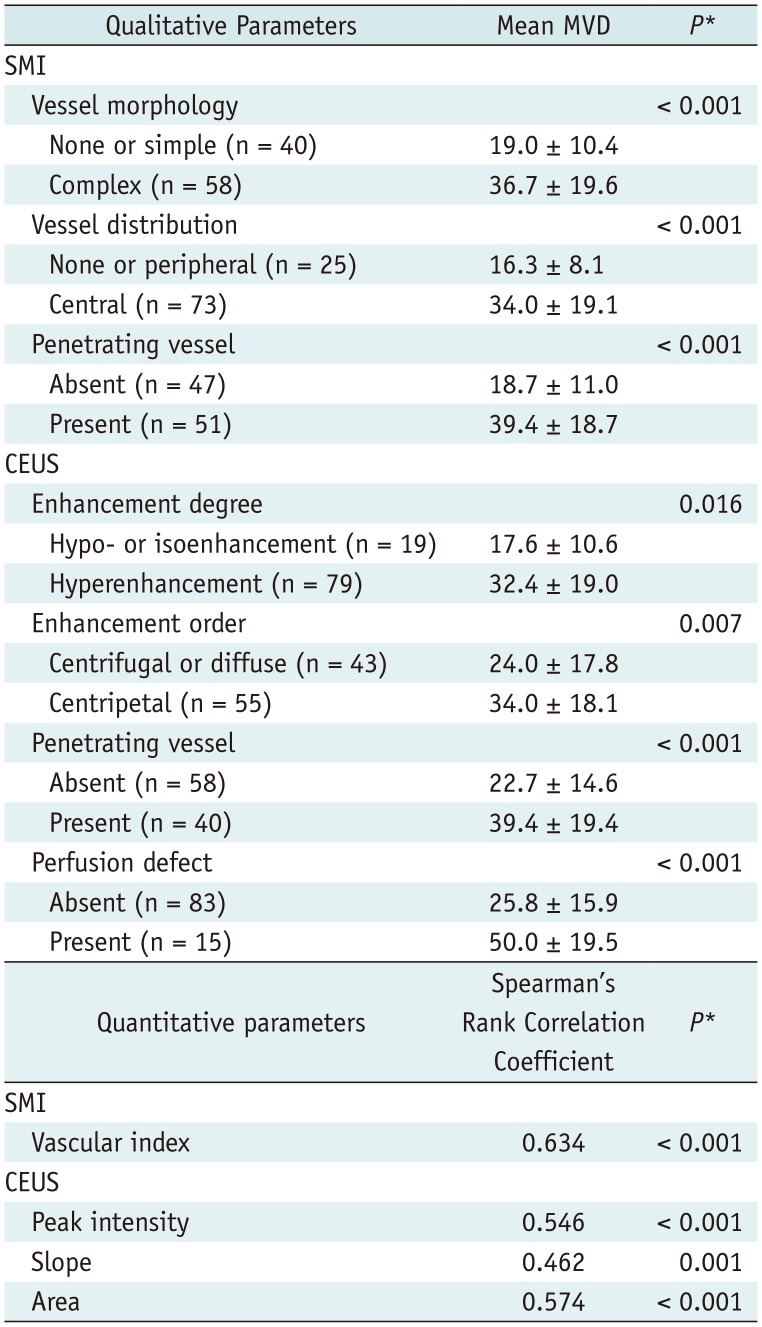
Table 6
Association between US Vascular Parameters and MVD
| Quantitative parameters | Spearman's Rank Correlation Coefficient | P* |
|---|---|---|
| SMI | ||
| Vascular index | 0.634 | < 0.001 |
| CEUS | ||
| Peak intensity | 0.546 | < 0.001 |
| Slope | 0.462 | 0.001 |
| Area | 0.574 | < 0.001 |
![]()
Quantitative US parameters with significant differences between benign and malignant masses were statistically correlated with MVD (all, p ≤ 0.001) (Table 6). Spearman's rank correlation coefficient for the vascular index on SMI was 0.634, indicating a strong correlation. The coefficients for quantitative parameters of CEUS ranged from 0.462 to 0.574, indicating a moderate correlation.
The mean MVD of the breast masses was 25.7 (range, 5.7–88.0), and the mean MVD of malignant masses was significantly higher than that of benign masses (46.1 vs. 17.5, p < 0.001). Table 7 shows the correlation of MVD with histologic biomarkers in 32 invasive ductal carcinomas. Invasive ductal carcinomas testing negative for ER or positive for Ki67 had higher MVD than did those testing positive for ER or negative for Ki67, and these differences were statistically significant (p < 0.05).
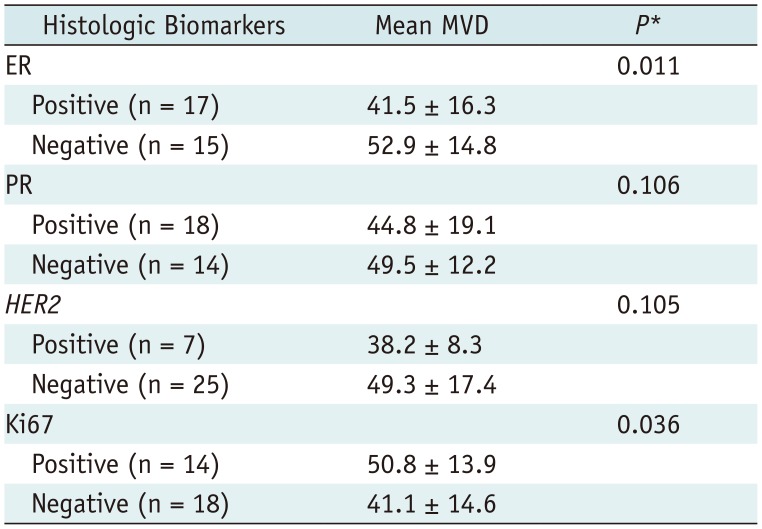
Table 7
Correlation of MVD with Histologic Biomarkers in 32 Invasive Ductal Carcinomas
![]()
Go to :
DISCUSSION
SMI and CEUS are advanced US techniques for detecting microflow. Investigators have reported that SMI can detect more flow signals or penetrating vessels within tumors than does conventional color or power Doppler US and can thereby improve the diagnostic performance in discriminating malignant from benign breast tumors (1112131415). Our results show that SMI features, including hypervascularity, branching or shunting vessels, central vascularity, and penetrating vessels, can be helpful for discriminating breast cancer from benign tumors. This study is different from previous ones in that it objectively assessed the degree of tumor vascularity by using the vascular index, instead of counting the number of vessels or subjective vascular grading. The vascular index showed a strong association with MVD (r = 0.634) and higher sensitivity with the use of a cutoff value of 8.9% in diagnosing malignancy than did any of the quantitative parameters of CEUS (80.5% vs. 58.5–73.2%). We think that the vascular index can be used as a single useful quantitative index of tumor blood flow.
Recent studies have reported that the CEUS features of malignant masses, including heterogeneous enhancement, centripetal enhancement, penetrating vessels, perfusion defects, and fast and strong enhancement, can be helpful in diagnosing breast cancer (171824). This study also found that breast cancer tends to exhibit these vascular characteristics. In addition, our results demonstrated that significant CEUS parameters between benign and malignant breast masses were associated with MVD. Pitre-Champagnat et al. (28) and Du et al. (29) reported that the peak intensity and area on CEUS were significantly correlated with MVD in animal and human models. Since the peak intensity and area reflect the blood volume passing through the ROI, it is considered to be correlated with MVD, and our study showed the same result. As quantitative parameters vary according to the US device manufacturers, time-intensity curve analysis software, ROI settings, and image interpreters, further research using CEUS is needed in more patients.
Xiao et al. (30) compared the diagnostic performance between CEUS and SMI by using qualitative morphological features and found no difference between the two microflow imaging modalities (p = 0.129). The current study applied more variable and detailed imaging parameters, including both qualitative and quantitative parameters. We also observed that SMI and CEUS have similar capabilities for distinguishing breast cancer from benign tumors. Considering that SMI is a convenient and noninvasive technique with no need for post-processing and contrast injection, we suggest that SMI is a useful vascular imaging alternative to CEUS.
We also performed subgroup analysis according to the lesion size because tumor size is associated with tumor vascularity and small tumors might account for the overlap in Doppler features between benign and malignant lesions (631). In 19 small masses measuring < 10 mm, most SMI and CEUS parameters did not differ between benign and malignant tumors, except for frequent central vascularity in malignant tumors on SMI. In contrast, in 79 masses measuring ≥ 10 mm, the results were consistent with those of entire masses. This suggests that SMI and CEUS still have limitations in reflecting tumor angiogenesis in subcentimeter-sized lesions. This finding contradicts that of Miyamoto et al. (32), who reported that CEUS can improve the diagnostic performance of US, even in subcentimeter-sized lesions. However, it is impressive that central vascularity on SMI was associated with breast malignancy. We presume that SMI can demonstrate the process of tumor angiogenesis-vessel proliferation into the cancer. The mean vascular index of malignant masses was about two times that of benign masses, but there was no statistical significance. However, the number of breast masses was too small in this study. Therefore, larger studies on subcentimeter-sized breast lesions are warranted.
Breast radiologists always show hesitation when evaluating low-suspicion lesions and determining the need for tissue confirmation. Previous investigations reported that adding elastography or elastography plus Doppler US on B-mode US can increase the specificity and PPV for biopsy recommendation without the loss of sensitivity (3334). However, conventional Doppler techniques alone do not have enough capability to affect the therapeutic decision. Therefore, we investigated whether advanced vascular imaging techniques such as SMI or CEUS can help select breast lesions that require tissue confirmation without the loss of sensitivity. Our results suggest that BI-RADS category 4A masses without any suspicious vascular feature on SMI or CEUS can be carefully downgraded to category 3. However, our study included only a small number of category 4A masses. To validate these results, further large-scale studies covering benign or probably benign lesions as well as suspicious lesions should be performed.
In addition, we found that the US parameters of SMI and CEUS were associated with histologic MVD, and invasive cancers testing negative for ER or positive for Ki67 had higher MVD. Therefore, the US vascular parameters of SMI and CEUS may be used to predict tumor aggressiveness.
This study had some limitations. First, the study population was relatively small and all breast masses were BI-RADS category 4 or 5. The exclusion of BI-RADS category 2 or 3 breast masses may have caused a selection bias. However, all patients were prospectively and consecutively enrolled, and the number of benign and malignant tumors was balanced. Second, all US examinations were performed by one breast radiologist, and the reproducibility of SMI and CEUS for evaluating breast tumor vascularity was not elucidated. Lastly, this study was restricted to the particular microflow imaging provided by a single US equipment. To improve the generalizability of the results of this study, similar investigations should be attempted using various microflow techniques.
In conclusion, microflow assessment using SMI and CEUS is valuable in distinguishing malignant from benign solid breast masses, with equivalent diagnostic performance. Furthermore, the additional use of SMI or CEUS on B-mode US can reduce unnecessary biopsy of benign masses without the loss of sensitivity. In addition, both quantitative and qualitative US vascular parameters associated with malignancy showed higher histologic MVD. Therefore, US vascular parameters may be used to predict tumor angiogenesis in the preintervention period. Considering the advantages of simple image acquisition and reliable image interpretation, SMI is a feasible microflow technique for breast masses, without the need for contrast injection.
Go to :
 XML Download