Journal List > Korean J Radiol > v.20(5) > 1120260

Choi, Han, Ko, Bae, Ko, Song, Kwon, Shin, and Hahn: Effect of a Deep Learning Framework-Based Computer-Aided Diagnosis System on the Diagnostic Performance of Radiologists in Differentiating between Malignant and Benign Masses on Breast Ultrasonography

Abstract

Objective

To investigate whether a computer-aided diagnosis (CAD) system based on a deep learning framework (deep learning-based CAD) improves the diagnostic performance of radiologists in differentiating between malignant and benign masses on breast ultrasound (US).

Materials and Methods

B-mode US images were prospectively obtained for 253 breast masses (173 benign, 80 malignant) in 226 consecutive patients. Breast mass US findings were retrospectively analyzed by deep learning-based CAD and four radiologists. In predicting malignancy, the CAD results were dichotomized (possibly benign vs. possibly malignant). The radiologists independently assessed Breast Imaging Reporting and Data System final assessments for two datasets (US images alone or with CAD). For each dataset, the radiologists' final assessments were classified as positive (category 4a or higher) and negative (category 3 or lower). The diagnostic performances of the radiologists for the two datasets (US alone vs. US with CAD) were compared.

Results

When the CAD results were added to the US images, the radiologists showed significant improvement in specificity (range of all radiologists for US alone vs. US with CAD: 72.8–92.5% vs. 82.1–93.1%; p < 0.001), accuracy (77.9–88.9% vs. 86.2–90.9%; p = 0.038), and positive predictive value (PPV) (60.2–83.3% vs. 70.4–85.2%; p = 0.001). However, there were no significant changes in sensitivity (81.3–88.8% vs. 86.3–95.0%; p = 0.120) and negative predictive value (91.4–93.5% vs. 92.9–97.3%; p = 0.259).

Conclusion

Deep learning-based CAD could improve radiologists' diagnostic performance by increasing their specificity, accuracy, and PPV in differentiating between malignant and benign masses on breast US.

INTRODUCTION

Ultrasound (US) is an important non-radiating imaging method for the detection and characterization of breast masses, which is well tolerated by patients and easily integrated into interventional procedures for patient treatment (1234). However, breast US has an inherent limitation of being operator dependent, which means that differences between operators in their knowledge and understanding of various breast US techniques lead to interobserver variability in the diagnosis of breast masses (35). The Breast Imaging Reporting and Data System (BI-RADS) for breast US counteracts these limitations by providing standardized terms that describe breast mass features and assessments as well as further recommendations for breast masses (6). Moreover, the BI-RADS has been proven to be an effective system in differentiating between benign and malignant masses (78). However, many BI-RADS US descriptors are found in both malignant and benign masses, and this issue is especially common with category 4 masses. Thus, category 4 breast masses have a wide range of malignancy risk (3–94%) (69), and their classification into subcategories 4a, 4b, and 4c is poorly reproducible among radiologists (10). To date, there has been no specific US descriptor that accurately predicts the risk of malignancy in breast masses (1011).
Computer-aided diagnosis (CAD) is a computerized procedure that provides a second objective opinion to assist radiologists' image interpretation and diagnosis (12). To increase diagnostic accuracy and decrease interobserver variability, CAD systems for breast US have been applied to differentiate between malignant and benign masses (1314151617). Previous studies have shown that several breast US CAD systems had excellent diagnostic performance with a receiver operating characteristic (ROC) area under the curve (AUC) of approximately 0.9 for differentiating between benign and malignant masses (131416). Moreover, these systems decreased interobserver variability in biopsy recommendations (15). These studies used conventional CAD systems developed by individual research teams. Conventional CAD processes consist of feature extraction, selection, and classification (18192021). When adjusting the overall performance of conventional CAD, the most important issue is effective feature extraction, which can potentially alleviate the burden of feature selection and classification (1921). However, the extraction of meaningful features is a complex and time-consuming task requiring many image processing steps (21), which makes fine-tuning the overall performance of conventional CAD more difficult.
Currently, deep learning techniques are considered to be the most advanced technology for image classification (2223). The main benefit of deep learning techniques is that they reduce the burden of feature selection and classification by generating a set of transformation functions and image features directly from the data (21). Deep learning techniques have been applied in radiology with promising results (242526). A recent study applied deep learning techniques to CAD for breast lesions on US as well as lung nodules on computed tomography, and showed that CAD with deep learning techniques (deep learning-based CAD) outperforms conventional CAD (27). However, no study has yet evaluated the effect of deep learning-based CAD on the decision processes of radiologists for diagnosing breast masses.
Recently, deep learning-based CAD for breast US (S-Detect™ for Breast in RS80A; Samsung Medison Co., Ltd., Seoul, Korea) has become commercially available (21). Therefore, the purpose of this study was to investigate whether deep learning-based CAD could improve radiologists' diagnostic performance in differentiating between malignant and benign masses on breast US.

MATERIALS AND METHODS

Participants and Breast Masses

This study was approved by the Institutional Review Board of Samsung Medical Center. Written informed consent was obtained from all participants regarding the use of their medical information for research purposes. Women who were referred for breast US for diagnostic purposes were recruited from the Samsung Medical Center (Seoul, Korea) between January and December 2015. Eligible patients were women aged ≥ 20 years with breast masses detected by US. Women who had masses without definite final diagnoses were excluded. This study included 816 patients with 1043 breast masses, and their US images were used to build a database.
From the database, 790 masses were randomly selected to construct datasets for training the deep learning-based CAD system (21). Thus, 253 remaining breast masses (80 malignant, 173 benign) from 226 patients were enrolled in this study. The median age of these patients was 47 years (interquartile range [IQR], 42.0–53.5 years). Their US images were used to construct datasets for image analysis. One hundred ninety-nine patients had one breast mass, and 27 patients had two breast masses.
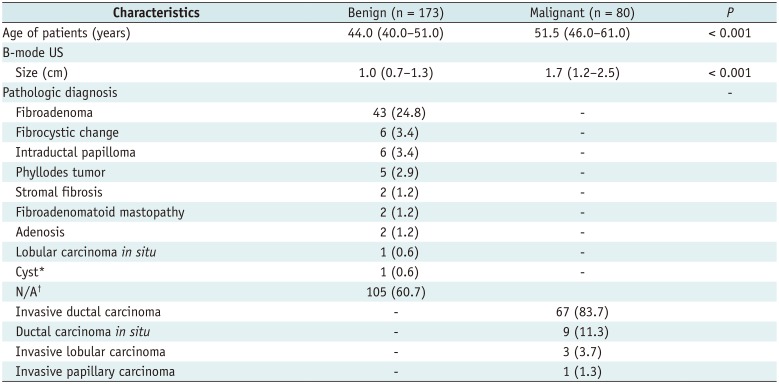
The final diagnosis for each mass was based on the histopathologic results of US-guided biopsy (n = 48), surgery (n = 99), or typical imaging findings only if they showed stability on follow-up imaging (n = 106) (Table 1). The mean follow-up duration was 21.5 months (range, 17–28 months). BI-RADS category 3 masses with insufficient follow-up were excluded from the study population.

US Examination

Three board-certified radiologists with more than eight years of experience in breast imaging were involved in image acquisition. US images were obtained using an RS80A system (Samsung Medison Co., Ltd.) with a 3–12-MHz linear high-frequency transducer. Radiologists performed bilateral whole breast B-mode US, and obtained three directional (i.e., transverse, longitudinal, and radial) static images showing the most suspicious features for each mass. For CAD analysis, video clips were subsequently recorded and it included the area of the entire mass and surrounding normal breast tissue. Video clips were recorded in one direction starting at one end of the mass and ending at the other end. Without considering other imaging findings, the radiologists independently assessed the BI-RADS final category based on the B-mode US findings (6). Biopsies were performed on masses assessed as BI-RADS category 4a or higher (n = 105), category 3 masses with palpable mass (n = 11), and masses increasing in size (n = 5). Moreover, biopsies were performed on category 3 or 2 masses upon patient request (n = 26).
US-guided core needle biopsy was performed with at least four passes using a 14-gauge automated biopsy gun (Acecut; TSK Laboratory, Soja, Japan). US-guided vacuum-assisted biopsy was performed with an 8- or 11-gauge needle (Mammotome; Devicor Medical, Cincinnati, OH, USA).

Image Analysis by the Deep Learning-Based CAD System and Radiologists

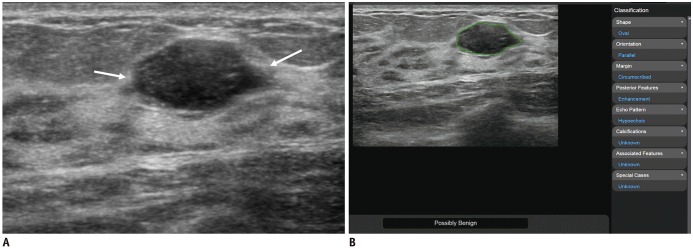
For CAD analysis, the three radiologists who performed US data acquisition retrospectively reviewed the video clips for each mass. They chose representative static images (i.e., transverse and longitudinal or radial and anti-radial) showing the most suspicious features and identified the location of the mass. On the chosen static image, a two-dimensional region of interest (ROI) was automatically drawn along the mass margin by the deep learning-based CAD system based on the GoogLeNet Convolutionary Neural Network (S-DetectTM for Breast [High Accuracy Mode] in RS80A) (21) (Supplementary Materials, in the online-only Data Supplement). Moreover, when the automatically generated ROI was considered inaccurate by a radiologist, it was manually adjusted (Fig. 1). Based on the given ROI, the deep learning-based CAD system automatically analyzed the US features and provided a final assessment of the mass displayed on the screen. CAD final assessments were divided into two categories, “possibly benign” or “possibly malignant.”
Image analysis was independently performed by four radiologists who had not performed the US examination. Two radiologists (11 years and 3 years) were experienced in breast imaging, and the other two radiologists were in training with less than one year of breast imaging experience.
In clinical practice, radiologists first perform B-mode US and then apply CAD to masses detected by B-mode US. Thus, two sequential reading sessions similar to actual practice were performed. First, the radiologists interpreted each mass with static B-mode US images, which were also used to derive the CAD results, alone and recorded its BI-RADS final assessment category (6). During the second reading session, the radiologists interpreted each mass by considering B-mode US images and their associated CAD results together. During this session, the radiologists subjectively recorded the category of each mass again, while considering prior category information from the first reading session. During the reading sessions, the radiologists were blinded to patient names, ages, identification numbers, other imaging modality findings, histopathological diagnoses, and clinical information.

Data and Statistical Analysis

Age and the mass size measured at US were compared between malignant and benign groups using the Mann-Whitney U test. To analyze the diagnostic performances of the radiologists and deep learning-based CAD for differentiating malignant from benign masses, the final assessments of the radiologists were categorized into positive (category 4a or higher) and negative (category 3 or lower) for each dataset. The deep learning-based CAD results were also categorized into positive (possibly malignant) and negative (possibly benign). The sensitivities, specificities, accuracies, positive predictive values (PPVs), and negative predictive values (NPVs) of the radiologists for the two datasets (US images alone or with the CAD results) and deep learning-based CAD were calculated based on the final breast mass diagnoses.
To investigate the effect of deep learning-based CAD on the radiologists' diagnostic performance, the corresponding diagnostic values of each radiologist for the two datasets (US images alone or with the CAD results) were compared using McNemar's, chi-square, and Bennett's tests (28). Statistical differences in the diagnostic values of the experienced radiologists (readers 1 and 2), training radiologists (readers 3 and 4), and all radiologists (readers 1–4) between the two datasets were further analyzed by a generalized estimating equations approach (29).
Moreover, to evaluate changes in the radiologists' decision making regarding the final BI-RADS category for predicting malignancy risk, an ROC curve analysis was performed using the seven-point BI-RADS rating score (i.e., 1, 2, 3, 4a, 4b, 4c, or 5). The ROC AUCs for radiologists were calculated, and the readers' AUCs for the two datasets (US images alone or with the CAD results) were compared using a nonparametric approach (30). For BI-RADS category 4a or higher, biopsy is performed. Thus, to evaluate changes in the radiologists' management decisions after CAD application, the total number of cases with management decision changes (i.e., biopsy or follow-up) of each reader was calculated (31).
Interobserver agreement between the four radiologists regarding the final assessments (positive or negative) was also evaluated for the two datasets using κ statistics for each dataset. The κ values were interpreted as follows: ≤ 0.20, slight agreement; 0.21–0.40, fair agreement; 0.41–0.60, moderate agreement; 0.61–0.80, substantial agreement; and 0.81–1.00, excellent agreement (32). Analysis was performed using SAS version 9.4 (SAS Institute, Cary, NC, USA). Statistical significance was accepted when p values were less than 0.05.

RESULTS

The median diameter of all of the breast masses at US was 1.1 cm (IQR, 0.8–1.7 cm). Patients diagnosed with malignant masses were significantly older than those with benign masses (p < 0.001). The median size of the malignant masses was significantly larger than that of the benign masses (p < 0.001) (Table 1).
The diagnostic performances of deep learning-based CAD and the radiologists for the two datasets (US images alone or with CAD) in differentiating malignant from benign masses are summarized in Table 2. The sensitivity, specificity, accuracy, PPV, and NPV of deep learning-based CAD were 85.0%, 95.4%, 92.1%, 89.5%, and 93.2%, respectively. Each radiologist had diagnostic performance changes when the deep learning-based CAD results were added to the US images. When the CAD results were combined with the US images, the two experienced radiologists and one of the training radiologists (readers 1–3) had significantly higher specificities, accuracies, and PPVs compared with those for the US images alone (range of readers 1–3 for US images alone vs. US images with CAD: specificity, 72.8–83.2% vs. 82.1–93.1% [p < 0.001, p = 0.006, and p = 0.014 for readers 1, 2, and 3, respectively]; accuracy, 77.9–84.2% vs. 86.2–90.9% [p < 0.001, p = 0.046, and p = 0.045]; and PPV, 60.2–70.4% vs. 71.0–85.2% [p < 0.001, p = 0.003, and p = 0.004]). When the sensitivities and NPVs of these readers were compared between the two datasets, readers 2 and 3 also showed higher, but non-significant, sensitivities and NPVs for the combination of the CAD results and US images compared with those for the US images alone (range of readers 2 and 3 for US images alone vs. US images with CAD: sensitivity, 86.3–88.8% vs. 90.0–95.0%; and NPV, 92.9–93.5% vs. 95.1–97.3%; all p > 0.05). Moreover, reader 1 had a similar sensitivity and NPV (US images alone vs. US images with CAD: sensitivity, 88.8% vs. 86.3%; NPV 93.3% vs. 93.6%; all p > 0.05). The other training radiologist (reader 4) had no significant differences in all of the diagnostic values when the CAD results were added to the US images (p > 0.05). The experienced radiologists (readers 1 and 2) had higher specificities (p < 0.001), accuracies (p < 0.001), and PPVs (p < 0.001) for the US images with CAD compared with those for the US images alone. However, the training radiologists (readers 3 and 4) had higher sensitivities (p = 0.040) and NPVs (p = 0.045) for the US images with CAD compared with those for the US images alone. In a comparative analysis of overall radiologist performance between the two datasets, the radiologists showed significantly higher specificity (*p < 0.001), accuracy (*p = 0.038), and PPV (*p = 0.001) values for the combination of the CAD results and US images compared with those for the US images alone (Fig. 1, Table 2).
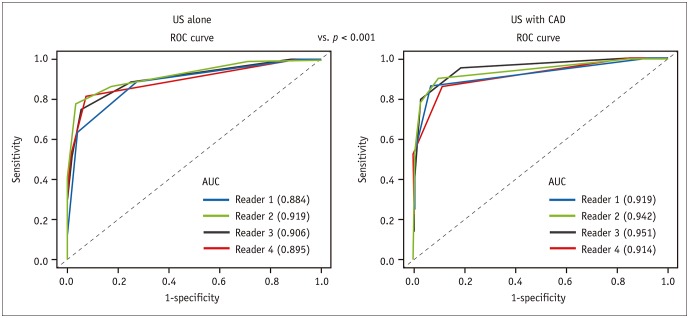
In predicting malignancy risk with the BI-RADS categories, the radiologists' AUCs for the US images with CAD (range, 0.914–0.951) were significantly higher than those for the US images alone (0.884–0.919; p < 0.001) (Fig. 2).
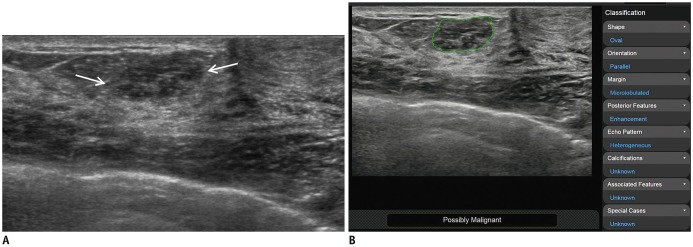
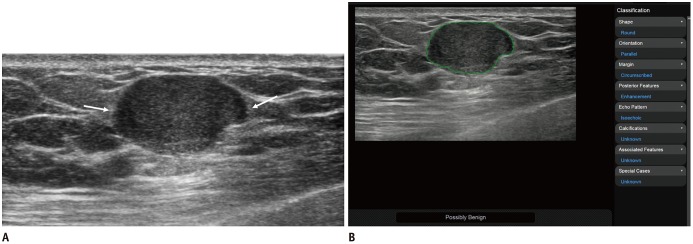
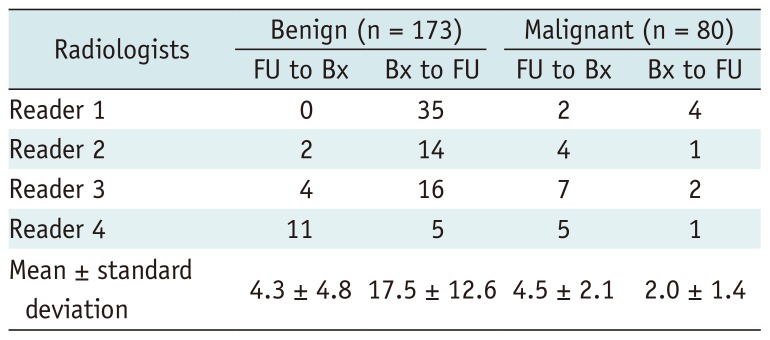
Regarding radiologist management decision changes, deep learning-based CAD led to biopsy decisions being correctly changed to follow-up decisions for a mean of 10.1% (17.5/173) of the benign masses; however, follow-up decisions were incorrectly changed to biopsy decisions for a mean of 2.5% (4.3/173) of the benign masses (Table 3). In the malignant masses, follow-up decisions were correctly changed to biopsy decisions in a mean of 5.6% (4.5/80) of the masses (Fig. 3); however, biopsy decisions were incorrectly changed to follow-up decisions in a mean of 2.5% (2.0/80) of the masses (Fig. 4).
For diagnosing malignant breast masses with US images alone, the four readers showed moderate to substantial agreement. When the CAD results were added to the US images, all of the readers showed substantial agreement (Table 4).

DISCUSSION

To our knowledge, few studies have investigated the effect of deep learning-based CAD on the decision-making process of radiologists diagnosing breast masses. For differentiating malignant from benign masses, we found that adding deep learning-based CAD results to B-mode US images significantly improved the specificities, accuracies, and PPVs of three out of four radiologists without losing sensitivity and NPV. However, the reduced impact on the sensitivity and NPV may be due to the radiologists' high sensitivity (81.3–88.8%) and NPV (91.4–93.5%) with US images alone. In addition, deep learning-based CAD significantly increased the AUCs of all of the radiologists for predicting malignancy risk with the BI-RADS categories. The overall results suggest that deep learning-based CAD can improve the performance of radiologists for diagnosing breast masses on breast US. Our results are in agreement with previous studies using CAD systems developed by individual research teams (13141627). Unlike these studies, we used a commercially available deep learning-based CAD system. Therefore, we believe that our results are of clinical value because our CAD system is directly applicable to clinical practice.
Prior to this study, we anticipated that the CAD effects might be minimal for experienced radiologists compared with training radiologists. However, the diagnostic performance of the experienced radiologists significantly improved after the application of deep learning-based CAD, whereas the diagnostic performance of only one of the training radiologists improved. Considering the relatively high specificity (92.5%) of the other training radiologist (reader 4) with US images alone, increasing the specificity with deep learning-based CAD would be insignificant to this reader's performance. Consequently, our results suggest that deep learning-based CAD can improve the performances of experienced and inexperienced radiologists by increasing specificity. In addition, CAD improved the interobserver agreement for the final assessments of the radiologists differentiating between malignant and benign masses, which indicates that CAD may provide radiologists with greater consistency when using breast US for diagnosis and management.
After the application of deep learning-based CAD, we found that the majority of the masses for which management decisions were changed were initially assessed as BI-RADS category 3 or 4a. However, management decisions did not change with typical benign (category 2) or moderate- to high-suspicion (category 4c or 5) masses. These findings indicate that deep learning-based CAD can improve diagnostic performance by leading radiologists to make correct biopsy decisions in cases where it is difficult to determine whether to perform a biopsy for BI-RADS 3 or 4a masses. Therefore, we believe that the commercially available deep learning-based CAD system used in our study can be an adjunctive tool similar to shear-wave elastography (SWE). SWE has been used as an ancillary tool to reduce the number of benign biopsies by further discriminating between category 3 or 4a masses detected by US (3334). In addition, by decreasing false-positive (10.1%, 17.5/173) and increasing true-positive (5.6%, 4.5/80) biopsies, deep learning-based CAD led to correct management decision changes by the radiologists. However, for malignant masses, incorrect decision changes from biopsy to follow-up occurred at a mean of 2.5% (2.0/80). Therefore, radiologists should be aware of this possibility when applying CAD in clinical practice.
This study has several limitations. First, the radiologists selected a representative image and confirmed a deep learning-based CAD ROI, which means that the CAD results may have interobserver variability due to differences in the observed features between the representative images. However, in a recent study by Sultan et al. (35), the differences in US BI-RADS features between different observations did not change conventional CAD diagnostic performance for differentiating between breast masses due to continual retraining. Considering this study as well as the widespread use of the US BI-RADS lexicon for breast imaging, we think that if radiologists who are familiar with the US BI-RADS use our deep learning-based CAD, the CAD results between radiologists will not vary much. Second, non-mass lesions (e.g., architectural distortion, calcifications not associated with the mass) were excluded from our analysis because their margins were not clearly distinguishable from normal breast tissue, which made it difficult to confirm non-mass lesion ROIs for CAD. Therefore, our results are not directly applicable to the diagnosis of non-mass lesions detected by breast US. Finally, we potentially included benign or typically benign masses that did not undergo biopsy. However, for such masses, follow-up US is generally recommended without biopsy (6). Moreover, all of these masses were stable or decreased in size during follow-up.
In conclusion, the diagnostic performance of deep learning-based CAD is higher than that of radiologists in differentiating between malignant and benign masses on breast US. When the CAD results were added to the US images, the radiologists showed improvement in their specificity, accuracy, and PPV without significant changes in their sensitivity and NPV. The use of deep learning-based CAD may improve the diagnostic performance of radiologists by increasing their specificity, accuracy, and PPV.

Acknowledgments

The authors are grateful to Insuk Sohn, Ph.D., Biostatics and Clinical Epidemiology Center, Samsung Medical Center, for help in the statistical analyses.

Notes

This study was supported by a research fund from Samsung Electronics Co., Ltd (Seoul, South Korea).

Conflicts of Interest: The authors have no potential conflicts of interest to disclose.

References

1. Berg WA, Blume JD, Cormack JB, Mendelson EB, Lehrer D, Böhm-Vélez M, et al. Combined screening with ultrasound and mammography vs mammography alone in women at elevated risk of breast cancer. JAMA. 2008; 299:2151–2163. PMID: 18477782.
crossref
2. Kelly KM, Dean J, Comulada WS, Lee SJ. Breast cancer detection using automated whole breast ultrasound and mammography in radiographically dense breasts. Eur Radiol. 2010; 20:734–742. PMID: 19727744.
crossref
3. Hooley RJ, Scoutt LM, Philpotts LE. Breast ultrasonography: state of the art. Radiology. 2013; 268:642–659. PMID: 23970509.
crossref
4. Ohuchi N, Suzuki A, Sobue T, Kawai M, Yamamoto S, Zheng YF, et al. Sensitivity and specificity of mammography and adjunctive ultrasonography to screen for breast cancer in the Japan Strategic Anti-cancer Randomized Trial (J-START): a randomised controlled trial. Lancet. 2016; 387:341–348. PMID: 26547101.
crossref
5. Berg WA, Blume JD, Cormack JB, Mendelson EB. Training the ACRIN 6666 Investigators and effects of feedback on breast ultrasound interpretive performance and agreement in BI-RADS ultrasound feature analysis. AJR Am J Roentgenol. 2012; 199:224–235. PMID: 22733916.
crossref
6. D'Orsi C, Sickles E, Mendelson E, Morris E. ACR BI-RADS® Atlas, breast imaging reporting and data system. 5th ed. Reston, VA: American College of Radiology;2013. p. 1–153.
7. Lazarus E, Mainiero MB, Schepps B, Koelliker SL, Livingston LS. BI-RADS lexicon for US and mammography: interobserver variability and positive predictive value. Radiology. 2006; 239:385–391. PMID: 16569780.
crossref
8. Kim EK, Ko KH, Oh KK, Kwak JY, You JK, Kim MJ, et al. Clinical application of the BI-RADS final assessment to breast sonography in conjunction with mammography. AJR Am J Roentgenol. 2008; 190:1209–1215. PMID: 18430833.
crossref
9. Stavros AT, Freitas AG, Giselle G, Barke L, McDonald D, Kaske T, et al. Ultrasound positive predictive values by BI-RADS categories 3–5 for solid masses: an independent reader study. Eur Radiol. 2017; 27:4307–4315. PMID: 28396996.
crossref
10. Abdullah N, Mesurolle B, El-Khoury M, Kao E. Breast imaging reporting and data system lexicon for US: interobserver agreement for assessment of breast masses. Radiology. 2009; 252:665–672. PMID: 19567644.
crossref
11. Yoon JH, Kim MJ, Moon HJ, Kwak JY, Kim EK. Subcategorization of ultrasonographic BI-RADS category 4: positive predictive value and clinical factors affecting it. Ultrasound Med Biol. 2011; 37:693–699. PMID: 21458145.
crossref
12. Doi K. Computer-aided diagnosis in medical imaging: historical review, current status and future potential. Comput Med Imaging Graph. 2007; 31:198–211. PMID: 17349778.
crossref
13. Joo S, Yang YS, Moon WK, Kim HC. Computer-aided diagnosis of solid breast nodules: use of an artificial neural network based on multiple sonographic features. IEEE Trans Med Imaging. 2004; 23:1292–1300. PMID: 15493696.
crossref
14. Huang YL, Chen DR. Support vector machines in sonography: application to decision making in the diagnosis of breast cancer. Clin Imaging. 2005; 29:179–184. PMID: 15855062.
15. Singh S, Maxwell J, Baker JA, Nicholas JL, Lo JY. Computer-aided classification of breast masses: performance and interobserver variability of expert radiologists versus residents. Radiology. 2011; 258:73–80. PMID: 20971779.
crossref
16. Alam SK, Feleppa EJ, Rondeau M, Kalisz A, Garra BS. Ultrasonic multi-feature analysis procedure for computer-aided diagnosis of solid breast lesions. Ultrason Imaging. 2011; 33:17–38. PMID: 21608446.
crossref
17. Moon WK, Chen IL, Chang JM, Shin SU, Lo CM, Chang RF. The adaptive computer-aided diagnosis system based on tumor sizes for the classification of breast tumors detected at screening ultrasound. Ultrasonics. 2017; 76:70–77. PMID: 28086107.
crossref
18. Tourassi GD, Frederick ED, Markey MK, Floyd CE Jr. Application of the mutual information criterion for feature selection in computer-aided diagnosis. Med Phys. 2001; 28:2394–2402. PMID: 11797941.
crossref
19. Newell D, Nie K, Chen JH, Hsu CC, Yu HJ, Nalcioglu O, et al. Selection of diagnostic features on breast MRI to differentiate between malignant and benign lesions using computer-aided diagnosis: differences in lesions presenting as mass and non-mass-like enhancement. Eur Radiol. 2010; 20:771–781. PMID: 19789878.
crossref
20. Yang MC, Moon WK, Wang YCF, Bae MS, Huang CS, Chen JH, et al. Robust texture analysis using multi-resolution gray-scale invariant features for breast sonographic tumor diagnosis. IEEE Trans Med Imaging. 2013; 32:2262–2273. PMID: 24001985.
crossref
21. Han S, Kang HK, Jeong JY, Park MH, Kim W, Bang WC, et al. A deep learning framework for supporting the classification of breast lesions in ultrasound images. Phys Med Biol. 2017; 62:7714–7728. PMID: 28753132.
crossref
22. Russakovsky O, Deng J, Su H, Krause J, Satheesh S, Ma S, et al. Imagenet large scale visual recognition challenge. Int J Comput Vis. 2015; 115:211–252.
crossref
23. Lee JG, Jun S, Cho YW, Lee H, Kim GB, Seo JB, et al. Deep learning in medical imaging: general overview. Korean J Radiol. 2017; 18:570–584. PMID: 28670152.
crossref
24. Suk HI, Lee SW, Shen D. Alzheimer's Disease Neuroimaging Initiative. Hierarchical feature representation and multimodal fusion with deep learning for AD/MCI diagnosis. Neuroimage. 2014; 101:569–582. PMID: 25042445.
crossref
25. Hua KL, Hsu CH, Hidayati SC, Cheng WH, Chen YJ. Computer-aided classification of lung nodules on computed tomography images via deep learning technique. Onco Targets Ther. 2015; 8:2015–2022. PMID: 26346558.
26. Lakhani P, Sundaram B. Deep learning at chest radiography: automated classification of pulmonary tuberculosis by using convolutional neural networks. Radiology. 2017; 284:574–582. PMID: 28436741.
crossref
27. Cheng JZ, Ni D, Chou YH, Qin J, Tiu CM, Chang YC, et al. Computer-aided diagnosis with deep learning architecture: applications to breast lesions in US images and pulmonary nodules in CT scans. Sci Rep. 2016; 6:24454. PMID: 27079888.
crossref
28. Bennett B. On comparisons of sensitivity, specificity and predictive value of a number of diagnostic procedures. Biometrics. 1972; 28:793–800. PMID: 5073252.
crossref
29. Barlow WE, Chi C, Carney PA, Taplin SH, D'Orsi C, Cutter G, et al. Accuracy of screening mammography interpretation by characteristics of radiologists. J Natl Cancer Inst. 2004; 96:1840–1850. PMID: 15601640.
crossref
30. DeLong ER, DeLong DM, Clarke-Pearson DL. Comparing the areas under two or more correlated receiver operating characteristic curves: a nonparametric approach. Biometrics. 1988; 44:837–845. PMID: 3203132.
crossref
31. Kim SA, Chang JM, Cho N, Yi A, Moon WK. Characterization of breast lesions: comparison of digital breast tomosynthesis and ultrasonography. Korean J Radiol. 2015; 16:229–238. PMID: 25741187.
crossref
32. Landis JR, Koch GG. The measurement of observer agreement for categorical data. Biometrics. 1977; 33:159–174. PMID: 843571.
crossref
33. Berg WA, Cosgrove DO, Doré CJ, Schäfer FK, Svensson WE, Hooley RJ, et al. Shear-wave elastography improves the specificity of breast US: the BE1 multinational study of 939 masses. Radiology. 2012; 262:435–449. PMID: 22282182.
crossref
34. Lee SH, Cho N, Chang JM, Koo HR, Kim JY, Kim WH, et al. Two-view versus single-view shear-wave elastography: comparison of observer performance in differentiating benign from malignant breast masses. Radiology. 2014; 270:344–353. PMID: 24029644.
crossref
35. Sultan LR, Bouzghar G, Levenback BJ, Faizi NA, Venkatesh SS, Conant EF, et al. Observer variability in BI-RADS ultrasound features and its influence on computer-aided diagnosis of breast masses. Advances in Breast Cancer Research. 2015; 4:1–8.
Supplementary Materials

The online-only Data Supplement is available with this article at https://doi.org/10.3348/kjr.2018.0530.

SUPPLEMENTARY MATERIALS

Development of Deep Learning-Based CAD
kjr-20-749-s001.pdf
Fig. 1

24-year-old woman diagnosed with fibroadenoma using US-guided biopsy.

A. Transverse B-mode US image shows 15-mm oval hypoechoic mass (arrows). B. After radiologist clicked on center point of mass on US image shown, two-dimensional region of interest (green line) was automatically drawn along mass margin through deep learning-based CAD. Following this, deep learning-based CAD analyzed US features of mass according to BI-RADS lexicon and displayed final assessment of “possibly benign” on screen. During first reading session (US images alone), two readers classified mass as BI-RADS category 4a because they assessed that margin of mass was angular (right arrow in A), whereas other two readers did not and classified mass as category 3. During second reading session (US images with CAD), two readers who previously classified mass as category 4a reassessed it as category 3, whereas two readers who previously classified it as category 3 did not change their classifications. BI-RADS = Breast Imaging Reporting and Data System, CAD = computer-aided diagnosis, US = ultrasound
kjr-20-749-g001
Fig. 2

ROC curves for radiologists for two datasets (US images alone vs. US images with CAD) based on probability of malignancy risk.

When deep learning-based CAD results were added to US, the readers' AUCs (right; range, 0.914–0.951) were significantly higher than those for US images alone (left; range, 0.884–0.919; p < 0.001). AUC = area under curve, ROC = receiver operating characteristic
kjr-20-749-g002
Fig. 3

50-year-old woman diagnosed with ductal carcinoma in situ using US-guided biopsy and surgical excision.

A. Transverse B-mode US image shows 13-mm oval mass with slightly heterogeneous echo pattern (arrows). B. Deep learning-based CAD analyzed US features of mass (green line) and displayed final assessment of “possibly malignant” on screen. During first reading session (US images alone), all four readers classified mass as BI-RADS category 3. During second reading session (US images with CAD), three of four readers changed their assessment to category 4a.
kjr-20-749-g003
Fig. 4

48-year-old woman diagnosed with invasive ductal carcinoma using US-guided biopsy and surgical excision.

A. Transverse B-mode US image shows 19-mm isoechoic mass (arrows). B. Deep learning-based CAD analyzed US features of mass (green line) and displayed final assessment of “possibly benign” on screen. During first reading session (US images alone), mass was classified as BI-RADS category 4b by one reader, category 4a by another reader, and category 3 by other two readers. During second reading session (US images with CAD), reader who previously classified mass as category 4b reassessed it as category 4a, whereas reader who classified it as category 4a reassessed it as category 3. Two readers who classified mass as category 3 did not change their classifications.
kjr-20-749-g004
Table 1

Characteristics of Overall 253 Breast Masses

kjr-20-749-i001
Characteristics Benign (n = 173) Malignant (n = 80) P
Age of patients (years) 44.0 (40.0–51.0) 51.5 (46.0–61.0) < 0.001
B-mode US
 Size (cm) 1.0 (0.7–1.3) 1.7 (1.2–2.5) < 0.001
Pathologic diagnosis -
 Fibroadenoma 43 (24.8) -
 Fibrocystic change 6 (3.4) -
 Intraductal papilloma 6 (3.4) -
 Phyllodes tumor 5 (2.9) -
 Stromal fibrosis 2 (1.2) -
 Fibroadenomatoid mastopathy 2 (1.2) -
 Adenosis 2 (1.2) -
 Lobular carcinoma in situ 1 (0.6) -
 Cyst* 1 (0.6) -
 N/A 105 (60.7)
 Invasive ductal carcinoma - 67 (83.7)
 Ductal carcinoma in situ - 9 (11.3)
 Invasive lobular carcinoma - 3 (3.7)
 Invasive papillary carcinoma - 1 (1.3)

Numeric data are presented as median (interquartile range). Non-numeric data are presented as number of lesions (percentage). *One cyst was diagnosed based on typical ultrasonographic features, without biopsy, Benign mass assessed by Breast Imaging Reporting and Data System 2 or 3, and all with stability on follow-up US for at least 1 year. N/A = not available, US = ultrasound

Table 2

Diagnostic Performance of Deep Learning-Based CAD and Radiologists for Two Datasets (US Images Alone or with CAD Results)

kjr-20-749-i002
Parameters CAD Experienced Radiologists Training Radiologists P*
Reader 1 Reader 2 P Reader 3 Reader 4 P
US Alone US with CAD P US Alone US with CAD P US Alone US with CAD P US Alone US with CAD P
Sensitivity (%) 85.0 (68/80) 88.8 (71/80) 86.3 (69/80) 0.683 86.3 (69/80) 90.0 (72/80) 0.371 0.782 88.8 (71/80) 95.0 (76/80) 0.182 81.3 (65/80) 86.3 (69/80) 0.221 0.040 0.120
Specificity (%) 95.4 (165/173) 72.8 (126/173) 93.1 (161/173) < 0.001 83.2 (144/173) 90.2 (156/173) 0.006 < 0.001 75.1 (130/173) 82.1 (142/173) 0.014 92.5 (160/173) 89.0 (154/173) 0.211 0.373 < 0.001
Accuracy (%) 92.1 (233/253) 77.9 (197/253) 90.9 (230/253) < 0.001 84.2 (213/253) 90.1 (228/253) 0.046 < 0.001 79.4 (201/253) 86.2 (218/253) 0.045 88.9 (225/253) 88.1 (223/253) 0.780 0.066 0.038
PPV (%) 89.5 (68/76) 60.2 (71/118) 85.2 (68/81) < 0.001 70.4 (69/98) 80.1 (72/89) 0.003 < 0.001 62.3 (71/114) 71.0 (76/107) 0.004 83.3 (65/78) 78.4 (69/88) 0.214 0.267 0.001
NPV (%) 93.2 (165/177) 93.3 (126/135) 93.6 (161/172) 0.860 92.9 (144/155) 95.1 (156/164) 0.106 0.250 93.5 (130/139) 97.3 (142/146) 0.155 91.4 (160/175) 93.3 (154/165) 0.155 0.045 0.259

Data in parentheses were used to calculate percentages. p values between B-mode US alone and combination of B-mode US with CAD results for each reader. *Adjusted p value between overall radiologists for B-mode US alone and combination of B-mode US with CAD results by GEE approach, Adjusted p value between experienced radiologists for B-mode US alone and combination of B-mode US with CAD results by GEE approach, Adjusted p value between training radiologists for B-mode US alone and combination of B-mode US with CAD results by GEE approach. CAD = computer-aided diagnosis, GEE = generalized estimating equations, NPV = negative predictive value, PPV = positive predictive value

Table 3

Changes in Radiologists' Decision Making for Biopsy Recommendations When Deep Learning-Based CAD Results Were Added to US

kjr-20-749-i003
Radiologists Benign (n = 173) Malignant (n = 80)
FU to Bx Bx to FU FU to Bx Bx to FU
Reader 1 0 35 2 4
Reader 2 2 14 4 1
Reader 3 4 16 7 2
Reader 4 11 5 5 1
Mean ± standard deviation 4.3 ± 4.8 17.5 ± 12.6 4.5 ± 2.1 2.0 ± 1.4

Data are numbers of masses. Bx = biopsy, FU = follow-up

Table 4

Changes in Interobserver Agreement among Radiologists' Final Assessments when Deep Learning-Based CAD Results Were Added to US

kjr-20-749-i004
Reading Modes Reader 1 Reader 2 Reader 3 Reader 4
US alone
 Reader 1 0.663 (0.571–0.755) 0.538 (0.434–0.643) 0.546 (0.447–0.645)
 Reader 2 0.663 (0.571–0.755) 0.563 (0.461–0.666) 0.706 (0.616–0.796)
 Reader 3 0.538 (0.434–0.643) 0.563 (0.461–0.666) 0.556 (0.456–0.656)
 Reader 4 0.546 (0.447–0.645) 0.706 (0.616–0.796) 0.556 (0.456–0.656)
US with CAD
 Reader 1 0.788 (0.707–0.868) 0.632 (0.536–0.728) 0.760 (0.675–0.845)
 Reader 2 0.788 (0.707–0.868) 0.718 (0.631–0.805) 0.783 (0.702–0.863)
 Reader 3 0.632 (0.536–0.728) 0.718 (0.631–0.805) 0.743 (0.659–0.827)
 Reader 4 0.760 (0.675–0.845) 0.783 (0.702–0.863) 0.743 (0.659–0.827)
TOOLS
Similar articles