Journal List > Korean J Radiol > v.20(5) > 1120258

Li, Tang, Yang, Zhang, Li, and Luo: Coronary CT Angiography with Knowledge-Based Iterative Model Reconstruction for Assessing Coronary Arteries and Non-Calcified Predominant Plaques

Abstract

Objective

To assess the effects of iterative model reconstruction (IMR) on image quality for demonstrating non-calcific high-risk plaque characteristics of coronary arteries.

Materials and Methods

This study included 66 patients (53 men and 13 women; aged 39–76 years; mean age, 55 ± 13 years) having single-vessel disease with predominantly non-calcified plaques evaluated using prospective electrocardiogram-gated 256-slice CT angiography. Paired image sets were created using two types of reconstruction: hybrid iterative reconstruction (HIR) and IMR. Plaque characteristics were compared using the two algorithms. The signal-to-noise ratio (SNR) and contrast-to-noise ratio (CNR) of the images and the CNR between the plaque and adjacent adipose tissue were also compared between the two reformatted methods.

Results

Seventy-seven predominantly non-calcified plaques were detected. Forty plaques showed napkin-ring sign with the IMR reformatted method, while nineteen plaques demonstrated napkin-ring sign with HIR. There was no statistically significant difference in the presentation of positive remodeling, low attenuation plaque, and spotty calcification between the HIR and IMR reconstructed methods (all p > 0.5); however, there was a statistically significant difference in the ability to discern the napkin-ring sign between the two algorithms (χ2 = 12.12, p < 0.001). The image noise of IMR was lower than that of HIR (10 ± 2 HU versus 12 ± 2 HU; p < 0.01), and the SNR and CNR of the images and the CNR between plaques and surrounding adipose tissues on IMR were better than those on HIR (p < 0.01).

Conclusion

IMR can significantly improve image quality compared with HIR for the demonstration of coronary artery and atherosclerotic plaques using a 256-slice CT.

INTRODUCTION

Image reconstruction algorithms play a critical role in coronary computed tomographic angiography (CCTA). The conventional filtered back projection (FBP) algorithm results in a substantial increase in image noise and streak artefacts with a reduction in the tube voltage and output, leading to impaired diagnostic image quality (12). Iterative reconstruction (IR) algorithms are advantageous in reducing the noise associated with FBP reconstruction algorithms (345). The hybrid IR (HIR) algorithm facilitates noise and radiation dose reduction compared with FBP (4678). Iterative model reconstruction (IMR), a knowledge-based fully IR algorithm, is the latest advancement in the field of reconstruction technology, and has been applied to CCTA (9101112). Previous studies on IMR mainly focused on the quality of coronary artery images and radiation dose reduction (1314). However, it has not been known whether image quality for the identification of vulnerable coronary atherosclerotic plaques could be improved using IMR.
The detection of coronary atherosclerotic plaque and identification of plaque vulnerability are important in devising appropriate intervention strategies for optimal prognosis. Studies showed that most acute coronary syndromes result from the rupture of vulnerable plaques and subsequent thrombus formation rather than from the severity of luminal stenosis (15). However, the demonstration of non-calcified components of coronary artery plaques using the HIR algorithm is often difficult. We hypothesized that the IMR algorithm is better than the HIR in the characterization of coronary plaques and detection of vulnerable plaques. The purpose of this study was to assess the image quality of IMR in demonstrating non-calcified or vulnerable components of coronary artery plaques in comparison with that of HIR.

MATERIALS AND METHODS

Patient Selection

This research protocol was approved by the Institutional Review Board, and informed consent was obtained from all patients before examination in this prospective study. This study enrolled patients with suspected coronary artery diseases who had undergone CCTA from August 2016 to January 2017, in our institution. Data were collected from subjects having single-vessel disease with non-calcified coronary plaques and significant stenosis (≥ 50% in diameter) on CCTA. Exclusion criteria for CCTA included subjects with renal dysfunction (glomerular filtration rate < 60 mL/min), arrhythmia, known allergy to iodinated contrast media, and the inability to sustain a 10-second breath-hold. Finally, 66 subjects (53 men and 13 women; aged 39–76 years; mean age, 55 ± 13 years) were included.

CCTA Protocol

CCTA was performed on a 256-slice CT scanner (Brilliance iCT; Philips Healthcare, Cleveland, OH, USA). In all patients with a heart rate (HR) > 65 beats per minute (bpm), a β-blocker (metoprolol tartrate; AstraZeneca, London, UK) was orally administered at the dose of 25–50 mg to achieve the target HR ≤ 65 bpm, 2 hours before CT examinations. Administration of sublingual nitroglycerin (LGC, Teddington, UK) for coronary vasodilation was performed at the time of imaging. CCTA was performed using a prospective electrocardiogram (ECG) triggering protocol using the following parameters: slice configuration, 128 × 0.625 mm; gantry rotation time, 270 ms; pitch, 0.18; tube voltage, 100 kVp; effective tube current time product, 600 mAs with ECG-dependent tube current modulation; and slice thickness, 0.8 mm with slice increment of 0.45 mm. A bolus-tracking technique was used to monitor the CT value of the ascending aorta with a trigger threshold of 120 HU. The scans were started 5 seconds after the trigger. Each patient received 70 mL of contrast media (iopromide, Ultravist® 370; Bayer Healthcare, Berlin, Germany) intravenously at the speed of 5 mL/s, followed by 40 mL of saline at the same injection speed.

Coronary CT Image Post-Processing and Data Analysis

The CT data were respectively reconstructed with an HIR algorithm (iDose4-level; Philips Healthcare) and an implementation of the new knowledge-based IR algorithm (IMR-level 1) for each subject. The reconstructed parameters were the same, including 0.8 mm thickness with 0.45 mm increment, 512 × 512 in matrix, 250 mm field of view and a standard cardiac reconstruction kernel (XCB). All CCTA data were transferred to a computer workstation (Extended Brilliance WorkspaceV4.5.2; Philips Healthcare).
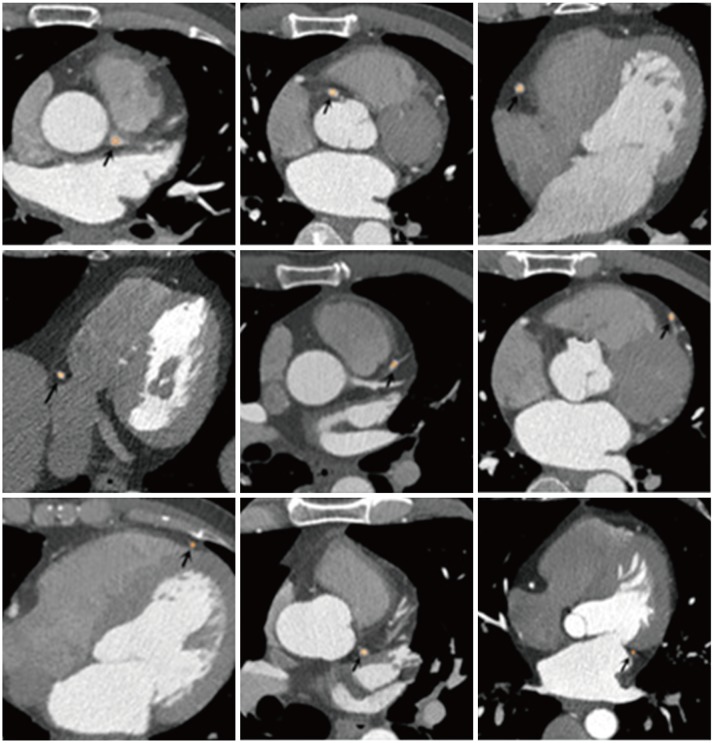
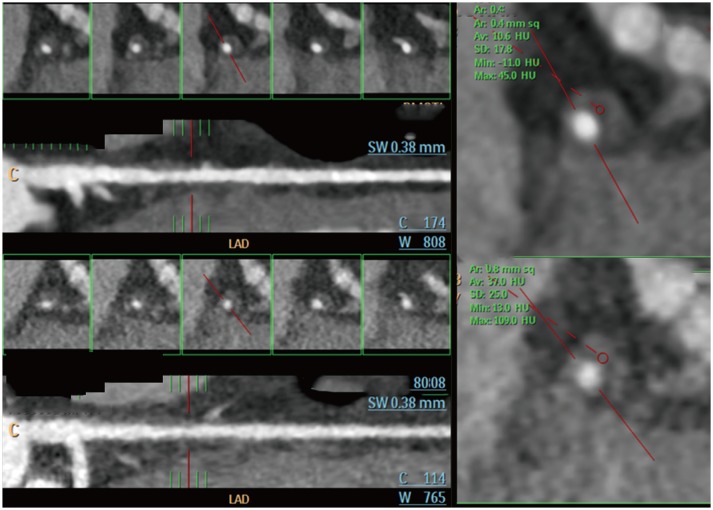
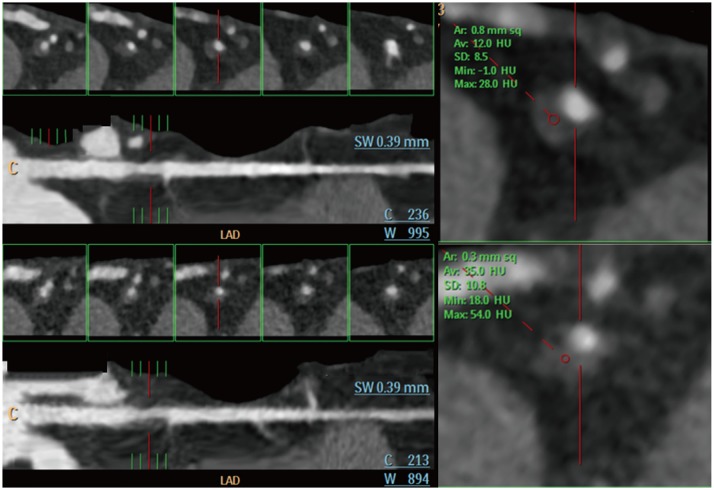
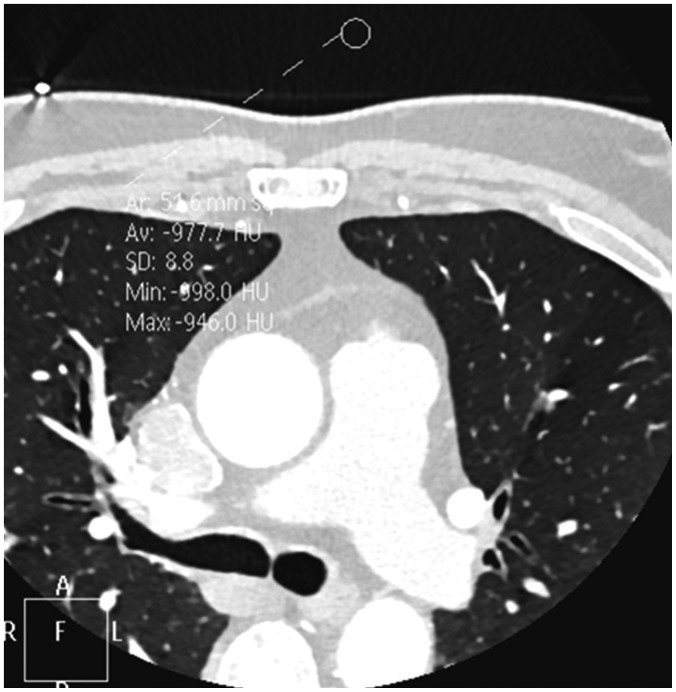
Maximum intensity projection (MIP), multi-planar reconstruction (MPR), and curved-planar reconstruction images were reconstructed and used for detecting coronary plaque by a radiologist with 5 years of experience in CCTA. An MIP image of the long axis of the coronary artery was reconstructed to identify lesions with significant stenosis, and then cross-sectional MPR images of 1 mm thickness through the plaque were reconstructed for demonstrating the plaque and measuring the contrast-to-noise ratio (CNR) between the plaque and adjacent adipose tissue. The CT value of the aortic root was measured on axial source image with both HIR and IMR algorithms. The region of interest (ROI) in the aortic root was about 200 mm2. The CT values were also measured in the lumens of the left main (LM) trunk, proximal, middle, and distal segments of the right coronary artery (RCA), left anterior descending (LAD) artery, and proximal and distal segments of the left circumflex (LCX) artery. The round ROI was placed in the center of the vessels and was neither small enough to be affected by pixel variability nor large enough to approach the edge of the vessels (Figs. 1, 2). The CT values of plaques were measured on both HIR and IMR-reformatted axial images using ROIs with the same size and location. Each ROI was located at the lowest attenuation area of the plaque and drawn as large as possible. Microcalcifications or other disturbing structures were carefully avoided. The CT values of the adjacent perivascular adipose tissues were also measured (Fig. 3). Noise was defined as the standard deviation (SD) measured in the background (air), anterior to the patients' chest wall. The area of the ROI for measuring noise was about 50 mm2 (Fig. 4). The measurement in each ROI was performed three times, and the average value was calculated. The signal-to-noise ratio (SNR) was calculated for intravascular attenuation and plaque attenuation. CNR was calculated as follows: ([attenuation of vessel lumen or attenuation of plaque] − [attenuation of the adjacent perivascular adipose tissue]) / image noise. The coronary segmentation was determined according to the Society of Cardiovascular CT guidelines for the interpretation and reporting of CCTA (16).
High-risk plaque analysis was performed using the follow criteria: low-attenuation plaque (plaque attenuation lower than 60 HU), napkin-ring sign, spotty calcifications (calcification < 3 mm in size), and positive remodeling. Napkin-ring sign was defined as an outer high-attenuation rim (< 200 HU) with an inner hypo-attenuation area (< 130 HU), which was not adjacent to a calcification and present on a minimum of two adjacent 1 mm axial slices. We carefully checked the non-contrast CT for microcalcifications when we evaluated a napkin-ring sign. The remodeling index was calculated as the ratio of the maximal cross-sectional vessel diameter, including the plaque and lumen, and its closest proximal normal reference vessel diameter (17). A remodeling index > 1.05 was considered as positive remodeling (18).
Two experienced radiologists with 10 and 5 years of experience with CCTA, respectively, blinded to image algorithms, identified plaque characteristics independently and collectively resolved any differences in their readings.

Statistical Analysis

Continuous variables were presented as mean ± SD, and categorical variables were expressed as frequencies or percentages. A paired t test was used to determine the differences in image noise, vascular attenuation, plaque attenuation, adipose tissue attenuation surrounding plaque, SNR, and CNR between the two image reconstruction methods. Chi-square test was performed to compare the difference between the HIR and IMR algorithms in detecting plaque characteristics. Cohen's kappa test was used to analyze the inter-observer agreement in discerning the plaque characteristics. The κ values were defined as follows: 0–0.2, poor agreement; 0.21–0.40, fair agreement; 0.41–0.60, moderate agreement; 0.61–0.80, substantial agreement; and 0.81–1.00, almost perfect agreement. A two-tailed p value < 0.05 was considered statistically significant. All statistical analyses were conducted by SPSS 18.0 for Windows (SPSS Inc., Chicago, IL, USA).

RESULTS

Coronary Atherosclerotic Plaque Characteristics

Seventy-seven non-calcified or predominantly non-calcified plaques with significant coronary stenosis were detected. Two plaques were located in LM, 51 in LAD, 23 in RCA, and 1 in LCX.
A total of 72 (93.5%) high-risk plaques were detected on IMR images, including 42 (54.5%) showing low attenuation, 40 (51.9%) with napkin-ring sign (Figs. 5, 6), 18 (23.4%) with spotty calcifications, and 59 (76.6%) with positive remodeling. There were 70 (90.9%) high-risk plaques identified on HIR images, including 41 (53.2%) showing low attenuation, 19 (24.7%) with napkin-ring sign, 18 (23.4%) with spotty calcifications, and 57 (74.0%) with positive remodeling. The chi-square test showed no statistically significant difference in the presentation of low attenuation plaque, spotty calcification, or positive remodeling between the HIR and IMR reconstruction methods, but there was a statistically significant difference in the discernment of the napkin-ring sign between the two algorithms (χ2 = 12.12, p < 0.001) (Table 1).

Quantitative Analysis

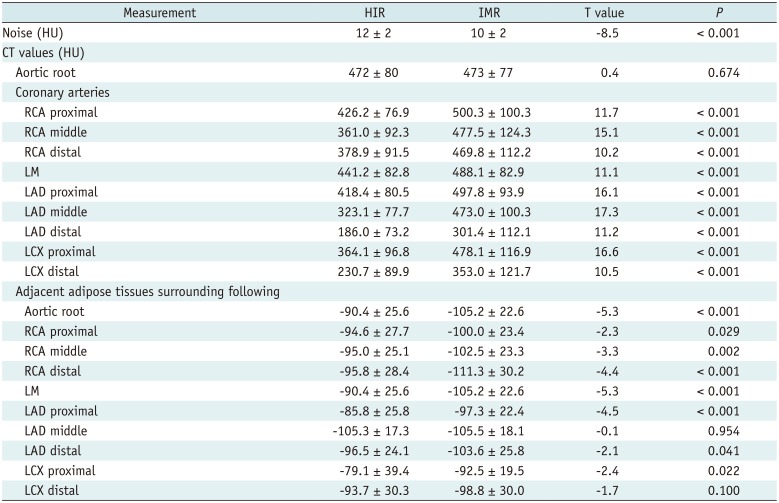
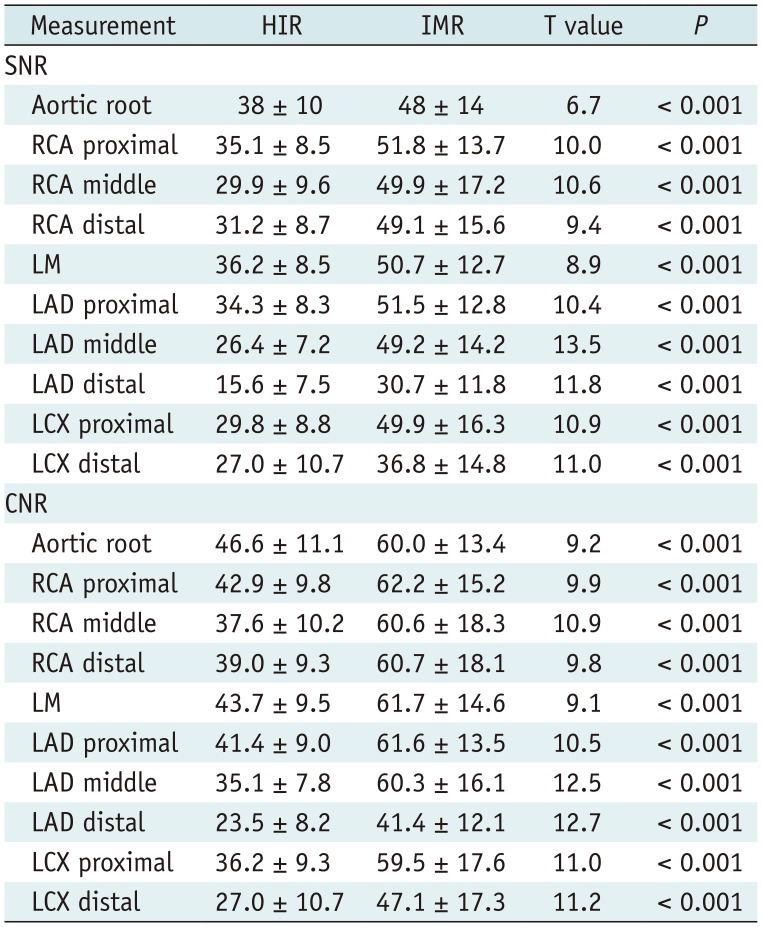
Table 2 summarizes the results of image quality between the HIR and IMR reconstruction algorithms. The noise with IMR was significantly lower than that with HIR (p < 0.001). The attenuation of the aortic root with IMR was not different from that with the HIR reconstruction method (p = 0.674). The CT values of the coronary artery segments measured using IMR were significantly greater compared to those using HIR (p < 0.001). The CT values of adipose tissues surrounding the vessels measured using IMR were significantly lower compared to those using HIR (p < 0.05), except for the LAD middle segment (p = 0.954) and LCX distal segment (p = 0.100). The SNR and CNR using IMR were significantly greater compared to those using the HIR-reformatted algorithm (p < 0.001) (Table 3). Table 4 presents the quantitative analysis of coronary atherosclerotic plaques between the two algorithms. The CT value of the plaques was significantly higher with IMR than that with HIR (p < 0.05), and the CT value of the surrounding adipose tissue was significantly lower with IMR than that with HIR (p < 0.05). Compared with HIR, the SNR and CNR between plaque and surrounding adipose tissue were significantly improved with IMR (p < 0.001). Cohen's kappa test showed that the agreement between the two observers for discerning plaque characteristics was 0.77 (Kappa = 6.73, p < 0.001).

DISCUSSION

In the present study, we evaluated coronary atherosclerotic plaques with knowledge-based IMR in CCTA. The major findings of the study were twofold: first, IMR demonstrates the napkin-ring sign of plaque better than HIR; second, IMR can significantly reduce the image noise and improve the image quality and CNR between coronary atherosclerotic plaques and surrounding adipose tissue compared with HIR on 256-slice CCTA.
HIR can decrease image noise and artefacts to some degrees depending on the proportion of iterative blending with FBP. However, a certain amount of image noise and artefacts remain in a low-dose scanning protocol that uses an HIR (19).
IMR is an advanced, knowledge-based IR algorithm that controls image noise using data statistics, image statistics, and system modeling (20). There are two IMR cardiac settings (Cardiac Routine and Cardiac Sharp; Philips Healthcare), each with three levels (L1, L2, and L3). In our hospital, we targeted the lowest noise reduction, Level 1, with the cardiac routine setting for visualizing coronary arteries and soft tissue. IMR does not involve blending with FBP images and provides full IR. Originally, model-based IR required extended reconstruction time because of its more complicated algorithm than HIR, which restricted its clinical feasibility (12). More recently, the powerful computational ability of IMR has reduced the reconstruction time to within approximately 5 minutes, which has led to routine clinical application of IMR in CCTA (12).
Only a few published clinical studies have demonstrated that the use of a low tube voltage protocol combined with IMR could facilitate dose reduction without compromising image quality in CCTA (13142122). Our study also showed that IMR could reduce image noise and improve image quality compared with HIR. This is consistent with previous studies. Some studies (1923) found no difference in CT values in great vessels between IMR and HIR. However, few studies paid attention to the difference in CT values in small vessels between the two algorithms. Furthermore, whether coronary plaque characteristics could be demonstrated more clearly with IMR is still unknown. To our knowledge, the present study is the first to assess in vivo non-calcified or predominantly non-calcified coronary plaques using the IMR algorithm. Our study revealed that the CT value in the coronary artery was significantly increased with IMR compared with HIR. Our study also found that IMR could strengthen the contrast between plaque and adjacent adipose tissue, which is possibly attributable to the increase in the CT values of plaques and the decrease in the CT value of adjacent adipose tissue with IMR. The increased contrast between plaques and surrounding adipose tissue improves visual evaluation of coronary non-calcified or predominantly non-calcified plaques.
High-risk plaques distinguish the patients who are at a risk for future major adverse cardiac events (MACEs). The high-risk plaque criteria by CCTA include low attenuation plaque, spotty calcification, positive remodeling, and napkin-ring sign. A previous study found that the napkin-ring sign is the most powerful predictor for MACE (17). Our study shows that a significantly higher proportion of napkin-ring sign is visualized on IMR images than on HIR. Therefore, IMR is more advantageous for detecting high-risk plaques than is HIR.
There are a few limitations of this study. First, FBP was not compared with HIR and IMR, although some studies in the literature have reported that HIR can reduce image noise and help obtain images of good quality during CCTA compared with FBP (192425). Second, diagnostic accuracy in the detection of high-risk plaques was not verified using the gold standard. Because of these limitations, a follow-up study is ongoing in the same patients in our institution.
In conclusion, the knowledge-based IMR algorithm significantly reduces image noise and produces better quality images during CCTA in comparison with HIR. Plaque characteristics can be more clearly discerned with IMR compared with HIR, thereby indicating that this method may enable detection of plaque vulnerability.

Notes

This study was supported by state key and research and development project grant 2016YFC1300300 and NSFC grant 81371547.

Conflicts of Interest: The authors have no potential conflicts of interest to disclose.

References

1. Smith-Bindman R. Is computed tomography safe? N Engl J Med. 2010; 363:1–4. PMID: 20573919.
crossref
2. Leipsic J, Heilbron BG, Hague C. Iterative reconstruction for coronary CT angiography: finding its way. Int J Cardiovasc Imaging. 2012; 28:613–620. PMID: 21359835.
crossref
3. Silva AC, Lawder HJ, Hara A, Kujak J, Pavlicek W. Innovations in CT dose reduction strategy: application of the adaptive statistical iterative reconstruction algorithm. AJR Am J Roentgenol. 2010; 194:191–199. PMID: 20028923.
crossref
4. Hou Y, Liu X, Xv S, Guo W, Guo Q. Comparisons of image quality and radiation dose between iterative reconstruction and filtered back projection reconstruction algorithms in 256-MDCT coronary angiography. AJR Am J Roentgenol. 2012; 199:588–594. PMID: 22915398.
crossref
5. Klink T, Obmann V, Heverhagen J, Stork A, Adam G, Begemann P. Reducing CT radiation dose with iterative reconstruction algorithms: the influence of scan and reconstruction parameters on image quality and CTDIvol. Eur J Radiol. 2014; 83:1645–1654. PMID: 25037931.
crossref
6. Leipsic J, Labounty TM, Heilbron B, Min JK, Mancini GB, Lin FY, et al. Adaptive statistical iterative reconstruction: assessment of image noise and image quality in coronary CT angiography. AJR Am J Roentgenol. 2010; 195:649–654. PMID: 20729442.
crossref
7. Kröpil P, Bigdeli AH, Nagel HD, Antoch G, Cohnen M. Impact of increasing levels of advanced iterative reconstruction on image quality in low-dose cardiac CT angiography. Rofo. 2014; 186:567–575. PMID: 24458375.
8. Wang R, Schoepf UJ, Wu R, Reddy RP, Zhang C, Yu W, et al. Image quality and radiation dose of low dose coronary CT angiography in obese patients: sinogram affirmed iterative reconstruction versus filtered back projection. Eur J Radiol. 2012; 81:3141–3145. PMID: 22578834.
crossref
9. Yuki H, Utsunomiya D, Funama Y, Tokuyasu S, Namimoto T, Hirai T, et al. Value of knowledge-based iterative model reconstruction in low-kV 256-slice coronary CT angiography. J Cardiovasc Comput Tomogr. 2014; 8:115–123. PMID: 24661824.
crossref
10. Halpern EJ, Gingold EL, White H, Read K. Evaluation of coronary artery image quality with knowledge-based iterative model reconstruction. Acad Radiol. 2014; 21:805–811. PMID: 24809321.
crossref
11. Oda S, Weissman G, Vembar M, Weigold WG. Iterative model reconstruction: improved image quality of low-tube-voltage prospective ECG-gated coronary CT angiography images at 256-slice CT. Eur J Radiol. 2014; 83:1408–1415. PMID: 24873832.
crossref
12. Oda S, Utsunomiya D, Funama Y, Katahira K, Honda K, Tokuyasu S, et al. A knowledge-based iterative model reconstruction algorithm: can super-low-dose cardiac CT be applicable in clinical settings? Acad Radiol. 2014; 21:104–110. PMID: 24331272.
13. Zhang F, Yang L, Song X, Li YN, Jiang Y, Zhang XH, et al. Feasibility study of low tube voltage (80 kVp) coronary CT angiography combined with contrast medium reduction using iterative model reconstruction (IMR) on standard BMI patients. Br J Radiol. 2016; 89:20150766. PMID: 26607646.
14. Lee J, Park CH, Oh CS, Han K, Kim TH. Coronary computed tomographic angiography at 80 kVp and knowledge-based iterative model reconstruction is non-inferior to that at 100 kVp with iterative reconstruction. PLoS One. 2016; 11:e0163410. PMID: 27658197.
crossref
15. Virmani R, Burke AP, Farb A, Kolodgie FD. Pathology of the vulnerable plaque. J Am Coll Cardiol. 2006; 47(8 Suppl):C13–C18. PMID: 16631505.
crossref
16. Leipsic J, Abbara S, Achenbach S, Cury R, Earls JP, Mancini GJ, et al. SCCT guidelines for the interpretation and reporting of coronary CT angiography: a report of the Society of Cardiovascular Computed Tomography Guidelines Committee. J Cardiovasc Comput Tomogr. 2014; 8:342–358. PMID: 25301040.
crossref
17. Feuchtner G, Kerber J, Burghard P, Dichtl W, Friedrich G, Bonaros N, et al. The high-risk criteria low-attenuation plaque <60 HU and the napkin-ring sign are the most powerful predictors of MACE: a long-term follow-up study. Eur Heart J Cardiovasc Imaging. 2017; 18:772–779. PMID: 27502292.
18. Schmid M, Pflederer T, Jang IK, Ropers D, Sei K, Daniel WG, et al. Relationship between degree of remodeling and CT attenuation of plaque in coronary atherosclerotic lesions: an in-vivo analysis by multi-detector computed tomography. Atherosclerosis. 2008; 197:457–464. PMID: 17727859.
crossref
19. Hu MQ, Li M, Liu ZY, Huang MP, Liu H, Liang CH. Image quality evaluation of iterative model reconstruction on low tube voltage (80 kVp) coronary CT angiography in an animal study. Acta Radiol. 2016; 57:170–177. PMID: 25657261.
crossref
20. Chang W, Lee JM, Lee K, Yoon JH, Yu MH, Han JK, et al. Assessment of a model-based, iterative reconstruction algorithm (MBIR) regarding image quality and dose reduction in liver computed tomography. Invest Radiol. 2013; 48:598–606. PMID: 23511193.
crossref
21. Hausleiter J, Martinoff S, Hadamitzky M, Martuscelli E, Pschierer I, Feuchtner GM, et al. Image quality and radiation exposure with a low tube voltage protocol for coronary CT angiography results of the PROTECTION II Trial. JACC Cardiovasc Imaging. 2010; 3:1113–1123. PMID: 21070998.
22. Feuchtner GM, Jodocy D, Klauser A, Haberfellner B, Aglan I, Spoeck A, et al. Radiation dose reduction by using 100-kV tube voltage in cardiac 64-slice computed tomography: a comparative study. Eur J Radiol. 2010; 75:e51–e56. PMID: 19671491.
crossref
23. Park CH, Lee J, Oh C, Han KH, Kim TH. The feasibility of sub-millisievert coronary CT angiography with low tube voltage, prospective ECG gating, and a knowledge-based iterative model reconstruction algorithm. Int J Cardiovasc Imaging. 2015; 31(Suppl 2):197–203. PMID: 26521066.
crossref
24. André F, Fortner P, Vembar M, Mueller D, Stiller W, Buss SJ, et al. Improved image quality with simultaneously reduced radiation exposure: knowledge-based iterative model reconstruction algorithms for coronary CT angiography in a clinical setting. J Cardiovasc Comput Tomogr. 2017; 11:213–220. PMID: 28314613.
crossref
25. Iyama Y, Nakaura T, Yokoyama K, Kidoh M, Harada K, Oda S, et al. Low-contrast and low-radiation dose protocol in cardiac computed tomography: usefulness of low tube voltage and knowledge-based iterative model reconstruction algorithm. J Comput Assist Tomogr. 2016; 40:941–947. PMID: 27224224.
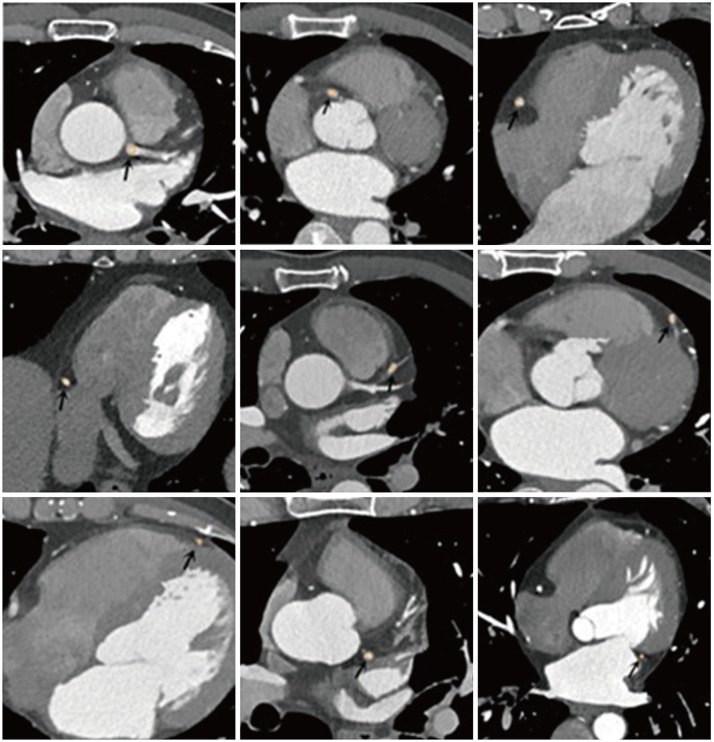
Fig. 1

CT value measurement in coronary artery segments (arrows) on IMR images.

CT values were measured in lumen of left main trunk, proximal, middle, and distal segments of right coronary artery, LAD artery, and proximal and distal segments of left circumflex artery. IMR = iterative model reconstruction, LAD = left anterior descending
kjr-20-729-g001
Fig. 2

CT value measurement in coronary artery segments (arrows) on HIR images in same patient.

HIR = hybrid iterative reconstruction
kjr-20-729-g002
Fig. 3

Plaque identification and CT value measurement.

A. Non-calcified plaque was detected on proximal segment of LAD on curved reformation. B. CT value of plaque and adjacent perivascular adipose tissue measurement. Ar = area, Av = average, Max = maximum, Min = minimum, SD = standard deviation
kjr-20-729-g003
Fig. 4

Noise measurement.

Noise was defined as SD measured in background (air) anterior to patients' chest wall. Area of region of interest for measuring noise was about 50 mm2.
kjr-20-729-g004
Fig. 5

Representative figures of napkin-ring sign in 47-year-old male patient.

Top figures show that napkin-ring sign of LAD plaque can be detected using IMR algorithm, but not on HIR image (bottom figures).
kjr-20-729-g005
Fig. 6

Representative figures of napkin-ring sign in 64-year-old female patient.

Top figures show that napkin-ring sign of LAD plaque can be detected using IMR algorithm, but not on HIR image (bottom figures).
kjr-20-729-g006
Table 1

Plaque Characteristics Demonstration between HIR and IMR Algorithms

kjr-20-729-i001
Characteristics HIR (n = 77) IMR (n = 77) χ2 P
No. of high-risk plaques 70 (90.9%) 72 (93.5%) 0.36 0.548
Positive remodeling 57 (74.0%) 59 (76.6%) 0.14 0.709
Low attenuation 41 (53.2%) 42 (54.5%) 0.03 0.872
Spotty calcifications 18 (23.4%) 18 (23.4%) 0.00 1.000
Napkin-ring sign 19 (24.7%) 40 (51.9%) 12.12 < 0.001

HIR = hybrid iterative reconstruction, IMR = iterative model reconstruction

Table 2

Image Noise, CT Values of Aortic Root, Coronary Artery Segments and Adipose Tissue of Each Region between HIR and IMR Algorithms

kjr-20-729-i002
Measurement HIR IMR T value P
Noise (HU) 12 ± 2 10 ± 2 -8.5 < 0.001
CT values (HU)
 Aortic root 472 ± 80 473 ± 77 0.4 0.674
 Coronary arteries
  RCA proximal 426.2 ± 76.9 500.3 ± 100.3 11.7 < 0.001
  RCA middle 361.0 ± 92.3 477.5 ± 124.3 15.1 < 0.001
  RCA distal 378.9 ± 91.5 469.8 ± 112.2 10.2 < 0.001
  LM 441.2 ± 82.8 488.1 ± 82.9 11.1 < 0.001
  LAD proximal 418.4 ± 80.5 497.8 ± 93.9 16.1 < 0.001
  LAD middle 323.1 ± 77.7 473.0 ± 100.3 17.3 < 0.001
  LAD distal 186.0 ± 73.2 301.4 ± 112.1 11.2 < 0.001
  LCX proximal 364.1 ± 96.8 478.1 ± 116.9 16.6 < 0.001
  LCX distal 230.7 ± 89.9 353.0 ± 121.7 10.5 < 0.001
 Adjacent adipose tissues surrounding following
  Aortic root -90.4 ± 25.6 -105.2 ± 22.6 -5.3 < 0.001
  RCA proximal -94.6 ± 27.7 -100.0 ± 23.4 -2.3 0.029
  RCA middle -95.0 ± 25.1 -102.5 ± 23.3 -3.3 0.002
  RCA distal -95.8 ± 28.4 -111.3 ± 30.2 -4.4 < 0.001
  LM -90.4 ± 25.6 -105.2 ± 22.6 -5.3 < 0.001
  LAD proximal -85.8 ± 25.8 -97.3 ± 22.4 -4.5 < 0.001
  LAD middle -105.3 ± 17.3 -105.5 ± 18.1 -0.1 0.954
  LAD distal -96.5 ± 24.1 -103.6 ± 25.8 -2.1 0.041
  LCX proximal -79.1 ± 39.4 -92.5 ± 19.5 -2.4 0.022
  LCX distal -93.7 ± 30.3 -98.8 ± 30.0 -1.7 0.100

LAD = left anterior descending, LCX = left circumflex, LM = left main, RCA = right coronary artery

Table 3

SNR of Images and CNR between Vessels and Adjacent Epicardial Adipose Tissues between HIR and IMR Algorithms

kjr-20-729-i003
Measurement HIR IMR T value P
SNR
 Aortic root 38 ± 10 48 ± 14 6.7 < 0.001
 RCA proximal 35.1 ± 8.5 51.8 ± 13.7 10.0 < 0.001
 RCA middle 29.9 ± 9.6 49.9 ± 17.2 10.6 < 0.001
 RCA distal 31.2 ± 8.7 49.1 ± 15.6 9.4 < 0.001
 LM 36.2 ± 8.5 50.7 ± 12.7 8.9 < 0.001
 LAD proximal 34.3 ± 8.3 51.5 ± 12.8 10.4 < 0.001
 LAD middle 26.4 ± 7.2 49.2 ± 14.2 13.5 < 0.001
 LAD distal 15.6 ± 7.5 30.7 ± 11.8 11.8 < 0.001
 LCX proximal 29.8 ± 8.8 49.9 ± 16.3 10.9 < 0.001
 LCX distal 27.0 ± 10.7 36.8 ± 14.8 11.0 < 0.001
CNR
 Aortic root 46.6 ± 11.1 60.0 ± 13.4 9.2 < 0.001
 RCA proximal 42.9 ± 9.8 62.2 ± 15.2 9.9 < 0.001
 RCA middle 37.6 ± 10.2 60.6 ± 18.3 10.9 < 0.001
 RCA distal 39.0 ± 9.3 60.7 ± 18.1 9.8 < 0.001
 LM 43.7 ± 9.5 61.7 ± 14.6 9.1 < 0.001
 LAD proximal 41.4 ± 9.0 61.6 ± 13.5 10.5 < 0.001
 LAD middle 35.1 ± 7.8 60.3 ± 16.1 12.5 < 0.001
 LAD distal 23.5 ± 8.2 41.4 ± 12.1 12.7 < 0.001
 LCX proximal 36.2 ± 9.3 59.5 ± 17.6 11.0 < 0.001
 LCX distal 27.0 ± 10.7 47.1 ± 17.3 11.2 < 0.001

CNR: (luminal CT values minus CT values of surrounding adipose tissue) divided by noise, SNR: luminal CT values divided by noise. CNR = contrast-to-noise ratio, SNR = signal-to-noise ratio

Table 4

Quantitative Analysis of Coronary Atherosclerotic Plaques between HIR and IMR Algorithms

kjr-20-729-i004
Measurement HIR IMR T value P
CT values of plaque (HU) 51 ± 34 58 ± 34 2.5 0.013
CT values of surrounding adipose tissue (HU) -95 ± 21 -100 ± 20 -2.1 0.037
Noise (HU) 12 ± 2 10 ± 2 -8.5 < 0.001
SNR 3.8 ± 2.2 5.5 ± 3.1 5.3 < 0.001
CNR 12.0 ± 3.6 16.0 ± 4.6 9.4 < 0.001

CNR: CT values of plaque minus CT values of adjacent epicardial adipose tissue divided by noise, SNR: CT values of plaque divided by noise.

TOOLS
Similar articles