

 PDF
PDF ePub
ePub Citation
 Print
Print


INTRODUCTION
Alzheimer disease (AD), the most common degenerative brain disease, is characterized by the accumulation of amyloid β (Aβ) and phosphorylated tau proteins in cerebral cortex1 which accompanying clinical symptoms of cognitive dysfunctions.2 Pathophysiologic change of deposition of Aβ fibrils can be detected by positron emission tomography (PET) using Aβ-specific ligand. And the increased brain burden of Aβ42 and tau proteins are suggested to be reflected by the decrement of Aβ42 and increased tau protein levels in cerebrospinal fluid (CSF).3 These measurements based on brain pathology have been recognized as an effective early diagnostic tool and recently incorporated into the diagnostic criteria of AD to increase the premortem accuracy of AD diagnosis.4 However, high cost of PET and inconvenience of lumbar puncture make it difficult for these to be widely used in clinical practice. Thus, to develop blood-based diagnostic biomarkers has been one of major concern in AD research field.5 As the increase of Aβ protein concentrations in brain and the decrease of Aβ42 in CSF are the characteristic in AD, its alterations in plasma had been expected to be useful in diagnosis of AD. However, many trials failed to demonstrate its significance due to controversial outcomes.6 The plasma amount of Aβ proteins is affected by numerous factors,78 such as age, sex, renal function, platelet count, plasma protein level,9 obesity,10 cerebral ischemia,11 and race.12 Further, plasma Aβ proteins are easily bound to other proteins and degraded in blood.13 Therefore, not correcting these variables in prior literatures would contribute to diminish the reliability of plasma Aβ concentration as diagnostic biomarker of AD to some extent. Recently we identified the significant rise of plasma Aβ40/Aβ42 ratio in young AD patients with clinical onset of AD less than 65 year-old14 after the correction of these variables. At that time we tried to compare the levels of CSF AD biomarkers with plasma Aβ proteins concentrations to understand the characteristics of plasma Aβ protein concentrations. However, it was done in small population, 32 of AD patients vs. 25 of controls. In current study, we aimed to explore the correlation repeatedly between the plasma and CSF AD biomarkers including more samples. Further, the subgroup analysis was newly performed within individual group to check if the correlation differs depending on diagnosis of AD.
METHODS
Subjects
For this study, 47 healthy control group who had no evidence of cognitive dysfunction or brain disease and 44 AD patients were enrolled from 2012 March to 2016 February from our institute. All subjects gave an agreement to participate in this study which was approved by institutional review board. When the clinical characteristics of patients were compatible with probable AD based on recent National Institute on Aging-Alzheimer's Association criteria, we diagnosed AD.15 All subjects underwent Korean version of Mini-Mental State Examination (K-MMSE),16 clinical dementia rating (CDR), CDR-sum of box (CDR-SOB), Seoul Neuropsychological Battery17 and brain magnetic resonance imaging (MRI). Brain MRI included T1 axial, T2 axial, fluid-attenuated inversion recovery imaging axial, gradient echo axial, and thin-slice (0.5–1 mm) T1 coronal series. All patients with brain structural lesions which were not compatible with AD were excluded. Control groups included patients who underwent lumbar puncture for various clinical purpose and showed normal findings in K-MMSE, CDR, CDR-SOB and neuroimaging (computed tomography in 27 and MRI in 20).
Plasma analysis
Blood sample was conducted after minimum fasting of 8 hours. All samples were collected with EDTA tube and centrifuged for 15 minutes at 2000×g at 4℃. Supernatants of centrifuged samples were dispensed at polypropylene frozen tube with screw cap (Sarstedt PP, 500 µL cat# 72.730.006; Sarstedt, Nümbrecht, Germany), and stored at -80℃. Before measuring the concentration of plasma biomarkers, samples were thawed at room temperature. Using double-antibody sandwich enzyme-linked immunosorbent assay (ELISA) kit (Wako Chemicals, Richmond, VA, USA), plasma Aβ40, Aβ42 proteins concentration were measured. Each sample was measured in duplicate and the mean level was used as final level.
CSF analysis
Spinal tapping was conducted at L3–4 or L4–5 between 8 AM and 10 AM. First 2 mL of CSF were used for routine analysis, cell count, and protein and glucose levels. Following 10–12 mL of CSF were collected with polypropylene collecting tube (BD Falcon, #352096; BD Biosciences, Bedford, MA, USA), and subsequently centrifuged for 10 minutes at 4000×g. 400 µL of supernatants were dispensed at polypropylene frozen tube with screw cap (Sarstedt PP, 500 µL cat# 72.730.006), and stored at -80℃. Samples were thawed just before the measurements of CSF biomarker level. Using commercially available INNOTEST ELISA kit (Fujirebio Diagnostics, Ghent, Belgium), Aβ42, tTau, and pTau181 levels were checked. All the process for collection and storage of CSF followed the agreed protocol.18 CSFAβ42, tTau, and pTau181 levels were check in duplicate. Additionally, CSF albumin level was measured with Bromocresol Green albumin assay kit (Sigma-Aldrich, St. Louis, MO, USA) and used for calculating CSF albumin (mg/dL)/plasma albumin (g/dL) ratio (albumin ratio).
Statistical analysis
All data were analyzed using SPSS statistic package, version 19.0 (SPSS Inc., Chicago, IL, USA). Because none of CSF AD biomarkers demonstrated normal distribution the logarithmic transformations was performed before the statistical analysis.19 The plasma Aβ protein levels showed normal distribution and these were used as raw data in statistics. t-test was used for group comparison of continuous variables, and chi-square test for categorical variables. Pearson's correlation coefficient was used to check the relationship between plasma and CSF parameters. Nonparametric Mann-Whitney test was used for analyzing albumin ratio since it showed skewed deviation even after logarithmic transformation. A p-value<0.05 was considered significant.
RESULTS
Demographic analysis
The demographic and laboratory characteristics according to diagnosis group are presented in Table 1. MMSE scores were significantly low (18.1±6.6 vs. 28.3±1.7 in AD vs. controls, p<0.001), while CDR (1.1±0.6 vs. 0.0±0.0, p<0.001) and CDR-SOB (5.5±4.0 vs. 0.0±0.0, p<0.001) scores were high in AD patients. Apolipoprotein E ε4 allele was more common in AD group [18 (41%) in AD vs. 10 (20%) in controls, p=0.040]. The age, gender distribution, the year of education, current history of diabetes mellitus and hypertension and familial history of dementia were comparable between the groups (in all, p≥0.05). The platelet count, and plasma protein and creatinine concentrations did not significantly differ (in all, p≥0.05).
Plasma Aβ protein level
There were no statistically significant differences in Aβ40 protein levels between AD patients and controls (p=0.17). However, plasma Aβ42 level was noticeably low in AD patients compared to controls (16.1±10.0 PM vs. 22.3±10.8 PM, p=0.007) (Table 2). And the Aβ40/Aβ42 ratio was much higher in AD patients than in controls (5.4±2.5 vs. 3.4±1.9, p<0.001). The CSF albumin concentrations did not differ between the groups (p=0.387), while its plasma levels were lower in controls (4.0±0.4 vs. 3.8±0.4, p=0.032). However, the albumin ratio (CSF albumin/plasma albumin) which reveals the integrity of blood-brain barrier20 rather tended to be higher in AD group (p=0.085).
Correlations between CSF AD biomarkers and plasma Aβ proteins
CSF Aβ42, tTau and pTau181 level are known useful as a biomarker of early diagnosis of AD.21 In consistent with the prior literature,212223 Aβ42 levels were markedly decreased (320.6±92.4 vs. 689.0±170.1 pg/mL, AD vs. controls, p<0.001), while tTau (520.9±209.7 vs. 204.4±62.4 pg/mL, p<0.001) and pTau181 levels (91.7±129.2 vs. 42.8±12.3 pg/mL, p<0.001) were much higher in AD subjects (Table 3).
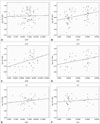
The correlations between plasma Aβ proteins and individual CSF AD biomarkers were computed in all participants (Table 4). The plasma Aβ42 levels revealed a significant positive correlation with those of CSF Aβ42 protein (r=0.364, p=0.001) (Fig. 1). However, there was no correlation in the other pair of plasma Aβ protein and CSF AD biomarkers. However, on subgroup analysis the control group demonstrated intimate relationship not only between plasma Aβ42 and CSF Aβ42 protein levels (r=0.339, p=0.023), but also between plasma Aβ40 and CSF Aβ42 protein concentrations (r=0.391, p=0.006). In contrast, within AD group, CSF Aβ42 levels did not reveal significant correlation with any of plasma Aβ protein levels (p=0.381 for Aβ40 and p=0.374 for Aβ42).
DISCUSSION
There have been several reports considering plasma Aβ42 levels as a possible diagnostic tool in AD,242526 however it remains controversial.527 In our prior investigation, the rise of plasma Aβ40/Aβ42 ratio was found useful for diagnosis of early-onset AD.19 Consistently, we confirmed it again in the this study which increased sample size, although the part of the current samples (20 in AD and 18 in controls) were the same ones which were used for the prior study.14 There have been controversy in the direction of change plasma Aβ protein levels in the presence of AD.527 However, in relation to the rise of plasma Aβ40/Aβ42 ratio recent literatures support it as consistent a finding in AD.825
Technical limitations of measuring level of Aβ protein are more conspicuous in plasma than CSF. It is attributed to that lower quantity of Aβ protein in plasma and its high tendency to bind with other protein.28 In this study, plasma protein and creatinine level showed no differences between AD group and controlled group. However, plasma albumin level was slightly higher in AD group. Because plasma albumin is the binding target for Aβ protein, the possibility that increased level of albumin affected the lower plasma Aβ42 level in AD patients cannot be excluded. However, it might be less likely based on the following. The result of this study corresponds to previous studies14 and the extent of decrease of plasma Aβ42 was more remarkable (p=0.007) compared to the slight increase of plasma albumin level (p=0.032). Core pathophysiology of AD is rise of Aβ protein burden in brain.29 Thus, it is possible that the alteration in plasma Aβ protein level in AD patient is related to the increase of Aβ proteins in AD brain. In current study the correlation between plasma Aβ42 and CSF Aβ42 was identified in overall subjects. It is in agreement with our previous study, in which we checked the correlation not dividing the subjects according to the diagnosis. However when we did subgroup analysis, the positive correlation was persistent only in controls. Further, the additional correlation between plasma Aβ40 proteins and CSF Aβ42 concentrations was identified significant in control group. It is contrast to AD group, where there was no correlation between plasma Aβ protein and CSF Aβ42 protein. It is consistent with the previous reports which described minor or no correlation between plasma and CSF Aβ proteins levels in AD patients.11303132 Therefore, it is suggested that the loss of correlation between CSF and plasma Aβ protein concentrations might be related to the development of AD. Although it did not reach significant level (p=0.085), the diminished blood-brain integrity, increased albumin ratio, was suspected AD group. It might be possible mechanism underlying loss of correlation between plasma Aβ40 (or 42) and CSF Aβ42 protein concentrations. However, we are very cautious about our result because the current study is based on the small population. The following study is necessary to confirm our result and to elucidate underlying mechanism.
In conclusion, this study demonstrated the decrease in plasma Aβ42 level and the increase in Aβ40/Aβ42 ratio in AD patients. Furthermore, the apparent correlation of plasma Aβ level and CSF Aβ42 only presented in control subjects, not in AD group, which suggests that decrease of correlation of CSF-plasma Aβ proteins may be related to the pathology of AD.


 XML Download