

 PDF
PDF Citation
 Print
Print


INTRODUCTION
The triage used in the healthcare field refers to the distribution of medical resources to patients, and the types are as follows: emergency department (ED) triage, inpatient (intensive care unit) triage, incident (multi-casualty) triage, military (battlefield) triage, and disaster (mass casualty) triage.1 ED triage is meant to distinguish urgent patients from others and to give their treatment priority. That is, the most urgent patients are treated first while the less urgent patients are treated on a first-come, first-served basis. Globally, ED triage systems are available at various levels, such as 3-level, 4-level or 5-level, but in many countries the 5-level systems are gaining more acceptance because they are more reliable.23 The 5-level systems include: the Emergency Severity Index (ESI), developed in the United States; the Manchester Triage Scale (MTS), from the United Kingdom; the Canadian Triage and Acuity Scale (CTAS), from Canada; and the Australasian Triage Scale (ATS), from Australia.456
In the past, emergency medical centres in Korea have used various types of ED triage tools, which can be divided into the 3 following categories.7 First, there have been methods used internationally, such as the ATS, CTAS and ESI. Second, there has been a method for distinguishing between 2 levels, emergency vs. non-emergency, based on the emergent symptoms specified in Korean emergency medical law. Finally, there is a way to rely solely on the subjective judgment of triage practitioners without verifying their validity or reliability. About 10% of emergency medical institutions have not had any type of triage tool. Among the tools, only the validity of the ones used internationally has been verified, to some extent, while the validity or reliability of the other methods has not been verified. Until recently, about 70% of Korean emergency medical institutions have used triage tools whose validity or reliability is unclear; therefore, it is questionable whether they can achieve the goals of triage.
The Korean Society of Emergency Medicine (KSEM) recognized the need to develop a standardized triage tool to avoid the complexity and ambiguity of the ED triage systems previously used. Therefore, the KSEM developed the Korean Triage and Acuity Scale (KTAS) in 2012. It was based on the CTAS after a slight modification considering the medical environment in Korea. The KTAS is very similar to the CTAS; it is not only similar in the process of assessing acuity but is also composed of 5 levels, as follows: level 1, Resuscitation; level 2, Emergent; level 3, Urgent; level 4, Less Urgent; and level 5, Non-Urgent (Supplementary Fig. 1 and Supplementary Table 1). Thereafter, the KSEM confirmed its validity and reliability through contracted research commissioned by the Ministry of Health and Welfare in Korea. In 2016, the Ministry of Health and Welfare in Korea legislated all emergency medical institutions to introduce the KTAS, and the national health insurance service (NHIS) in Korea established an emergency medical payment system based on the KTAS.89 This system by the NHIS has 2 characteristics. One is direct compensation for performing triage using the KTAS. The other is to pay a higher medical fee by assigning a relative weight to the basic medical fee according to the degree of acuity and severity based on the level of the KTAS. The NHIS pays about USD 3.3 per emergency patient to emergency medical institutions in compensation for performing the KTAS itself. To simplify the classification of emergency patients, the Ministry of Health and Welfare reconfigured the 5-level KTAS without providing any concrete evidence that a 3-level triage tool might be more convenient for administrative work. Level 1 and 2 were reassigned as “severely emergent patients,” level 3 was renamed “severely emergent suspected patients,” and level 4 and 5 were reclassified as “mild emergent or non-emergent patients.” Furthermore, the NHIS pays a weighted fee only for “severely emergent patients” and “severely emergent suspected patients,” and not for “mild emergent or non-emergent patients,” resulting in an actual classification of emergency patients into 2 levels. The triage tools used in emergency centres are known to be more efficient as the number of their levels is higher, and 5-level triage tools are commonly used worldwide.123 However, the Korean Ministry of Health and Welfare and the NHIS have reduced the number of their levels, contrary to this trend. As mentioned earlier, the primary role of a triage tool is to distribute medical resources appropriately, according to the acuity and severity of emergency patients and to deploy them to the appropriate treatment areas. The actions of these 2 administrative agencies have improved the convenience of administrative work, but they may have violated the primary role of the triage tool, even if unintentionally. Thus, it is necessary to assess the validity of those actions, which forcibly reduced the level number of the triage tool from 5-levels to 3-levels, or even 2-levels. The study was conducted to evaluate the association between the decrease in the level number of the triage tool and any change in its relative importance in ED disposition.
METHODS
Study design and settings
This study was a registry-based, retrospective cohort study and it was conducted at 3 regional emergency medical centres affiliated with academic university hospitals in Busan and Gyeongnam, Korea. The area has a population of about 6 million people. The hospitals are secondary or tertiary medical centres with 700–1,500 beds with annual ED visits from 35,000 to 45,000 patients. This study was based on the registry of the National Emergency Department Information System (NEDIS) ver. 3.1, operated by National Emergency Medical Center (NEMC), which prospectively collects data, including demographic and baseline clinical characteristics of emergency patients, from all emergency medical institutions in Korea. Since 2016, it has become mandatory for all emergency medical institutions in Korea to adopt the registration system based on the NEDIS ver. 3.1, which is used to evaluate emergency medical institutions and the payment system of medical fees.10 Regional emergency medical centres have been forced to input data, related to the NEDIS registration system, by medical staff and administrative officers and to hire coordinators to manage the data through self-monitoring and feedback from the NEMC. These centres are also forced to perform the KTAS by triage practitioners trained in the KSEM. The 3 centres participating in this study have nurses or paramedics to perform triage using the KTAS after completing a 6-hour training program, run by the KTAS committee under the KSEM (http://www.ktas.org/education/info.php). To be eligible for becoming a trainee, a person has to be a doctor, nurse or paramedic, with at least 1 year of experience in the ED. The training program consists of pre-testing, theoretical education, case reviewing, discussion and post-testing. The certificate is issued only if the post-test score is 70 or higher, and it must be renewed every 4 years through a re-training program. After the new triage system was introduced, the triage practitioners in 2016 had little experience and had difficulty communicating with other parts of the ED. However, since 2017, these problems have been almost entirely resolved and the triage system using the KTAS has stabilized.
Data collection and management
The NEMC is required to disclose NEDIS registration data to all researchers, but there is a set time limit to ensure the reliability of the data; as a result, at the time of application any data from the previous year or before are not allowed to be disclosed. Therefore, the authors were unable to obtain data from the NEMC for the study period. The registry of the NEDIS ver. 3.1 consists of data from consecutive emergency patients, which was transmitted electronically for review from the 3 participating hospitals to the NEMC in real time from March 2017 to October 2017. The following cases were excluded from analysis: those involving a retraction of treatment, discharge against medical advice, taking leave without notice, visit for certificate issuance or administrative procedure, misdescription, or dropping out. The registry data consist of about 60 input items, which can be divided based on the following factors: the demographics include name, birth date, identification number, address, insurance, age, and gender; the baseline characteristics include onset time, visit time, chief complaint, the KTAS level, ICD-10 based diagnosis, and ED disposition. The following variables were collected from the registry for analysis: age, gender, hospital name, type of insurance, mode of transport, decision maker of ED visit, time of onset, arrival time, KTAS assessment time, disease or injury, and ED disposition. From the time variables, 2 composites, onset-arrival and onset-KTAS durations, were calculated and analysed. To simplify analysis, variables with too many categories were reclassified into 3 or fewer. For example, originally, ED dispositions, which comprised nearly 30 categories, were reclassified into only 3: “discharge,” “transfer to other hospitals,” and “admission.” Deaths in the ED were reclassified into the category of “admission” rather than being considered “discharge” or excluded from the analysis, because they were cases that required intensive care. Continuous variables were converted to categorical variables, either by rounding up or down, whichever was appropriate after reaching the cut-off values, using the optimal binning method of the SPSS statistical software based on the reference variable, ED disposition. If the number of categories was 4 or more, it was reduced to 3 or fewer through a proper integration of the categories.
Predictors
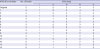
The KTAS and its variants were made by reconfiguring KTAS levels. The reconfiguration of KTAS levels was based on one principle. Considering the nature of the triage tool, the level reorganization was not allowed to integrate distant levels; integration was only permitted between adjacent levels. For example, the integration of levels 1 and 2 was allowed, but the integration of levels 1 and 3 was not. Through this reconstruction process, a total of 14 KTAS variants, which could be combined, were derived (Table 1).
Table 1
KTAS and its levelling down through reconfiguring
![]()
Covariates
The covariates included but were not limited to: demographics, such as age and gender, and baseline characteristics, such as arrival time, visiting hospital, type of insurance, mode of transport, decision maker of visit, disease or injury, emergency symptom as specified in the Korean emergency medical law, and duration of onset-arrival.
Primary outcome
The primary outcome concerns the relative importance rates of the KTAS, its variants and other covariates. They were derived from a multinomial logistic regression model that used the ED disposition as the dependent variable, keeping other variables independent.
Statistical analyses
Because the dependent variable, ED disposition, was a multinomial categorical variable, for the univariable analysis, a χ2 test was performed when the independent variable was categorical, and an analysis of variance, or a Mann-Whitney U test, was performed when the independent variable was continuous. Using the backward elimination method, a multinomial logistic regression model (KTAS_0) was constructed of the KTAS original and covariates that were significant in the univariable analysis. Additionally, 14 multinomial logistic regression models (KTAS_1 to KTAS_14) were then constructed, which included 1 of the KTAS variants as well as the covariates.
Finally, to analyse the relative importance of the independent variables on the outcome variable, ED disposition, in each regression model, dominance analyses were performed using Luchman's method.11 That is, if the number of independent variables in each regression model was p, then (2p-1) reduced regression models were constructed for each one. The p within-order averages, or the conditional dominance statistics, of each variable were derived using subsets of McFadden's R2 obtained from each reduced regression model. To illustrate, considering independent variable X1, the p within-order averages related to X1 are computed as

Within-order average 2: C2x1= {(R2y~x1+x2 - R2y~x2)+(R2y~x1+x3 - R2y~x3)+(R2y~x1+x4 - R2y~x4)+...(R2y~x1+xp - R2y~xp) }(p−12−1)
Within-order average 3: C3x1= {(R2y~x1+x2+x3 - R2y~x2+x3)+(R2y~x1+x2+x4 - R2y~x2+x4)+(R2y~x1+x3+x4 - R2y~x3+x4)+...+(R2y~x1+x(p-1)+xp - R2y~x(p-1)+xp)}(p−13−1)

Then, the general dominance statistic of each variable was obtained by summing the conditional dominance statistics. Thereafter, the total amount of the general dominance of the variables included in each regression model was obtained, and the relative importance rate was calculated by dividing the general dominance statistic of each variable by the total amount. Using a generalized linear model, the authors compared the general dominance and the relative importance of the KTAS original and its variants and analysed the interaction effect caused by the decrease in the number of levels. Statistical analyses were performed using IBM SPSS statistics ver. 24.0 (IBM Corp. Armonk, NY, USA) with a significance threshold of α = 0.05 (two-tailed). The dominance statistics were calculated from McFadden's R2 using Microsoft Excel 2016.
RESULTS
A total of 85,501 patients were enrolled in the NEDIS registry at the 3 participating hospitals during the study period. Of them, 79,771 were included in the analysis after 5,730 people were excluded for various reasons (Fig. 1). A total of 12 variables, from the demographics and clinical characteristics, were significantly related to ED disposition in the univariable analysis. They were age, gender, hospital, type of insurance, mode of transport, decision maker of ED visit, arrival time, disease vs. injury, emergency symptom, onset-arrival duration, onset-KTAS duration, and KTAS level. Using multinomial logistic regression analysis, the original model (KTAS_0) including the KTAS original and 8 covariates was derived (Table 2). Based on model KTAS_0, 14 additional models were constructed by replacing the KTAS original with its variants; these were named KTAS_1 through KTAS_14 in the order shown in Table 1. Since model KTAS_0 had 9 independent variables, 511 reduced models were constructed to obtain the conditional dominance statistics for each variable, which were derived by averaging the 9 within-order subsets (C1-C9) of their R2s. The conditional dominance statistics are illustrated in Fig. 2. Two variables, the KTAS original and the decision maker of ED visit, overwhelmingly had the largest conditional dominance statistics, more than twice those of the others (P < 0.001). Except for C1 and C2, the KTAS original had the largest conditional dominance statistics. Therefore, its general dominance statistics were also the greatest, which means that the KTAS may be a more important predictor of ED disposition than the subjective decision making of a physician from another hospital or a department's recommendation for an ED visit. Likewise, the conditional dominance statistics were derived for the other models with KTAS variants, from KTAS_1 to KTAS_14. The general dominance statistics and relative importance rates for the variables, included in each model, were obtained and are illustrated in Fig. 3A and Fig. 3B, respectively.
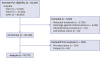
Table 2
Results of adjusted analysis between KTAS original and emergency department disposition, using multinomial logistic regression analysis
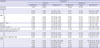
OR = odds ratio, CI = confidence interval, NHIS = national health insurance service in Korea, KTAS = Korean Triage and Acuity Scale.
Reference categories for each variable were: adischarge, bC, c> 70, dwomen, eothers, fothers, gphysicians from other hospitals or outpatient departments, h> 24, iday (08-18), and j5, respectively. kIncluded patients themselves, emergent medical technicians, policemen, etc., except physicians.
![]()
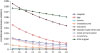 | Fig. 2Conditional dominance statistics of variables in model with the KTAS. After a total of 511 multinomial logistic regression models were constructed through a combination of the KTAS original and covariates, the conditional dominance statistics of each variable were derived from averaging the 9 within-order subsets (C1–C9) of their R2s. Overall, the values tended to decrease as the order placement rose. Among the variables, both the KTAS original and the decision maker of ED visit had more than twice as high values as the other variables.KTAS = Korean Triage and Acuity Scale, ED = emergency department.
|
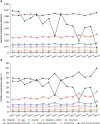 | Fig. 3General dominance and relative importance in various models with the KTAS and its variants. (A, B) General dominance statistics and relative importance rates for each variable in various models, which were constructed with covariates and the KTAS original and its variants. (A) The values of all covariates show a constant pattern regardless of the type of model; however, the KTAS was vulnerable to changes in the type of model (P < 0.001). (B) The values of the KTAS show the same pattern as (A), but the other variables show corresponding values as the number of the KTAS model increases (P < 0.001).KTAS = Korean Triage and Acuity Scale, ED = emergency department.
|
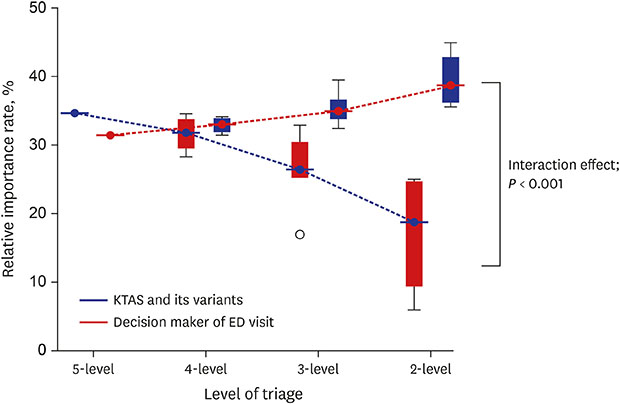
In general dominance analyses, the values of all covariates showed a constant pattern, regardless of the type of model (Fig. 3A). However, the KTAS was vulnerable to changes in the number of levels, and the smaller the number of levels, the smaller the value (P < 0.001). The interaction effect, between number of triage levels in the KTAS and other covariates, was more pronounced at the relative importance rate (Fig. 3B). While the values of all covariates tended to be larger for smaller triage levels, only the KTAS showed the opposite pattern (P < 0.001). Table 3 shows the change in general dominance and relative importance according to the decrease of the KTAS level. Overall, those 2 statistic indices, for all KTAS variants at 4 or fewer levels, tended to decrease compared to the KTAS original, which is the 5-level triage tool; however, the reduction was negligible in a few of them, such as the variant in the model KTAS_1. This tendency was particularly pronounced at lower levels. The median general dominance statistics at 4-level, 3-level and 2-level were relatively decreased by 4.0%, 9.6% and 17.2%, respectively, compared with 5-level (P = 0.016). On the other hand, the median relative importance rates for 4-level, 3-level and 2-level were relatively decreased by 8.6%, 24.1% and 46.3%, respectively, compared to 5-level (P = 0.016). The decreasing tendency of these 2 statistic indices had a significant difference, indicating that the relative importance is more affected by the decrease in the number of level (P < 0.001). Moreover, a comparison of the 2 major variables with the highest relative importance rate resulted in the KTAS being ranked higher than the decision maker of ED visit in the 5-level; however, the ranking was reversed at the level of 4 or lower as shown in Fig. 4 (P < 0.001).
Table 3
General dominance statistics and relative importance rates for the Korean Triage and Acuity Scale and its variants

![]()
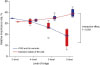 | Fig. 4Relative importance of 2 major variables with decreasing number of triage levels. Comparing the 2 major variables with the highest relative importance rates, the value of the KTAS decreased correspondingly as the level number decreased while the decision maker of ED visit tended to increase as the number of triage levels decreased (P < 0.001).KTAS = Korean Triage and Acuity Scale, ED = emergency department.
|
DISCUSSION
A recent study comparing before and after applying the KTAS showed not only reduced lengths of stay and mortality in the ED, but also positively affected ED dispositions.12 A recent study also reported that the percentages, admission rates, and lengths of stay at each level of the KTAS were similar to those of the ESI.13 It has also been reported that the KTAS had good validity as well as a substantial inter-rater agreement (weighted κ = 0.721).14 The above results, albeit presented in single-centre studies, seem to show the KTAS has reasonable validity and reliability.
When there are a number of variables that affect an outcome variable, such as in a multiple regression model, researchers often want to measure their importance and rank them accordingly.15 Since relative importance analysis was developed to satisfy this desire, it quantifies the proportionate contribution of multiple predictors correlated to each other within a selected regression model.11 To date, various approaches have been proposed to evaluate relative importance. Of those, 2 of the most outstanding are known as general dominance analysis and relative weight analysis.1617 Initially, the dominance analysis was applied only to the regression model, but recently it was extended to the logistic regression model, whether the outcome variable was binary or multicategory.1118 In this study, ED disposition, which is a dependent variable, was a multicategory variable of 3 levels; therefore, the authors performed a dominance analysis using the method proposed by Luchman.
Assuming a regression model consisting of p independent variables, the relative importance is the proportional contribution of an independent variable to the R2 of the model considering conditions—that is, both its direct and indirect effects. Its direct effect indicates only a simple correlation with a dependent variable without adjusting the correlation with the other independent variables. Its indirect effect, meanwhile, indicates the effect combined with the other (p-1) independent variables in the statistical model. As described in the Methods section, the direct effect (C1) can be easily obtained by the simple regression model, but the indirect effects can be obtained from complex calculations—that is, the C2 - Cp within-order averages derived from the combination of p variables. The large order means that there are as many variables to be adjusted. In this study, the conditional relative importance of C1 and C2 in the KTAS was smaller compared to the decision maker of ED visit, but the conditional relative importance of C3 or higher was larger. This implies that KTAS has a higher relative importance as the correlation with more independent variables is taken into account.
A total of 9 variables were significant predictors of ED disposition in this study. However, 2 variables, the KTAS original and the decision to recommend a visit to the ED by a physician from another medical institution or outpatient department, had relative importance rates of 30% or more and were at least twice as important as the other predictors. It was particularly surprising that the KTAS original had a higher relative importance than the medical opinion of a physician, even if he or she did belong to another hospital or department. This outcome seems to be due to the difference in reliability. The KTAS is a triage tool that is based on a lot of objective data, like the CTAS, whereas a physician's opinion varies widely with his own subjectivity, even though he is an expert in medicine. However, the superiority of the KTAS disappeared in proportion to the decrease in the number of levels. Compared to the relative importance rate of the original 5-level, the 3-level and 2-level were reduced by a quarter and half, respectively, while those of the other predictors, especially, the decision maker of ED visit, rose. Eventually, at these 2 levels, the rankings between the KTAS and the decision maker of ED visit were reversed. This finding indicates that the KTAS is the most important predictor of ED disposition only at its original level, 5-level. The result is similar to that of a study, in which the 5-level triage was superior to the 3-level triage.2 Meanwhile, the NHIS in Korea has reduced the levels of the KTAS from 5 to 2 in order to facilitate the calculation of medical costs; that is, the model KTAS_13 reduces the relative importance rate for ED disposition to 25% and results in a relative decrease of 28% compared to the original rate of 35%. ED disposition may be an indicator of medical resource utilization since more equipment, personnel and facilities will be needed when a patient is transferred or hospitalized compared to when he or she is discharged. The study's results mean that the primary role of the triage tool to distribute medical resources adequately to patients may be compromised by reducing the number of its levels. Therefore, it is not reasonable to attempt to reduce arbitrarily the number of levels for other purposes, such as administrative convenience.
This study had several limitations. Currently, there are more than 30 regional emergency medical centres in Korea, but only 3 institutions participated in this study, which may limit the generalizability of the results. Although the participating institutions are geographically adjacent regional emergency medical centres that have jurisdiction over the treatment of emergent patients in a broad area of about 6 million people, selection bias may exist since they participated in this study non-randomly. Meanwhile, one of the significant predictors of ED disposition in the present study was the hospital, which means the 3 hospitals that participated in the study were different from each other in the medical environment. This point suggests that the study may have an external validity as high as the heterogeneity of the participating hospitals. This study could have the type of shortcomings often observed in retrospective research since it was based on the NEDIS registry system ver. 3.1. However, the NEDIS registry data is likely to have little bias, often associated with retrospective studies, since the quality control for the data was performed based on daily self-monitoring by the coordinator from the institution and frequent feedback from the NEMC.
 XML Download