

 PDF
PDF ePub
ePub Citation
 Print
Print


Abstract
Background
Methods
Results
Figures and Tables
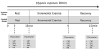 | Figure 1Experimental procedures.Abbreviations: CBF, cerebral blood flow; EEG, electroencephalography; HR, heart rate; SaO2, arterial oxygen saturation.
|
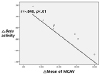 | Figure 2Correlation between changes in mean flow velocity of middle cerebral artery (MCA) and changes in Beta activity for resting 15 minutes after hypoxic exposure. P values are calculated by Pearson correlation analysis. r represents a negative correlation of changes in mean flow velocity of MCA and changes in Beta activity.
|

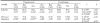
Table 2
Changes of cerebral blood flow velocity in the middle cerebral artery
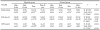
Values are presented as mean±standard deviation.
F values are calculated by two-way repeated-measures ANOVA.
Abbreviations: EDV, maximum end-diastolic velocity; G, group; Mean, mean flow velocity; Peak, peak systolic velocity; T, time.
aSignificantly different from rest (P<0.05).
bSignificantly different from control group (P<0.05).
cSignificantly different from control group (P<0.01).
dSignificantly different from control group (P<0.001).
![]()
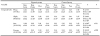
Table 4
Changes of arterial oxygen saturation and heart rate
Values are presented as mean±standard deviation.
F values are calculated by two-way repeated-measures ANOVA.
Abbreviations: G, group; SaO2, arterial oxygen saturation; T, time.
aSignificantly different from rest (P<0.05).
bSignificantly different from control group (P<0.05).
cSignificantly different from control group (P<0.01).
dSignificantly different from control group (P<0.001).
![]()
 XML Download