Abstract
Purpose:
To develop a new diffusion-based functional MRI (fMRI) sequence to generate apparent diffusion coefficient (ADC) maps in single excitation and evaluate the contribution of b0 signal on neuronal changes.
Materials and Methods:
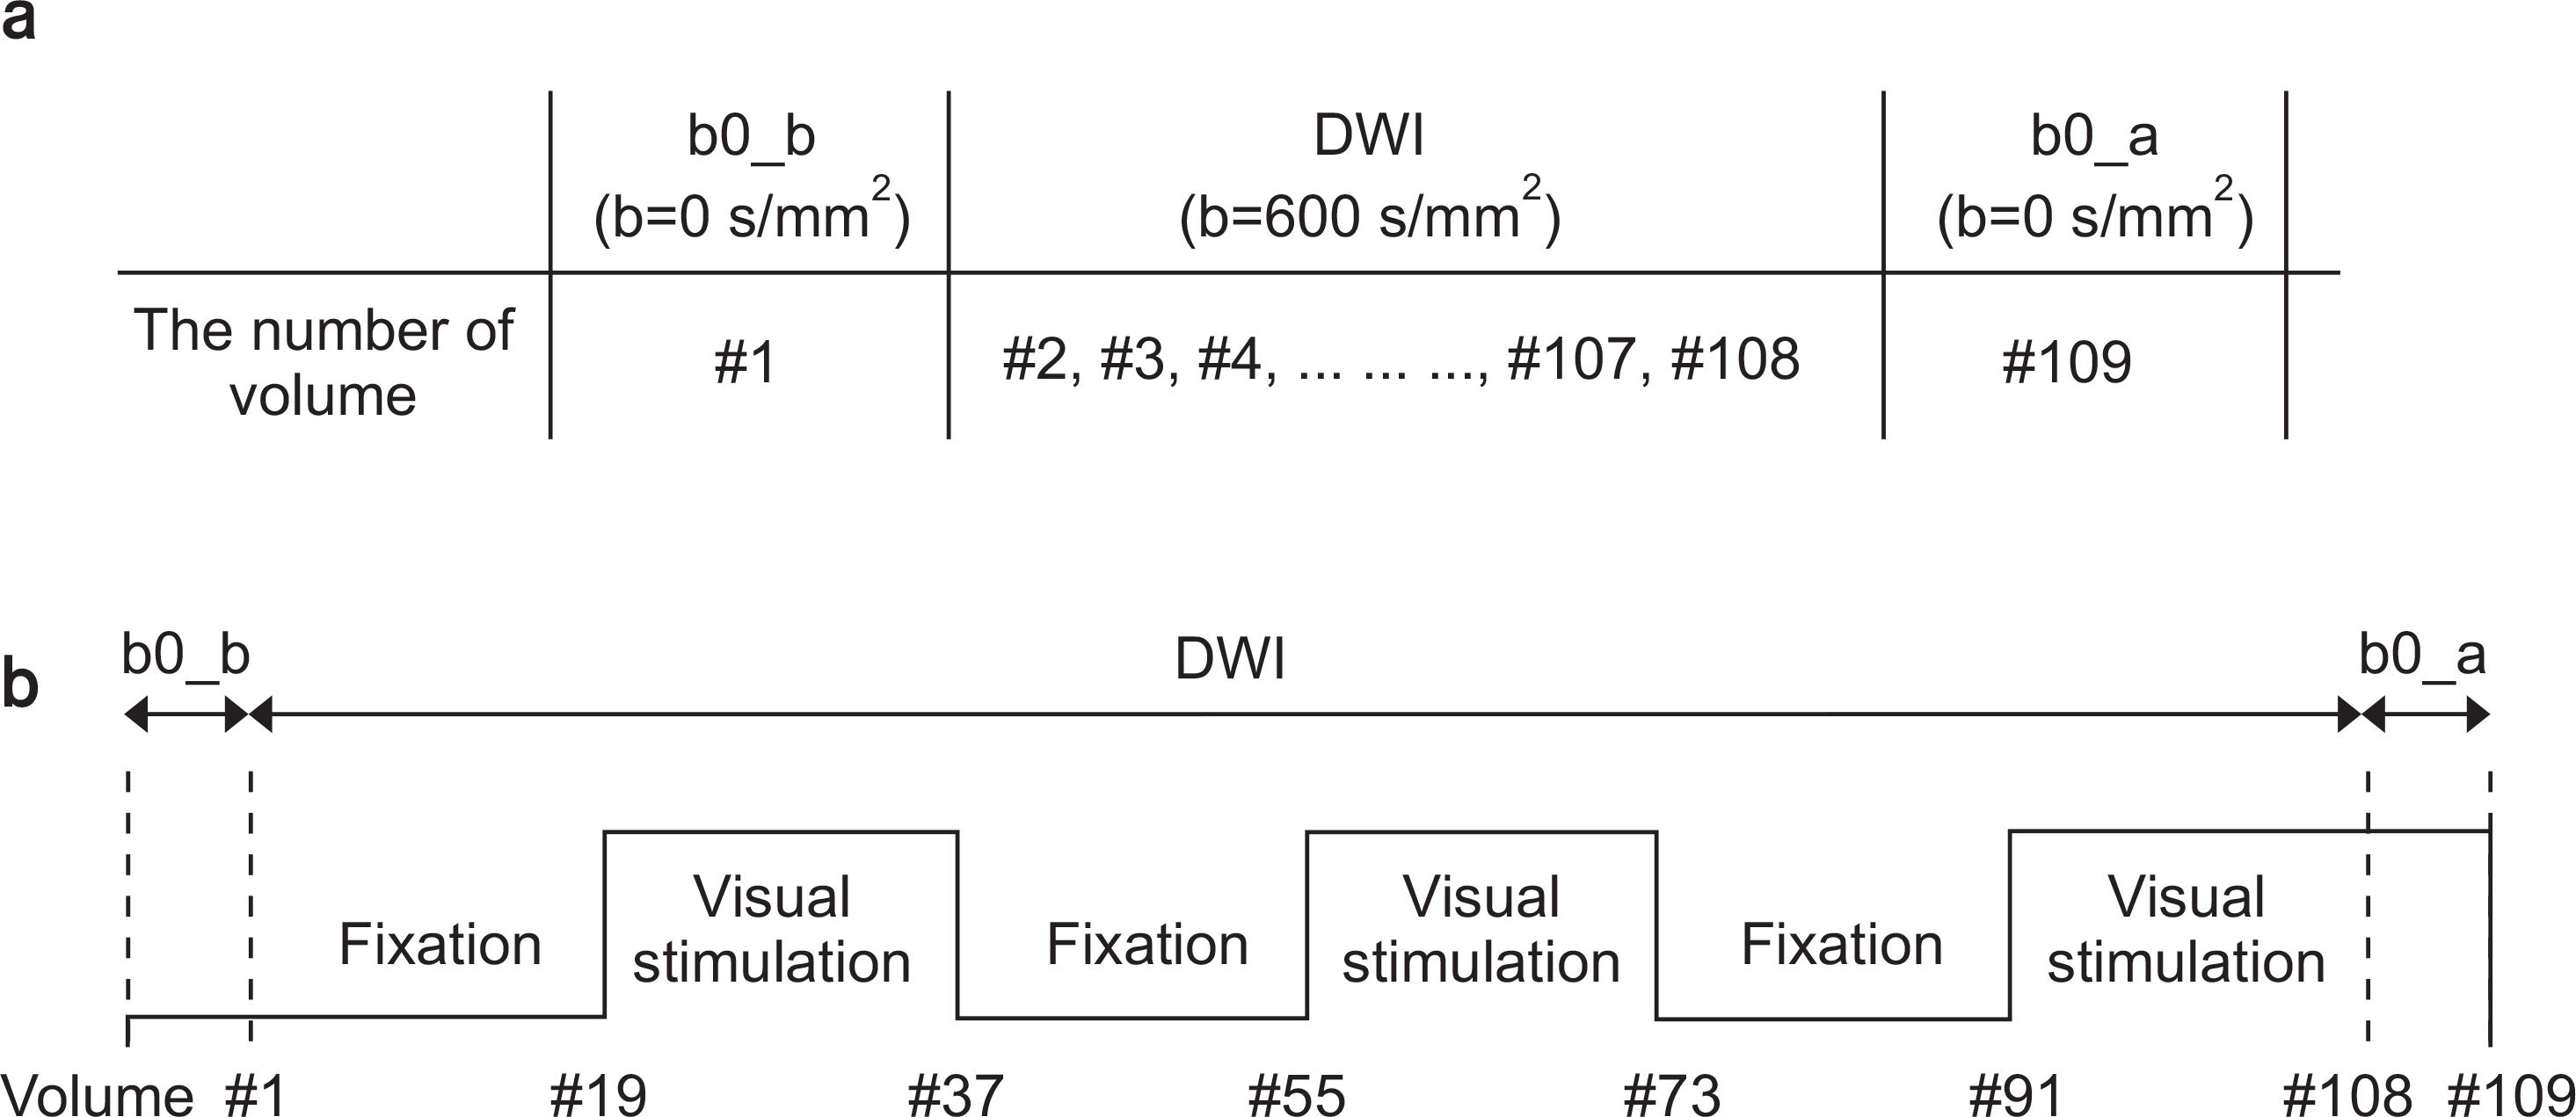
A diffusion-based fMRI sequence was designed with single measurement that can acquire images of three directions at a time, obtaining b = 0 s/mm2 during the first baseline condition (b0_b), followed by 107 diffusion-weighted imaging (DWI) with b = 600 s/mm2 during the baseline and visual stimulation conditions, and another b = 0 s/mm2 during the last activation condition (b0_a). ADC was mapped in three different ways: 1) using b0_b (ADC_b) for all time points, 2) using b0_a (ADC_a) for all time points, and 3) using b0_b and b0_a (ADC_ba) for baseline and stimulation scans, respectively. The fMRI studies were conducted on the brains of 16 young healthy volunteers using visual stimulations in a 3T MRI system. In addition, the blood oxygen level dependent (BOLD) fMRI was also acquired to compare it with diffusion-based fMRI. A sample t-test was used to investigate the voxel-wise average between the subjects.
Go to : 
REFERENCES
1.Darquie A., Poline JB., Poupon C., Saint-Jalmes H., Le Bihan D. Transient decrease in water diffusion observed in human occipital cortex during visual stimulation [published online ahead of print 2001/07/19]. Proc Natl Acad Sci U S A. 2001. 98(16):9391–9395.
2.Roy CS., Sherrington CS. On the Regulation of the Blood-supply of the Brain [published online ahead of print 1890/01/01]. J Physiol. 1890. 11(1-2):85–158.
3.Bandettini PA., Wong EC., Hinks RS., Tikofsky RS., Hyde JS. Time course EPI of human brain function during task activation [published online ahead of print 1992/06/01]. Magn Reson Med. 1992. 25(2):390–397.
4.Kwong KK., Belliveau JW., Chesler DA, et al. Dynamic magnetic resonance imaging of human brain activity during primary sensory stimulation [published online ahead of print 1992/06/15]. Proc Natl Acad Sci U S A. 1992. 89(12):5675–5679.
5.Ogawa S., Tank DW., Menon R, et al. Intrinsic signal changes accompanying sensory stimulation: functional brain mapping with magnetic resonance imaging [published online ahead of print 1992/07/01]. Proc Natl Acad Sci U S A. 1992. 89(13):5951–5955.
6.Le Bihan D. Molecular diffusion, tissue microdynam-ics and microstructure [published online ahead of print 1995/11/01]. NMR Biomed. 1995. 8(7-8):375–386.
7.Latour LL., Svoboda K., Mitra PP., Sotak CH. Time-dependent diffusion of water in a biological model system [published online ahead of print 1994/02/15]. Proc Natl Acad Sci U S A. 1994. 91(4):1229–1233.
8.Bae MS., Jahng GH., Ryu CW., Kim EJ., Choi WS., Yang DM. Effect of intravenous gadolinium-DTPA on diffusion tensor MR imaging for the evaluation of brain tumors [published online ahead of print 2009/07/29]. Neuroradiology. 2009. 51(12):793–802.
9.Jahng GH., Xu S. Local susceptibility causes diffusion alterations in patients with Alzheimer's disease and mild cognitive impairment [published online ahead of print 2012/03/15]. Brain Imaging Behav. 2012. 6(3):426–436.
10.Le Bihan D., Urayama S., Aso T., Hanakawa T., Fukuyama H. Direct and fast detection of neuronal activation in the human brain with diffusion MRI [published online ahead of print 2006/05/17]. Proc Natl Acad Sci U S A. 2006. 103(21):8263–8268.
11.Song AW., Guo H., Truong TK. Single-shot ADC imaging for fMRI [published online ahead of print 2007/01/30]. Magn Reson Med. 2007. 57(2):417–422.
12.Stejskal EO., Tanner JE. Spin Diffusion Measurements: Spin Echoes in the Presence of a Time-Dependent Field Gradient. J Chem Phys. 1964. 42(1):

13.Lancaster JL., Tordesillas-Gutierrez D., Martinez M, et al. Bias between MNI and Talairach coordinates analyzed using the ICBM-152 brain template [published online ahead of print 2007/02/03]. Hum Brain Mapp. 2007. 28(11):1194–1205.
14.Friston K., Holmes AP., Worsley KJ., Poline JB., Frith CD., Frackowiak RS. Statistical parametric maps in functional imaging: A general linear approach. Human Brain Mapping. 1995. 2:189–210.

15.Talairach J., Tournoux P. Co-planar Stereotaxic Atlas of the Human Brain. Thieme. 1988.
16.Nicolas R., Gros-Dagnac H., Aubry F., Celsis P. Comparison of BOLD, diffusion-weighted fMRI and ADC-fMRI for stimulation of the primary visual system with a block paradigm. Magn Reson Imaging. 2017. 39:123–131.

17.Williams RJ., Reutens DC., Hocking J. Influence of BOLD Contributions to Diffusion fMRI Activation of the Visual Cortex. Frontiers in neuroscience. 2016. 10:279.

18.Zhong J., Kennan RP., Fulbright RK., Gore JC. Quantification of intravascular and extravascular contributions to BOLD effects induced by alteration in oxygenation or intravascular contrast agents [published online ahead of print 1998/10/15]. Magn Reson Med. 1998. 40(4):526–536.
19.Jahng GH., Weiner MW., Schuff N. Diffusion anisotropy indexes are sensitive to selecting the EPI readout-encoding bandwidth at high-field MRI [published online ahead of print 2008/04/19]. Magn Reson Imaging. 2008. 26(5):676–682.
Go to : 
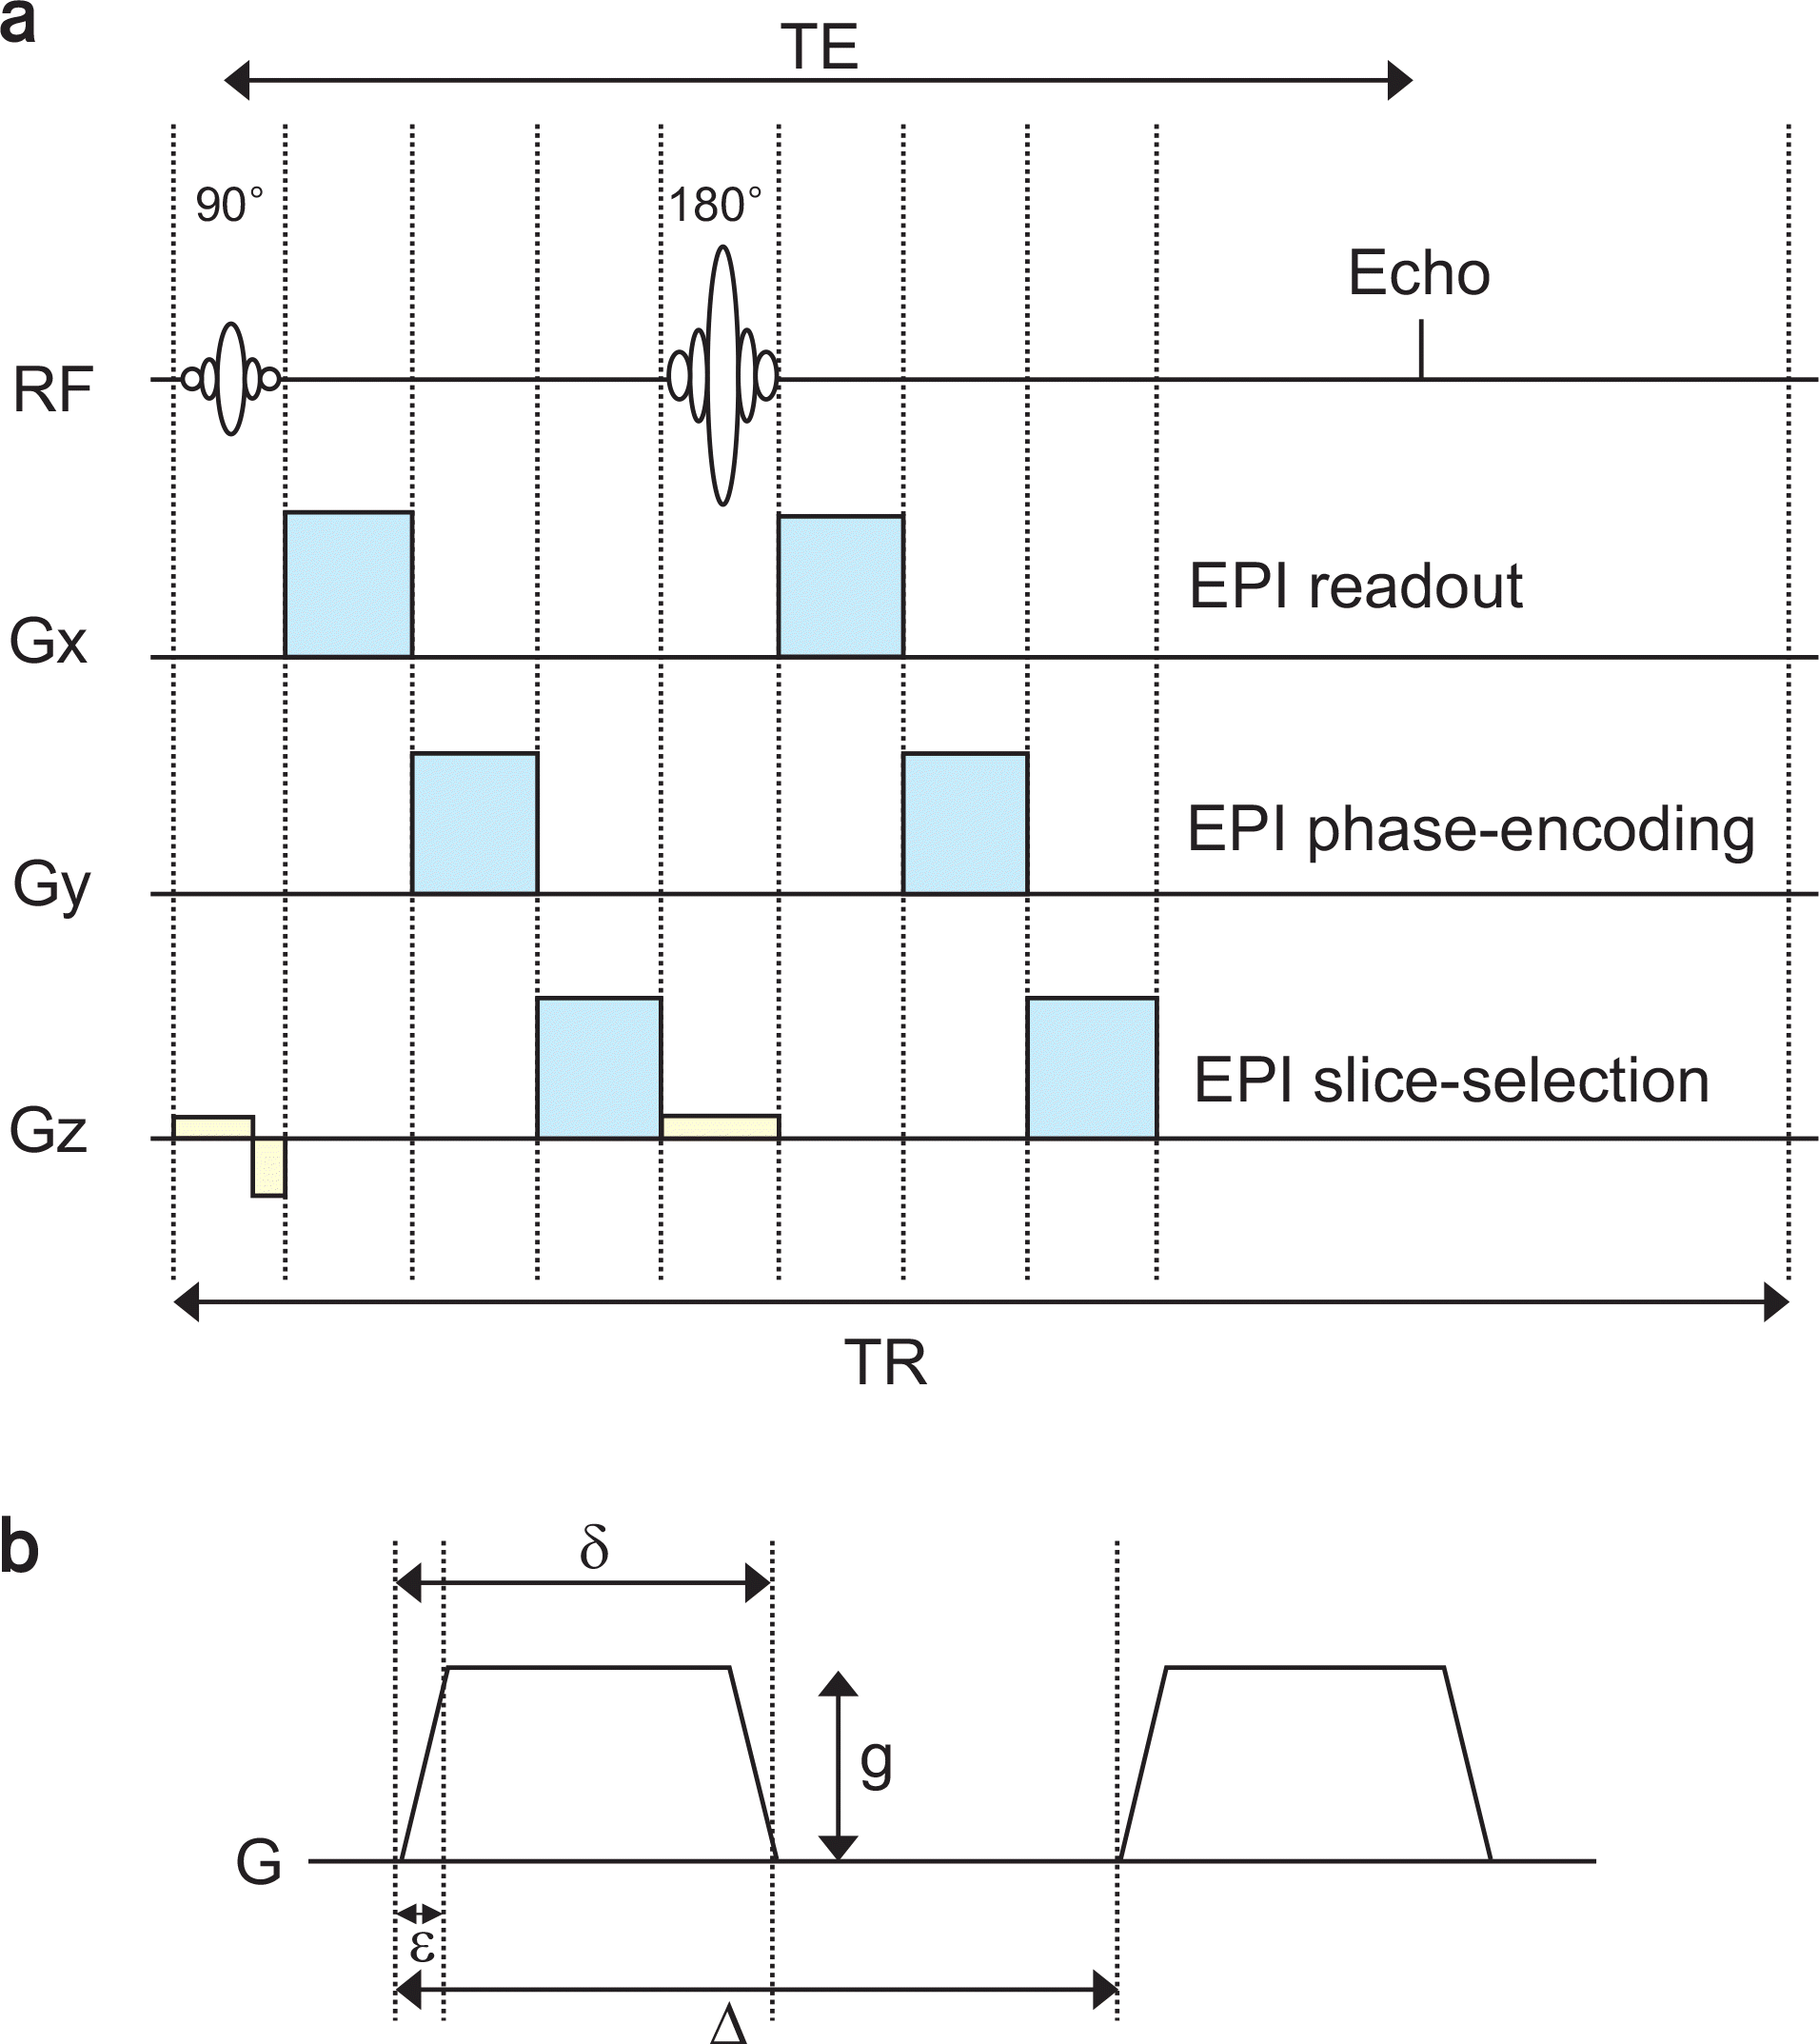
 | Fig. 1Diagrams of the diffusion-based functional MRI sequence (a) and the gradient for diffusion-weighting (b). Diffusion gradients were applied on the three axes to map isotropic apparent diffusion coefficient in a single acquisition. (a) RF, radio frequency; Gx, readout direction; Gy, phase-encoding direction; Gz, slice-selection direction; TE, echo time; TR, repetition time; and Echo, echo signal. (b) g, gradient strength; δ, duration of the diffusion gradient; ε, length of slope (ramp time); Δ, diffusion time. |
 | Fig. 2The scan orders (a) and the stimulation paradigm (b) for the diffusion-based functional MRI acquisitions. The same stimulation paradigm was applied on the BOLD fMRI scans. b0_b, the first baseline scan; b0_a, the last activation scan; DWI, diffusion-weighted imaging scans. |
 | Fig. 3Results of BOLD (a) and ADC_ba (b) for activated and deactivated brain regions for visual stimulation over 15 subjects. The results for activation and deactivation are observed with P<0.001 for correcting multiple comparisons using a false discovery rate (FDR), respectively. In the blood oxygen level-dependent (BOLD) data, increased (red) neuronal activations were found during the visual stimulation, and no deactivation areas were observed. In the ADC_ba data, increased (red) and decreased (blue) neuronal activations were found during the visual stimulation. ADC_ba was apparent diffusion coefficient (ADC) mapped with using both b0_b and b0_a for the baseline scans and activation scans, respectively. The color-coded maps are overlaid on the standard axial T1 template. |
Table 1.
Significantly activated brain regions during the visual stimulation using the blood oxygen level-dependent (BOLD) method in all subjects.
Table 2.
Significantly activated or deactivated brain regions during the visual stimulation for ADC_ba data in all subjects.


 PDF
PDF ePub
ePub Citation
 Print
Print


 XML Download