

 PDF
PDF ePub
ePub Citation
 Print
Print


Introduction
Overactive bladder (OAB) is a symptom complex defined by the International Urogynecological Association/International Continence Society as urgency, with or without urgency urinary incontinence, usually seen with urinary frequency and nocturia [1]. The prevalence of OAB is diversely reported depending on the characteristics of the subject group such as age, ethnicity, and socioeconomic status, or how to define OAB from as low as 2% to as high as 53% [2345]. In 2009, the prevalence of OAB was reported as 10% in man and 14.3% in women among 2000 healthy adults in Korea [6].
The quality of life can be significantly affected by various lower urinary tract symptoms, including major symptoms of OAB such as urgency, frequency, and nocturia. The OAB symptoms have broad effects on the quality of life, including social, mental, occupational, physical, and sexual aspects [7]. This becomes a factor in increasing the socioeconomic burden [89]. Therefore, a more detailed understanding on this subject is necessary. The purpose of this study is to investigate the prevalence, risk factors of OAB and the factors affecting the severity of OAB symptoms.
Materials and methods
A population-based cross-sectional study based on a questionnaire was conducted from April 2014 to April 2015 after getting Institutional Review Board (IRB) approval (IRB No. HYI-14-0007-1). Five public health centers located at Gyeonggi province and Seoul were chosen for this purpose. A total of 812 women aged 18–80 years responded to the survey study, which yielded a response rate of 81.5% (812/996).
The questionnaire consisted of 16 questions about urinary symptoms, 14 questions about self-treatment and the use of complementary and alternative medicine, and 21 questions about socio-demographic characteristics. The questionnaire also had 4 questions (number of urination episodes while awake, urination after awakening from sleep, urgency, and urge incontinence) to calculate the OAB symptom score (OABSS). The OAB symptoms were determined from the frequency of urination, with at least 8 episodes from morning to night; nocturia, with at least one episode of urination during sleep; urgency experienced at least once a week, consisting of a difficult time due to an urgent urination desire; urge incontinence, namely, losing control of urine along with urinary urgency symptoms. The OABSS developed by Homma et al. [10], in 2006 was used for the diagnosis of OAB. We used a Korean version of the OABSS that was developed and validated in 2011 [11]. Each symptom was scored between 0–2 for frequency, 0–2 for nocturia, 0–5 for urgency, and 0–5 for urge incontinence, depending on the severity. The diagnostic criteria for OAB are a total OABSS of 3 and more with an urgency score of 2 or more. The total score of 5 or less is defined as mild, a score of 6 to 11 as moderate, and a score of 12 or more as severe OAB.
The section of the questionnaire, regarding the self-treatment and the use of complementary and alternative health care, contained questions on the access to the information about self-treatment, whether the treatment was performed or not, and an oriental and folk remedy was used. Likewise, it also contained medical care costs and the intention for participation in public institutions for these treatment methods.
The socio-demographic characteristics included age, height, weight, waist circumference, marital status, number of births (divided into vaginal delivery and cesarean delivery), socioeconomic characteristics (religion, education, place of birth, occupation, and income level), status of alcohol drinking and smoking, amount of exercise, menopausal status, and the presence or absence of chronic diseases and surgical history. Although it was impossible to accurately diagnose metabolic syndrome based only on the questionnaire, participants with at least 2 characteristics (32 inches or above waist circumference, hypertension, diabetes, or hyperlipidemia) were categorized into the metabolic syndrome risk group.
After gathering data though the structured questionnaire, a coded book was prepared for the various responses obtained. Thereafter, the data were converted into the mode that could pick the necessary information based on the research problem. After checking for data completeness and consistency, it was analyzed using statistical tools. Data entry was done in excel and analyzed using the SAS statistical software (SAS Institute, Cary, NC, USA) and R (version 2.2.0; R Foundation, Vienna, Austria). The research data instruments were checked and cleaned for their completeness and error in data entering.
The prevalence of OAB was calculated by dividing the participants into an OAB group and a non-OAB group. Then, variables showing differences between the 2 groups were identified, and the risk factors of each group were investigated. Next, to identify risk factors affecting the severity of OAB, the non-OAB group and mild OAB group were combined into one group while the moderate and severe OAB groups were merged into another group. Variables showing differences between these 2 groups were investigated.
The χ2 test and t-test were used for analyses of categorical variables and continuous variables, respectively. To identify risk factors of OAB, variables that showed significant differences between the 2 groups were first identified using univariate logistic regression analysis, and the related variables were identified by using the backward elimination method that removes least significant variables from the model one by one through a multivariate logistic regression analysis. In univariate regression analysis, a P-value of 0.25 or less was selected as candidate variables. Moreover, when a P-value was less than 0.05, it was considered statistically significant in multivariate regression analysis.
Results
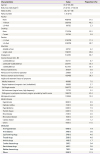
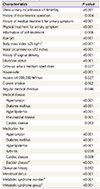
Table 1 shows the demographics of the participants. Age of the participants ranged from 18 to 80 years with the mean age of 41.8 years. Of the total participants, 21.1% were less than 30 years of age, 19.7% were in their 30's, 28.3% were in their 40's, 20.1% were in their 50's, 9.2% were in their 60's, and 1.6% were in their 70's.
Table 1
Demographics of patients
The prevalence of OAB was 19.3% (157/812). Of whom 55.4% (87/157), 40.8% (64/157), and 3.8% (6/157) had mild, moderate, and severe OAB symptoms, respectively. And 39.2% (318/812) complained stress incontinence and 12.8% (104/812) experienced both stress and OAB symptoms.
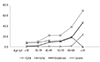
Fig. 1 presents a graph showing distributions of OAB by age. The prevalence of OAB by age is as follows: 8.4% were aged less than 30 years, 10.3% were in their 30's, 21.9% were in their 40's, 22.1% were in their 50's, 38.4% were in their 60's, and 69.2% were more than 70 years, showing that the frequency of OAB increased with age. A similar pattern was observed in the severity of OAB. Mild OAB was observed in 9.2% of patients less than 30 years of age, 8.3% in their 30's, 12.1% in their 40's, 11.3% in their 50's, 19.2% in their 60's, and 0% in patients greater than 70 years. In the case of moderate OAB, the corresponding proportion of participants by age was 1.2%, 1.9%, 8.9%, 10.1%, 17.8%, and 46.2%, respectively. The same pattern was seen in severe OAB: 0%, 0.9%, 0.6%, 1.4%, and 23.1%, respectively.
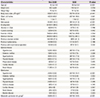
In order to identify factors affecting the occurrence of OAB, variables that showed differences between the OAB group and the non-OAB group were identified by univariate regression analysis (Table 2). The identified variables showing statistically significant differences included age, weight, waist circumference, menopause, current employment, current smoker, history of incontinence surgery, and diagnosis of hypertension, diabetes, and hyperlipidemia. In addition, participants who were taking medications for hypertension, diabetes, hyperlipidemia, or bladder disease showed statistically significant differences. Variables defined as the metabolic syndrome risk group also showed differences between 2 groups.
Table 2
Risk factors of overactive bladder (OAB) in univariate regression analysis
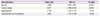
Multivariate logistic regression analysis was performed using the variables that were suspected to be related based on the results of univariate regression analysis. As a result, participants who are elderly, current smokers, and those hyperlipidemia, cardiovascular, and renal disease showed statistically significant higher risk group for OAB (Table 3).
Table 3
Risk factors of overactive bladder in multivariate regression analysis
Risk factors affecting the severity of OAB were investigated by comparing 2 groups, one including the combined non-OAB and mild-OAB groups, and the other including the moderate-OAB and severe-OAB groups. Table 4 represents the results of univariate regression analysis. The identified variables showing statistically significant differences included stress urinary incontinence, incontinence operation history, medical or physical treatment for urinary symptom, age, body mass index (BMI), waist circumference, vaginal delivery history, educational status, job, menstrual status, diagnosis with hypertension, diabetes, hyperlipidemia and rheumatoid disease and medication for hypertension, diabetes, hyperlipidemia, bladder disease. The resulting variables suspected to affect the severity of OAB were subject to multivariate regression analysis, which resulted in age, current smoker and hyperlipidemia being correlated with the severity of OAB (Table 5).
Table 4
Factors affecting the severity of overactive bladder in univariate regression analysis
a)Defined as suffered by any bladder disease such as cystitis, urinary stone; b)Counting the number among waist circumference ≥32 inches, hypertension, diabetes mellitus, and hyperlipidemia; c)Defined as 2 or more among waist circumference ≥32 inches, hypertension, diabetes mellitus, and hyperlipidemia.

Discussion
This study targeted women who have used public health centers with a concern for health promotion. The OAB prevalence rate was found to be 19.3%. This rate might be underestimated because the study population could not reflect the actual distribution of age of census. Several studies for Korean OAB have been reported. Choo et al. [12] conducted an epidemiologic investigation of OAB in 200 men and women through a telephone survey. As a result, it was found that the prevalence of OAB in women without urge incontinence was 16.3%, and 15% with urge incontinence. Lee et al. [6] conducted a telephone survey of 2000 Korean men and women, and consequently the prevalence of OAB among women was found to be 14.2%. In addition, it was also reported that the prevalence of OAB was 14.3% for 350 healthy menopausal women [13]. Contrary to these studies, we used a validated self-questionnaire of OABSS in which the scores of each urinary symptoms was used for diagnosis and severity of OAB and not a telephone survey for the lower urinary tract symptoms. The differences in the type of question, for example, the respondents could be asked yes/no questions or for a detailed answer, and the Likert response scale might bring in different results. Also in the telephone survey, more time is required to complete the survey and the respondents might not participate if they were contacted at an inconvenient time and they may be less willing to open up regarding their problem as compared to an internet or self-completion survey. In a questionnaire study, the method how to survey, design of questionnaire, and study population exert strong effects on the results. Thus, the prevalence shows variation.
Many studies have reported that the OAB prevalence rate increases with age [231415]. Our study demonstrated that the prevalence of OAB tended to increase with age, while the severity of OAB worsened. The multivariate logistic regression analysis indicated that age was a risk factor for both the OAB and severity of OAB. In addition, the age-related changes in the detrusor muscle could affect OAB symptoms [16].
According to the results of this study, current smoking was also considered to be a risk factor, consistent with the results of several previous studies [1517]. Koskimäki et al. [17] reported that a history of smoking increased the odds of occurrence of lower urinary tract symptoms, and Tähtinen et al. [18] reported that compared to non-smokers, smokers had an over 3 times higher frequency of urgency and frequent urination [18]. Smoking can cause hormonal and nutrient imbalances affecting the bladder and collagen synthesis [19], and it has antiestrogenic effects in women [20].
Renal disease was also identified as a factor that increases OAB risk. According to a study by Chung et al. [21] nocturia increased in cases with chronic kidney disease (CKD). It is thought that this factor showed the same results with an increase of OAB in patients with renal disease.
The risk factors vary a little from study to study. Seim et al. [15] from Hunt study suggested BMI, alcohol consumption, diabetes, history of stroke as risk factors in addition to age and smoking. de Boer et al. [22] reported that the risk factors of OAB were old age (over 75 years), overweight, menopause and smoking. Lugo et al. [4] reported the risk factors of OAB were age over 50, obesity, menopause and parity. However, Al-Shaiji et al. [23] found that no significant connection existed between the OAB prevalence and BMI.
Recently the study for correlation between metabolic syndrome and OAB has been actively done [24252627]. Although pathophysiology is not fully known, in animal studies using the fructose-fed rats (FFRs), a common model used for the metabolic syndrome, premicturition, unstable bladder contractions suggestive of detrusor overactivity were noted in 62.5% of the FFRs as compared with none in the controls [28]. Moreover, an increased expression of the muscarinic M2-M3 receptor of mRNA and protein levels in the urothelium and muscle layer of the bladder with unstable bladder contractions in experimental FFRs supports the relationship of metabolic syndrome-induced detrusor and autonomous nervous system overactivity [29]. In our study, the data were insufficient to diagnose metabolic syndrome to the minute. Instead, we tried to determine the relationship between OAB and metabolic syndrome risk group where the participants had at least 2 or more risk factors among waist circumference ≥32 inches, hypertension, diabetes mellitus and hyperlipidemia. As shown in Table 5, our defined metabolic risk group was found as a significant risk factor for OAB in univariate regression analysis, however statistical significance was no longer observed on multiple regression analysis.
In this study, there was an additional question for the participants of the OAB group who have tried self-treatment, complementary and alternative treatment. Even though a small percentage of the OAB group had tried self and complementary treatment, 5.3% and 16.7%, respectively; data is not shown in the table, most of the OAB group (75.3%) expressed their intention to participate if the public institution would provide treatment programs. Women with urinary symptom typically do self-treatment, take non-prescription drugs, or restrict water intake. It seems that people feel a little ashamed to go to the doctor or receive treatment for urinary symptoms, whereas there is an intention to participate in treatment programs offered by public institution reflects interest and expectation for diagnosis and treatment of urinary symptoms. Thus, it is of great importance to raise OAB awareness and organize a program for the prevention and treatment of OAB. In addition, the public health program for OAB by a multidisciplinary team could not only improve QoL of the affected women but could also reduce the social health expenditure burden in the super-aging society.
In conclusion, age, current smoking, hyperlipidemia, cardiovascular and renal disease were revealed as significant risk factors for OAB or severity of OAB.
 XML Download