

 PDF
PDF Citation
 Print
Print


INTRODUCTION
The International Agency of Research on Cancer estimated that cervical cancer was the fourth most common cancer in women and the seventh overall worldwide in 2012, with an estimated 528,000 new cases. There were 266,000 cervical cancer-related deaths estimated worldwide in 2012, accounting for 7.5% of all female cancer-related deaths [1]. In Korea, there were an estimated approximately 3,500 new cases and the age-standardized incidence rate was 9.5 per 100,000 persons in 2013 [2]. Most gynecologic oncology surgeons prefer radical surgery in patients with early-stage disease [3]. The Gynecologic Oncology Group (GOG) randomized trial of postoperative radiation therapy (RT) included 277 patients with negative nodes and local high-risk features meeting the Sedlis criteria. Overall, there was a 47% reduction in the risk recurrence. In addition, the SWOG demonstrated that postoperative treatment with chemoradiation resulted in significantly improved pelvic disease control and survival when compared to RT alone in patients who met the Peters criteria [45]. So, adjuvant RT has been administered to improve oncologic outcomes in various settings such as RT alone, concurrent chemoradiation therapy, sequential chemoradiation therapy, RT followed by additional chemotherapy, sandwich therapy with chemotherapy and RT. However, some clinicians have performed adjuvant chemotherapy (AC) in patients with certain risk factor(s) for disease recurrence and suggested that AC could be a reasonable option. There are considerable advantages to surgery without adjuvant radiotherapy (AR), including the preservation of vaginal pliability and ovarian function and the opportunity to avoid potential late radiation-related complications.
The present meta-analysis aimed to quantify and compare the effects of AC with any treatment strategies including AR on oncologic outcome in cervical cancer patients with intermediate- or high-risk factors after surgery.
MATERIALS AND METHODS
1. Literature search
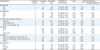
A systematic review and meta-analysis were performed using previously described reporting guidelines [678]. The Embase and MEDLINE databases and the Cochrane Central Register for Controlled Trials database were searched up to October 2017, irrespective of language. Pre-publication papers were also included. The search strategy is described in Appendix 1. Titles and abstracts were checked to identify potentially eligible studies. The full texts were then reviewed in detail. References were manually screened to find additional studies. Two authors (SHS and KBL) independently performed all searches.
2. Eligibility criteria
The inclusion criteria for this meta-analysis were as follows: 1) a randomized controlled trial (RCT), prospective/retrospective cohort study, nested case-control study; 2) or population-based case-control study of participants receiving primary radical hysterectomy (RH) with lymphadenectomy for cervical cancer (stage I–II); 3) AC following RH, as intervention; 4) AR including radiotherapy or concurrent chemoradiotherapy (CCRT) following RH as a comparison; and 5) outcomes of mortality or recurrence rates measured via relative risks (RRs), odds ratios (ORs), or hazard ratios (HRs) with 95% confidence intervals (CIs) or sufficient data for calculation. For studies with duplicated data, the most recent or instructive study was selected. Single-arm cohort studies and case reports were excluded.
3. Data extraction
The following data were extracted from each study: first author; publication year; study design, location, and period; patient ages; sample size; tumor stage; histology; lymph node metastasis (LNM), parametrial involvement (PMI), resection margin involvement (RMI), tumor size, deep stromal invasion (DSI), lymphovascular space invasion (LSVI), AC details (regimen, dose, cycle); AR details (dose, use of CCRT, concomitant chemotherapy regimen), follow-up duration; recurrence; death from disease; and indications for adjuvant treatment. Pathological risk factors including LNM, PMI, and RMI were considered high-risk factors [4]; those including bulky tumor (>4 cm diameter), DSI, and LSVI were considered intermediate risk factors [5]. Each study was systematically reviewed for features that could introduce bias, similarity of risk factors for prognosis, and similarity of follow-up durations between the AC and AR groups. Three authors (KBL, SHS, and JML) independently extracted data and discrepancies were jointly reviewed until consensus was reached.
4. Quality assessment
For non-randomized studies (NRSs), the quality of each study was evaluated using the nine-star Newcastle-Ottawa scale (NOS) in three categories: selection, comparability, and exposure (case-control studies) or outcomes (cohort studies) [9]. Based on quality assessment standards from previous meta-analyses [10], the present meta-analysis defined a study with five or more stars as high-quality. To evaluate the study quality for RCTs, the following features were assessed: randomization procedure, estimation of sample size, blinding and allocation concealment, loss to follow-up, dropout, and intention-to-treat analysis [11]. Study quality was quantified using the Jadad/Oxford quality scoring system [12]. Three authors (KBL, SHS, and JML) independently evaluated study quality and discrepancies were jointly reviewed until consensus was reached.
5. Data generation and analysis
The primary endpoint was the mortality rate. The secondary endpoints were the total, local, and distant recurrence rates. The ORs and 95% CIs for the mortality or recurrence rates for the AC and AR groups were calculated from the original data of each study. Cross-study heterogeneity was examined using the Cochran Q test and the I2 statistic [1314]. Q test p<0.1 [13] or I2 statistic >50% [14] indicated substantial heterogeneity between studies. A random-effects model was used (DerSimonian-Laird method) to estimate the combined OR [15]. Subgroup analyses according to study design (RCT or NRS), histology (squamous cell carcinoma [SCC] or adenocarcinoma [ADC] or SCC plus ADC), type of AR (RT only or CCRT only or RT plus CCRT), indications for adjuvant treatment (intermediate-risk only or high-risk only), status of LNM (yes or no), and AC regimen (platinum combination with taxane or platinum combination with non-taxane) were performed.
Sensitivity analysis was conducted by withdrawing one study at a time from the meta-analysis to evaluate its effect on the pooled OR [8]. Publication bias was determined using the Begg-Mazumdar rank correlation [1617] and fail-safe N [18] tests. All analyses were performed using R version 3.0.2 (R Foundation, Vienna, Austria; http://cran.r-project.org/mirrors.html). A two-sided p value <0.05 was considered significant.
RESULTS
1. Literature search

2. Study characteristics
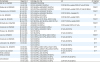
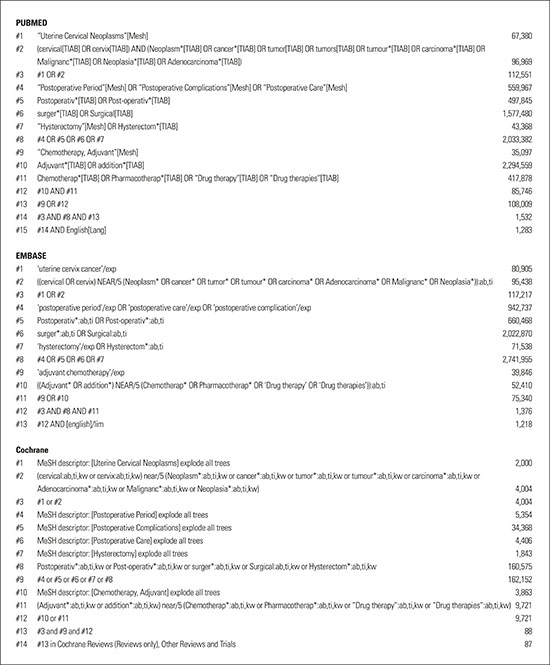
Table 1 lists the study characteristics. Thirteen papers, published between 1996 and 2017, included 942 patients who received AC after RH and 1,721 who received AR after RH. Two studies were RCTs [2931] and 11 were NRSs [1920212223242526272830]. The studies were conducted in Japan [19202124252830], Korea [2327], China [22], Italy [26], Austria [29], and the US [31]. For the RCTs, the quality score was 3 (Jadad/Oxford quality scoring system, Supplementary Table 2). For the NRSs, the quality scores were 6 or 7 (Supplementary Table 3). All included NRSs received three stars for selection. Three studies received one star for comparability for 1 controlled confounder (e.g., disease status after CCRT); eight studies received two stars because they satisfied additional comparability criteria. Nine studies lost stars for exposure for failure to adequately present follow-up losses.
Table 1
Characteristics of studies included in the meta-analysis
| Study/design | Stage (No.) | Histology, No. (%) | AR | AC regimen |
|---|---|---|---|---|
| Seki et al. [19]/NRS | IB–IIB (22) | ADC/ADSCC 22 (100%) | TP/NTP | |
| IB–IIB (113) | SCC 90, ADC/ADSCC 23 (20%) | CCRT 86 (76%, weekly CDDP), RT only 27 (24%) | ||
| Matsuo et al. [20]/NRS | IB1–IIB (319) | SCC 156 (49%), ADC/ADSCC 149 (47%) | TP/NTP | |
| IB1–IIB (753) | SCC 597 (79%), ADC/ADSCC 154 (20%) | CCRT 502 (66%, weekly CDDP), RT only 253 (36%) | ||
| Takekuma et al. [21]/NRS | IB1–IIB (37) | SCC 24 (65%), ADC/ADSCC 13 (35%) | TP/NTP | |
| IB1–IIB (74) | SCC 48 (65%), ADC/ADSCC 26 (35%) | CCRT 74 (100%, triweekly FP) | ||
| Li et al. [22]/NRS | IB1–IIA1 (65) | SCC 59 (91%), ADC 6 (9%) | TP | |
| IB1–IIA1 (68) | SCC 63 (93%), ADC 23 (7%) | CCRT 68 (100%, weekly CDDP) | ||
| Jung et al. [23]/NRS | IB1–IIA (85) | SCC 61 (72%), ADC 21 (25%), ADSCC 3 (4%) | TP/NTP | |
| IB1–IIA (177) | SCC 138 (78%), ADC 26 (15%), ADSCC 13 (7%) | CCRT 177 (100%, weekly CDDP) | ||
| Shimada et al. [24]/NRS | IB–IIB (64) | ADC/ADSCC 64 (100%) | TP/NTP | |
| IB–IIB (69) | ADC/ADSCC 69 (100%) | CCRT (weekly CDDP) or RT only | ||
| Hosaka et al. [25]/NRS | IB1–IIB (32) | SCC 24 (75%), ADC/ADSCC 8 (25%) | TP | |
| IB1–IIB (49) | SCC 47 (96%), ADC/ADSCC 2 (4%) | RT only 49 (100%) | ||
| Mossa et al. [26]/NRS | IB1–IIA (127) | SCC 127 (100%) | NTP | |
| IB1–IIA (136) | SCC 136 (100%) | RT only 136 (100%) | ||
| Lee et al. [27]/NRS | IB1–IIA (38) | SCC 31 (82%), ADC 2 (5%), ADSCC 5 (13%) | TP/NTP | |
| IB1–IIA (42) | SCC 33 (79%), ADC 3 (7%), ADSCC 5 (12%) | RT only 42 (100%) | ||
| Hosaka et al. [28]/NRS | IB1–IIB (28) | SCC 28 (100%) | NTP | |
| IB1–IIB (42) | SCC 42 (100%) | RT only 42 (100%) | ||
| Lahousen et al. [29]/RCT | IB–IIB (52) | SCC 28 (100%) | NTP | |
| SCC 24 (100%) | RT only 24 (100%) | |||
| Iwasaka et al. [30]/NRS | IB–IIB (53) | SCC 43 (81%), ADSCC 3 (6%), others 7 (13%) | NTP | |
| IB–IIB (127) | SCC 107 (84%), ADSCC 7 (6%), others 13 (10%) | RT only 127 (100%) | ||
| Curtin et al. [31]/RCT | IB–IIA (88) | SCC 52 (58%), ADC 30 (39%) | RT only 45 (100%) | NTP |
| RCTs combined | IB–IIB (134) | SCC 104 (74%), ADC 30 (21%) | CCRT 0 | |
| NRSs combined | IB–IIB (805) | SCC 553 (64%), ADC/ADSCC 296 (34%) | ||
| IB–IIB (1,581) | SCC 1211 (73%), ADC/ADSCC 351 (21%) | CCRT 907 of 1,583 (57%) | ||
| All combined | IB–IIB (805) | SCC 553 (64%), ADC/ADSCC 296 (34%) | ||
| IB–IIB (1,581) | SCC 1211 (73%), ADC/ADSCC 351 (21%) | CCRT 907 of 1,652 (55%) |
AC, adjuvant chemotherapy; ADC, adenocarcinoma; ADSCC, adenosquamous carcinoma; AR, adjuvant radiotherapy; CCRT, concurrent chemoradiotherapy; CDDP, cisplatin; FP, fluorouracil and cisplatin; NRS, non-randomized study; NTP, nontaxane and platinum; RCT, randomized controlled trial; RT, radiation therapy; SCC, squamous cell carcinoma; TP, taxane and platinum.
![]()
All of the patients had International Federation of Gynecology and Obstetrics (FIGO) stage IB–IIB disease. The median ages in the AC and AR groups were 48 and 49 years, respectively, with median follow-up periods of 66 months. The SCC and ADC histology types were included in 9 studies [192021222325273031]; three involved only the SCC type [262829] and one involved only the ADC type [24]. In all studies combined, the AC and AR groups showed similar distributions of pathological risk factors such as bulky tumor (44% vs. 41%), LSVI (69% vs. 70%), DSI (63% vs. 66%), and RMI (1% vs. 2%); however, the AC group showed slightly lower rates of LNM (64% vs. 75%) and PMI (25% vs. 38%) compared with those in the AR group.
Regarding the indication for adjuvant treatment, all enrolled patients had high-risk factors for recurrence in three studies [202126] and only intermediate-risk factors in two studies [2227], whereas the other studies featured a mixture of intermediate- and high-risk factors [1923242528293031]. Two studies involved only patients with LNM [2026]. In 4 studies, >1/2 stromal invasion was considered DSI [20232427]; in 3 studies, >2/3 stromal invasion was considered DSI [222528]; and in 2 studies, >3/4 stromal invasion was considered as DSI [3031].
Regarding the AC regimen, all included studies involved platinum-based combination chemotherapy; 2 with only platinum + taxane [2225], 5 with only platinum + non-taxane [2628293031], and the remaining seven with a mixture of platinum + taxane and platinum + non-taxane [192021232427]. Regarding the type of AR, 6 involved RT only without concomitant chemotherapy [252627282930] whereas 3 involved CCRT only [212223] and three featured a mixture of RT and CCRT [192024]. All patients who underwent CCRT received concomitant cisplatin-based chemotherapy.
3. Meta-analysis of the impact of AC on survival compared to that of AR
Twelve studies compared AC to AR in terms of survival, with a combined total of 486 deaths (164/920 patients receiving AC vs. 322/1,608 patients receiving AR) [202122232425262728293031]. No significant difference in mortality rates was observed between the AC and AR groups (OR=0.73; 95% CI=0.51–1.04; p=0.08), with low cross-study heterogeneity (p=0.10 and I2=34) (Fig. 2A). In the sensitivity analysis, no significant increase was found in mortality in the AC group compared to that in the AR group after any single study was omitted (Supplementary Table 4). There was no evidence of publication bias (p=0.55, Begg-Mazumdar rank correlation test). The fail-safe N test indicated that 18 more studies with significant findings would be needed to render the two-sided p value non-significant. The funnel plot for publication bias was asymmetric (Fig. 3A). However, other quantified tests for publication bias indicated that t the observed overall effect is robust (p=0.55, Begg-Mazumdar rank correlation test); The fail-safe N test 184 indicated that 18 more studies with significant findings would be needed to render the 2-sided p-value non-significant.
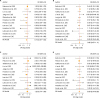 | Fig. 2(A) ORs for the risk of mortality in each study and all studies combined; AC was compared with AR following radical hysterectomy in a meta-analysis based on the random-effects model. (B) ORs for the risk of any recurrence in each study and all studies combined based on the random-effects model. (C) ORs for the risk of local recurrence in each study and all studies combined based on the random-effects model. (D) ORs for the risk of distant recurrence in each study and all studies combined based on the random-effects model.
AC, adjuvant chemotherapy; AR, adjuvant radiotherapy; CI, confidence interval; OR, odds ratio.
|
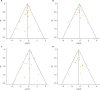 | Fig. 3(A) Funnel plots for identifying publication bias in the meta-analysis of mortality (n=12). The Begg-Mazumdar rank correlation test indicates no evidence of publication bias (p=0.55). (B) Funnel plots for identifying publication bias in the meta-analysis of any recurrence (n=13). The Begg-Mazumdar rank correlation test indicates no evidence of publication bias (p=0.68). (C) Funnel plots for identifying publication bias in the meta-analysis of local recurrence (n=12). The Begg-Mazumdar rank correlation test indicates no evidence of publication bias (p=0.84). (D) Funnel plots for identifying publication bias in the meta-analysis of distant recurrence (n=12). The Begg-Mazumdar rank correlation test indicates no evidence of publication bias (p=0.55).
OR, odds ratio.
|
4. AC and mortality risk in subgroup meta-analyses
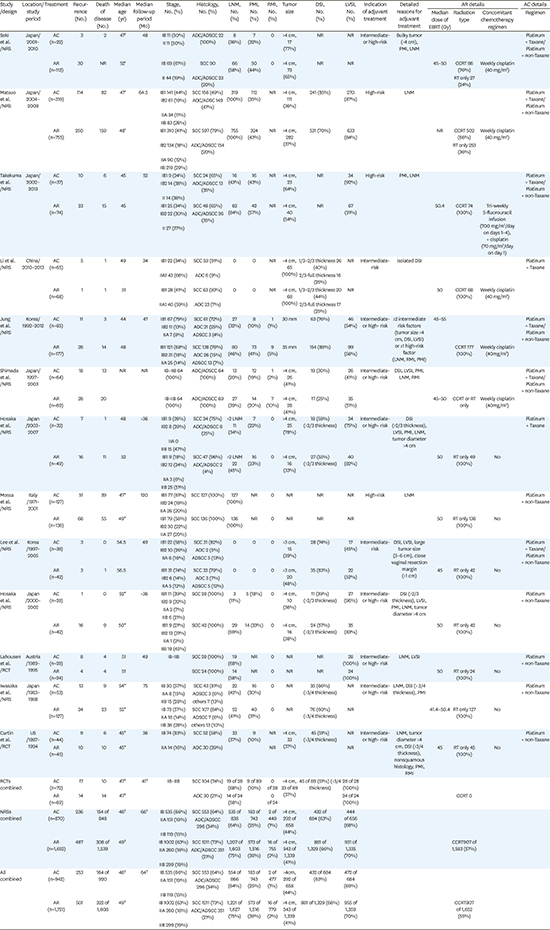
Table 2 shows the results of subgroup analyses comparing mortality rates for AC and AR. The Forest plots are shown in Supplementary Fig. 1. Supplementary Fig. 1A illustrates the ORs for AC and mortality for each study and the pooled ORs for study design (NRS or RCT). There were 2 RCTs [2931]; the pooled OR was 0.64 (95% CI=0.26–1.56; p=0.33; p=0.67 and I2=0). There were 10 NRSs [20212223242526272830]; the pooled OR was 0.73 (95% CI=0.49–1.08; p=0.12; p=0.06 and I2=40), indicating no significant difference in mortality rates between groups.
Table 2
Subgroup analysis comparing AC versus AR following radical hysterectomy for mortality
AC, adjuvant chemotherapy; ADC, adenocarcinoma; AR, adjuvant radiotherapy; CCRT, concurrent chemoradiotherapy; CI, confidence interval; LNM, lymph node metastasis; NA, not applicable; NRS, non-randomized study; OR, odds ratio; SCC, squamous cell carcinoma; RCT, Randomized controlled trial; RT, radiotherapy.
![]()
Supplementary Fig. 1B shows the pooled ORs for mortality according to histology type (SCC or ADC [including adenosquamous carcinoma] or SCC plus ADC [including adenosquamous carcinoma]). In three studies including only patients with SCC type [262829], there was no significant difference in mortality between groups (OR=0.63; 95% CI=0.39–1.01; p=0.054; p=0.27 and I2=0). Two studies included only patients with ADC [24] and provided mortality data according to ADC [19]. There was no significant difference in the mortality between the groups (OR=0.54; 95% CI=0.26–1.12; p=0.10; p=0.42 and I2=0). Similarly, no significant differences in mortality were noted between groups (OR=0.78; 95% CI=0.48–1.26; p=0.31; p=0.17 and I2=36) in eight studies including patients with the ADC plus SCC histological type [2021222325273031].
Supplementary Fig. 1C shows the pooled ORs for mortality according to the indications for adjuvant treatment. Six studies included only patients with high risk [202126] or provided mortality data according to high risk [232429]. Pooled data from these studies revealed no significant difference between the AC and AR groups (OR=0.92; 95% CI=0.65–1.29; p=0.63), with low cross-study heterogeneity (p=0.25 and I2=24). In the two studies that included only intermediate risk [2227], no significant difference in recurrence was found between the two groups (OR=0.66; 95% CI=0.08–5.48; p=0.70), with low cross-study heterogeneity (p=0.62 and I2=0).
Supplementary Fig. 1D shows the pooled ORs for mortality according to AR type. In seven studies featuring RT only [25262728293031], there was no significant increase in mortality in the AC group relative to that in the control group (OR=0.63; 95% CI=0.43–0.92; p=0.02; p=0.40 and I2=0). Four studies included only patients with CCRT as comparison [212223] and provided mortality data according to CCRT [20]. Pooled data from these studies revealed no significant difference between the AC and AR groups (OR=0.96; 95% CI=0.55–1.68; p=0.89), with low cross-study heterogeneity (p=0.34 and I2=29).
Supplementary Fig. 1E shows the pooled ORs for mortality according to the AC regimen. In 2 studies featuring platinum combination with taxane only [2224], there was no significant difference in mortality between groups (OR=0.28; 95% CI=0.03–2.44; p=0.25; p=0.21 and I2=37). In 5 studies featuring platinum combination with non-taxane only [2628293031], there was no significant increase in mortality in AC group relative to the control group (OR=0.67; 95% CI=0.45–0.99; p=0.04; p=0.50 and I2=0).
Supplementary Fig. 1F shows the pooled ORs for mortality according to the LNM status. Five studies included only patients with LNM [2026] and provided mortality data according to LNM [232429]. Pooled data from these studies revealed no significant difference between the AC and AR groups (OR=0.85; 95% CI=0.53–1.38; p=0.52; p=0.15 and I2=46).
5. Meta-analysis of the impact of AC on recurrence compared with that for AR
Thirteen studies comprised a total of 2,663 patients with a combined total of 754 recurrences (253/942 patients receiving AC vs. 501/1,721 patients receiving AR) [19202122232425262728293031]. No significant difference in recurrence rates was observed between the AC and AR groups (OR=0.86; 95% CI=0.67–1.11; p=0.26), with low cross-study heterogeneity (p=0.08 and I2=20) (Fig. 2B). In the sensitivity analysis, no study significantly influenced the pooled OR for AC and recurrence (Supplementary Table 5). No publication bias was found (p=0.68, Begg-Mazumdar rank correlation test) and the funnel plot was symmetrical (Fig. 3B).
Twelve studies assessing 2,530 patients had reported on local and distant recurrence [192021222325262728293031]. No significant difference in the local recurrence rates was observed between the two groups (OR=1.20; 95% CI=0.74–1.94; p=0.46), with significant cross-study heterogeneity (p=0.02 and I2=50) (Fig. 2C). No publication bias was found (p=0.84) and the funnel plot was symmetrical (Fig. 3C). The results for distant recurrence favored the AC group (OR=0.69; 95% CI=0.54–0.88; p=0.03), with low cross-study heterogeneity (p=0.76 and I2=0) (Fig. 2D). No publication bias was found (p=0.55) and the funnel plot was symmetrical (Fig. 3D). The fail-safe N test indicated that 14 more studies with significant findings would be needed to render the two-sided p value non-significant.
6. Meta-analysis of the impact of AC on recurrence compared with that for AR
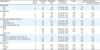
Table 3 shows the results of subgroup analyses comparing recurrence in AC versus that for AR. The Forest plots are illustrated in Supplementary Fig. 2. Supplementary Fig. 2A shows the ORs for AC, the recurrence for each study, and the pooled ORs for study design (NRS or RCT). There were 2 RCTs [2931]; the pooled OR was 1.20 (95% CI=0.53–2.70, p=0.66; p=0.35 and I2=0). There were 11 NRSs [1920212223242526272830]; the pooled OR was 0.83 (95% CI=0.63–1.09; p=0.18; p=0.06 and I2=27), indicating no significant difference in recurrence rates between groups.
Table 3
Subgroup analysis comparing AC versus AR following radical hysterectomy for recurrence
AC, adjuvant chemotherapy; ADC, adenocarcinoma; AR, adjuvant radiotherapy; CCRT, concurrent chemoradiotherapy; CI, confidence interval; LNM, lymph node metastasis; NRS, non-randomized study; OR, odds ratio; RCT, Randomized controlled trial; RT, radiotherapy; SCC, squamous cell carcinoma.
![]()
Supplementary Fig. 2B shows the pooled ORs for recurrence according to histology type (SCC or ADC [including adenosquamous carcinoma] or SCC plus ADC [including adenosquamous carcinoma]). In 3 studies including only patients with SCC type [262829], there was no significant difference in recurrence between groups (OR=0.51; 95% CI=0.09–3.01; p=0.46; p=0.02 and I2=83). In eight studies including patients with the ADC plus SCC histological type [2021222325273031], there was also no significant difference in recurrence between groups (OR=1.06; 95% CI=0.85–1.32; p=0.60; p=0.62 and I2=0). Two studies included only patients with ADC [24] and provided recurrence data according to ADC [19]. There was also no significant difference in recurrence between the group (OR=0.42; 95% CI=0.17–1.06; p=0.07; p=0.22 and I2=34).
Supplementary Fig. 2C shows the pooled ORs for recurrence according to the indications for adjuvant treatment. Four studies included only patients with high risk [202126] or provided recurrence data according to high risk [23]. Pooled data from these studies revealed no significant difference between the AC and AR groups (OR=0.93; 95% CI=0.67–1.30; p=0.69), with low cross-study heterogeneity (p=0.32 and I2=31). In 2 studies that only assessed intermediate risk [2227], no significant difference in recurrence was found between the 2 groups (OR=2.13; 95% CI=0.45–10.01; p=0.34), with low cross-study heterogeneity (p= 0.25 and I2=25).
Supplementary Fig. 2D shows the pooled ORs for recurrence according to AR type. In 7 studies featuring RT only [25262728293031], there was no significant difference in recurrence between the 2 groups (OR=0.82; 95% CI=0.55–1.23; p=0.33; p=0.10 and I2=19). Four studies included only patients receiving CCRT as comparison [212223] and provided recurrence data according to CCRT [20]. Pooled data from these studies revealed no significant difference between the AC and AR groups (OR=1.04; 95% CI=0.81–1.35; p=0.74), with low cross-study heterogeneity (p=0.37 and I2=0).
Supplementary Fig. 2E shows the pooled ORs for recurrence according to the AC regimen. In 2 studies featuring platinum combination with taxane only [2225], there was no significant difference in recurrence between groups (OR=1.45; 95% CI=0.16–12.93; p=0.74; p=0.07 and I2=70). In 5 studies featuring platinum combination with non-taxane only [2628293031], there was no significant difference in recurrence between groups (OR=0.84; 95% CI=0.46–1.53; p=0.57; p=0.04 and I2=49).
Supplementary Fig. 2F shows the pooled ORs for recurrence according to the LNM status. Three studies included only patients with LNM [2026] and provided recurrence data according to LNM [23]. Pooled data from these studies revealed no significant difference between the AC and AR groups (OR=0.94; 95% CI=0.64–1.40; p=0.77; p=0.19 and I2=45).
DISCUSSION
To the best of our knowledge, this is the first meta-analysis to comprehensively evaluate the effects of AC on oncologic outcome in cervical cancer patients with intermediate- or high-risk factors after surgery compared to those for AR. The results of our meta-analysis indicate that patients receiving AC after surgery have comparable survival outcomes and recurrence rates to those who undergo AR or adjuvant CCRT. This pattern was consistently observed in the subgroup analyses of study design, histology, AR type, indications for adjuvant treatment, LNM status, and AC regimen.
It is controversial as to whether histologic type influences survival and the pattern of recurrence in patients with early-stage cervical cancer [32333435]. Although studies are limited, ADC may be more resistant when RT is added after surgery, and role of adjuvant RT for ADC remains uncertain [36]. The results of subgroup analysis including ADC plus SCC histologic type showed no significant difference in recurrence and mortality rates between groups.
Although few data specifically address the result of AC after radical surgery in patients meeting the Sedlis criteria, the literature addressing this issue reported a 3-year disease-free survival rate of 94.6% and a 5-year cervical cancer-specific survival of 96.2% [37]. Due to discretion and experience of the gynecologic oncologists, the risk factors that indicate adjuvant treatment can differ between clinicians. In each of the analyzed studies, each group was compared with the same indications. The pooled data from these studies revealed no significant difference in mortality and recurrence rates between the AC and AR groups.
The results of retrospective studies suggested that adjuvant systemic chemotherapy treatment decreased distant recurrence when compared to CCRT for patients with high-risk factors [1920]. However, other studies reported that recurrence patterns and rates did not differ significantly between groups with high-risk factors [21232931]. In a study of patients with intermediate risk factors, distant control was not significantly improved but local failure did not occur in the chemotherapy group [27]. In our analysis, no significant difference in local recurrence rates was observed between groups. However, distant recurrence favored the AC group (OR=0.69; 95% CI=0.54–0.88; p=0.03), with low cross-study heterogeneity (p=0.76 and I2=0). If lymph node metastasis is a surrogate of distant metastasis, this result may be evidence of a direct effect of systemic chemotherapy on distant micrometastatic lesions.
Platinum is the most common active agent in the treatment of cervical cancer and platinum-containing combination regimens, topotecan and paclitaxel combination regimens, platinum single agent, and paclitaxel single agent have been considered appropriate treatments for advanced or recurrent cervical cancer [38]. Although the optimal chemotherapeutic agents have not been determined, AC with platinum-based combination regimen were used in the included studies. The GOG 240 trial demonstrated the effects of the addition of bevacizumab to paclitaxel and cisplatin [39]. Similarly, in the Japanese Gynecologic Oncology Group (JGOG) 1,065 trial, neoadjuvant chemotherapy with nedaplatin and irinotecan were reported to have favorable response rates [40]. These data show the potential of the addition of such combination regimens in the adjuvant setting. There were no significant differences in mortality among 2 studies including platinum and taxane combination therapy (OR=0.28; 95% CI=0.03–2.44; p=0.25). In addition, the mortality in the AC group did not increase significantly in five studies that using platinum and non-taxane combinations (OR=0.67; 95% CI=0.45–0.99; p=0.04). The recurrence rates between groups did not differ significantly, irrespective of the combination regimen.
RCTs overcome numerous weaknesses associated with NRSs and provide the best available data regarding the effect of AC in surgically treated cervical cancer patients. Our meta-analysis included 2 RCTs with 3 stars in the Jadad scoring system. However, the study by Curtin et al. [31] was closed prematurely owing to insufficient accrual; the initial accrual goal was 160 patients but it enrolled only 89 patients. Thus, the data were unable to show that the AC and AR were equivalent. Similarly, the planned accrual goal after statistical sample size calculation was 160 patients for the study by Lahousen et al. [29]. Their final enrolled number was only 52, yielding suboptimal power. Recently, the JGOG launched a confirmatory clinical trial of AC in high-risk, stage IB–IIB cervical cancer after primary radical hysterectomy (JGOG 1082). If the non-inferiority of AC is confirmed in terms of survival compared with AR in this prospective trial, AC could be accepted as the new standard treatment.
Our study had several limitations; thus, the results should be interpreted with caution. First, the majority of the included studies were NRS, although 2 RCTs were also included. While we rigorously performed subgroup-analyses to control for potential confounders, unknown confounders such as surgical quality may not have been excluded. Second, the studies were conducted in different institutions with presumably varying surgical expertise. Third, it was not possible to perform a subgroup analysis of the number of AC cycles or dose of AC because of a lack of data. Therefore, the effect of AC according to these features could not be analyzed. Finally, our meta-analysis did not provide adverse events profiles related to AC or AR. No RCT directly compared adverse events between groups, but several studies suggested lower complication rates with AC [172024].
The results of the present meta-analysis suggest that AC showed similar survival outcomes in surgically treated cervical cancer patients and reduced the risk of distant recurrence when compared with AR. The JGOG trial may provide more evidence on the role of AC in these patients, establishing this strategy be used as an alternative standard treatment option.
 XML Download