

 PDF
PDF Citation
 Print
Print


INTRODUCTION
Dysarthria, a neuromotor speech disorder, is a common symptom of various neurological disorders, including stroke, parkinsonism, and traumatic brain injury.1 With regard to stroke, the prevalence of dysarthria in acute first stroke is 41.5%–53%, and it plays an important role in determining stroke severity.2 Dysarthria has a profound effect on patient function and severely lowers the quality of life.3 Different forms of dysarthria exist; each of which has different speech characteristics and is related to the site of lesion and degree of neurological damage.45 Clinically, dysarthria assessment is performed by speech–language pathologists (SLPs), who subjectively measure articulation and speech intelligibility.6 Dysarthria assessment by SLPs requires substantial effort, and the severity of dysarthria is reported as mild, moderate, or severe.7 Therefore, if there is a tool that can objectively and easily measure the severity of dysarthria, it may be clinically useful to evaluate the disorder and confirm the effect of treatment.
Automatic speech recognition (ASR) is the process by which a computer can recognize spoken language or utterances. Rapid advances in ASR technology have led to the widespread use of ASR systems in various devices, such as smartphones and smart home devices, with a goal of providing an automated assistant system that can transcribe spoken language as accurately as possible. Furthermore, ASR systems specialized for dysarthria have improved ASR performance.7 Several ASR models based on hidden Markov models (HMMs) or artificial neural networks have been utilized.89 Our hypothesis is that quantitative and objective assessment of dysarthria is possible using these ASR algorithms. For example, the fitness of a spoken keyword as assessed using a word-specific HMM may be correlated with the subjective measurement of dysarthria severity by SLPs. The purpose of the present study was to investigate the feasibility of assessing the severity of dysarthria in patients with neurological diseases in a simple and quantitative way using an HMM-based ASR system.
METHODS
Participants and study design
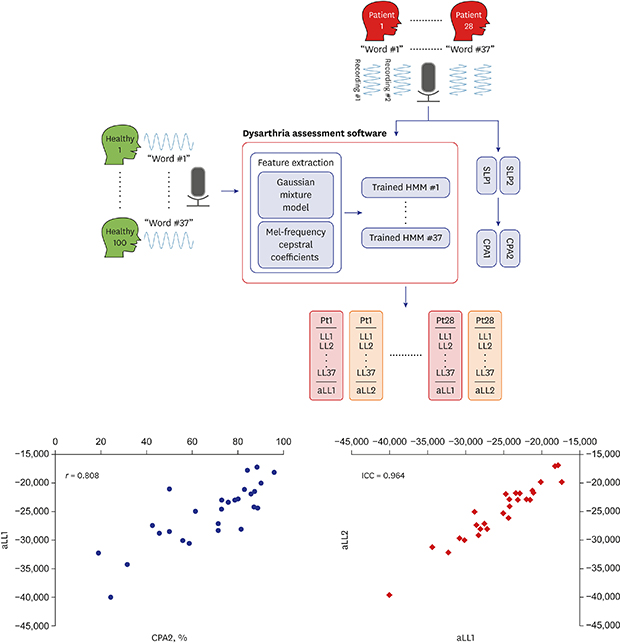
Healthy individuals and patients with dysarthria were recruited. One hundred healthy individuals were used to develop word-specific HMMs; thus, individuals who had experienced any type of neurological disease or laryngeal problems (e.g., vocal cord palsy) or had a strong provincial accent were excluded. Twenty-eight patients with various neurological disorders who complained of discomfort in articulation and had speech dysarthria on neurological examination were included. Patients with severe cognitive impairment, aphasia, or premorbid strong provincial accent were excluded (Table 1). There was one patient with Parkinson's disease who had definite dysarthria without severe hypophonia. All participants were instructed to speak 37 words from the Assessment of Phonology and Articulation for Children (APAC) test, which is a normalized speech assessment tool for the Korean language.10 The words were displayed on a tablet PC, and the utterances were recorded in a quiet control booth (noise level ≤ 40 dB). For the patient group, the recording session was repeated to calculate the test-retest reliability for word-specific HMMs. The patients' recorded utterances were blindly evaluated by two SLPs and then assessed by the dysarthria assessment software using word-specific HMMs (Fig. 1).
Table 1
Clinical characteristics of participants
![]()
 | Fig. 1Study design and word-specific HMM training. Separate HMMs were generated for each of the 37 words in the Assessment of Phonology and Articulation for Children test and HMMs were trained through recordings from 100 healthy individuals. Recordings from 28 patients were applied to the developed dysarthria assessment software to yield aLL. Subsequently, two SLP listen to the recordings and calculate the CPA. Two repeated recordings in the patient group were applied to the software and obtain aLL1 and aLL2 for test-retest reliability.HMM = hidden Markov model, aLL = average log likelihood, CPA = consonant production accuracy.
|
Speech examination by SLPs
Two experienced SLPs listened to the recorded utterances by patients and evaluated the consonant production accuracy (CPA). The CPA is defined as the percentage of correct consonant production and is the only quantitative value provided in the APAC test.11 They listened to repeated recordings from the patient and judged how precisely the consonants were produced in the patient's vocalizations. The two SLPs did not know each other's evaluation results. CPA1 was measured by one SLP and CPA2 by the other.
Word-specific HMMs
A total of 37 HMM-based ASR systems were trained, one for each of the 37 keywords, using the utterances from the healthy group. The number of hidden states for each word-specific HMM was based on the number of phonemes, and each state was represented by a Gaussian mixture model (GMM) with five modalities. We used standard Mel-frequency cepstral coefficients (MFCCs) and their delta and delta–delta; thus, the GMM approximated a set of MFCC-related 39-dimensional feature vectors belonging to the same hidden state. Once the training procedure was completed, the patients' utterances of each word were evaluated using the corresponding HMM, and the log likelihood (LL) was calculated as a measure of fitness. The average of the 37 LL values (average log likelihood [aLL]) was considered to reflect dysarthria severity. The aLL obtained by applying the first recording set was regarded as aLL1 and that obtained by applying the second recording set was regarded as aLL2 (Fig. 1).
Statistical analysis
The Pearson correlation coefficient was used to evaluate the relationship between the aLL and CPA values. Interrater reliability of SLPs and test–retest reliability of dysarthria assessment using HMMs were assessed using the intraclass correlation coefficient. A Bland-Altman plot was used to evaluate the agreement between SLPs.
RESULTS
Assessment of dysarthria by SLPs
The intraclass correlation coefficient between CPA1 and CPA2 was 0.814 (95% confidence interval [CI], 0.779–0.953; P < 0.001). However, the Bland-Altman plot showed remarkable biases between the two measurements (Fig. 2). The mean difference (fixed bias) between CPA1 and CPA2 (CPA1–CPA2) was 18.4%. The limits of agreement determined by the 95% CI were −3.9 to 40.6%, suggesting that SLP1 tended to measure CPA at a high level. A proportional bias was also observed, which was more pronounced when the patient's dysarthria was severe.
 | Fig. 2CPA from two different SLPs. (A) The scatter plot for the CPA value of each patient with both measurements from both SLPs (B) Bland-Altman plot for the CPA value of each patient with measurements from both SLPs. Mean differences are indicated by the solid line and 95% limits of agreement (mean differences ± 1.96 standard deviation of the difference) are shown by the dashed line. The dotted line shows regression lines for proportional biases.CPA = consonant production accuracy, SLPs = speech-language pathologists.
|
Assessment of dysarthria using HMMs
The Pearson correlation coefficients were 0.594 (P < 0.01) between CPA1 and aLL1, 0.564 (P < 0.01) between CPA1 and aLL2, 0.808 (P < 0.01) between CPA2 and aLL1, and 0.757 (P < 0.01) between CPA2 and aLL2 (Fig. 3). CPA2 (measured by SLP2) showed a stronger correlation with aLL than CPA1. The intraclass correlation coefficient between aLL1 and aLL2 was 0.964 (95% CI, 0.923–0.983; P < 0.001), which means that the test–retest reliability of dysarthria assessment using HMMs was excellent. The correlation coefficients between the word-specific LL and CPA1 ranged from 0.322 to 0.838 (Supplementary Table 1).
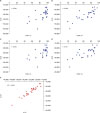 | Fig. 3Comparison between CPA values measured by SLPs and aLL values calculated by word-specific HMMs. (A-D) The scatter plot comparing CPA values from SLPs and aLL values from word-specific HMMs in repetition. (E) The scatter plot of the aLL value obtained by applying the repeated recordings to the HMM.CPA = consonant production accuracy, SLPs = speech-language pathologists, aLL = average log likelihood, HMM = hidden Markov model.
|
DISCUSSION
In this study, we adopted ASR for the assessment of dysarthria in patients with neurological disorders and compared it with conventional speech evaluation by SLPs. The results showed that the numeric values produced by the custom-made word-specific HMMs correlated with the subjectively measured severity by the SLP. Moreover, assessment of dysarthria using HMMs also showed excellent test–retest reliability.
Our study results demonstrated the subjectivity of SLPs in dysarthria assessment, which was one of our study motivations. Although there was a strong inter-rater reliability between the two SLPs, there was a significant bias as indicated by the Bland-Altman plot. The CPA value measured by SLP1 was higher than that measured by SLP2 in all patients. There has been no study on the reliability of APAC testing in Korean language. However, both intra-rater and inter-rater reliability of auditory-perceptual evaluation of dysarthria fluctuates greatly from study to study.612 This is consistent with our clinical experience and justifies the need to develop quantitative and objective assessment technology, such as an ASR system, for dysarthria. There have been several attempts to assess dysarthria using an acoustic analysis with computer devices with an acceptable reliability.1314 However, it has not been widely used in clinics because it is still tedious, complicated, and time-consuming. Our simple approach is seemingly different from the former methodologies because it is not based on the physical parameters from phonological measurement but based on statistical algorithms.
A previous study demonstrated that the ASR recognition rate for dysarthric speech could be predicted by a speech consistency score; however, this measure has not been validated against the gold standard SLP evaluation.15 In the present study, ASR was adopted for dysarthria assessment in patients with neurological disorders and was compared to conventional speech evaluation by experienced SLPs. Our results showed that the objective fitness measures (aLL1 and aLL2) correlate with the perceptual measures of SLPs (CPA) in terms of Pearson correlations between CPA and aLL, which varied from 0.564 to 0.808. An interesting observation is that the correlation values vary depending on the choice of CPAs and not on aLLs. For example, the difference between Fig. 3A and C is only 0.03, where CPA1 is compared against aLL1 and aLL2, while Fig. 3A and B are quite different by 0.214, where CPA1 and CPA2 are compared against aLL1. One of the reason of this phenomenon is proportional bias among SLPs. SLP2 tends to give worse CPA scores to patients with severe dysarthria. This may have affected the spectrum of severity of dysarthria and the higher Pearson correlations with aLL scores. It suggests that the subjective scores from different SLPs could vary more than the word-specific HMMs tested on different dysarthric speech signals. It also suggests that the proposed HMM-based objective metrics at least has a higher test–retest reliability than the CPAs from different SLPs, although we cannot claim the overall reliability of the proposed method out of this observation.
Dysarthria assessment using ASR has several advantages. First, the assessment is not dependent on an SLP, and is therefore, objective, quantitative, and low-cost. Second, ASR can be implanted in mobile devices, enabling self-assessment and the use of telemedicine, which has recently become popular in stroke care.16 Although internet-based telerehabilitation evaluation systems have been proposed for dysarthria, these are based on videoconferencing with an assigned SLP.1718 Using ASR, patients could simply speak keywords into their mobile device, and a prompt assessment can be transferred to health facilities for further analysis. However, with the results of this study, it cannot be justified that the ASR assessment can substitute the conventional evaluation by SLPs. Because the aLL is a numeric value that represents the severity of dysarthria, it does not reflect the various clinical features of dysarthria. In addition, detailed assessment by SLPs from a therapeutic viewpoint is crucial to establishing a treatment plan for dysarthria. Accordingly, our methodology could be used for only the screening or follow-up of dysarthric patients and further investigation is necessary.
The present study has several limitations. First, the healthy individuals used to train the HMMs were likely not the ideal references. Speech characteristics are highly dependent on age and gender. Furthermore, the voices of the patients with dysarthria after stoke are similar to those of healthy aging speakers.19 Thus, HMMs trained using healthy age-matched individuals may render better dysarthria assessment performance. Second, we had only two SLP assessment results, and the comparison between these and the ASR system is limited. Third, the average of log likelihood obtained from 37 word-specific HMMs can also be criticized as an indicator of dysarthria severity. HMM produces a probability value, which is extremely small and is converted to a logarithmic scale. Therefore, a direct comparison between the aLL value and the CPA measured as a percentage is difficult, and the agreement between the two methods cannot be investigated.
From the technical viewpoint of speech recognition, there is still room for improvement. First, instead of designing the HMM to have the same number of hidden states for the phonemes in the target word, a left-to-right HMM model can help improve the training part.20 More importantly, an HMM-based recognition system that is trained from clean speech signals is known to be sensitive to the artifacts that a real-world speech signal can be exposed to, e.g. reverberation, additive interfering signals, band-pass filtering, etc. For example, a dysarthric utterance recorded in a quiet room can get a better score than a normal but noisy utterance. In this study, we get around this problem by recording the dysarthric utterances in the same quiet booth used for collecting normal speech, but this convenient assumption does not always hold true in real-world recordings. Therefore, a practical system must employ the speech enhancement methods to pre-process the real-world recordings before feeding them to the ASR module. Another possible reason of the discrepancy between the subjective APAC scores and the log likelihood values of HMMs could be the fact that HMM takes both consonants and vowels into account, whereas the criteria the APAC test uses are based only on consonants.
Although this is a factor that might degrade the correlation score reported in the Result section, it could also mean that the proposed HMM-based system can be more promising than the APAC test as it evaluates not only consonants but also vowels. The present results suggest that dysarthria evaluation using a thirty seven-words speech recognition system based on word-specific HMMs is feasible in neurological disorders. However, there are many limitations to substitute conventional assessment by SLPs with this system and further upgrades are needed for it to be used in clinical practice.
 XML Download