

 PDF
PDF Citation
 Print
Print


INTRODUCTION
Cataract and glaucoma are the leading causes of blindness worldwide. The incidences of both cataract and elevated intraocular pressure (IOP), with or without glaucoma, increase with age.1 IOP, still the only known modifiable risk factor in the management of glaucoma, is well recognized as a primary risk factor for glaucoma onset, development, and progression.2 Meanwhile, cataract surgery has been suggested to be of clinical benefit for both cataract and glaucoma. It has been found to reduce IOP in eyes with or without glaucoma, though with variable magnitude and as influenced by factors such as anterior-chamber anatomy and angle configuration.34567
The influence of the lens on the etiology of primary angle-closure glaucoma (PACG) is well-established. The lens can incur angle narrowing by pushing the peripheral iris anteriorly, which the effect will be more marked if the lens is also cataractous.58 As such, cataract surgery in cases of PACG has shown promising IOP-reduction results and can also afford less peripheral anterior synechia formation. However, questions remain as to how it might influence the clinical management of healthy subjects and other, open-angle glaucoma (OAG) patients, excluding closed-angle cases. In a previous study, OAG patients did not show as high a reduction of IOP after cataract surgery as their counterparts with closed-angle glaucoma.910 Additionally, some of the studies have recorded immediate IOP elevation after surgery for OAG.511 Other studies have reported that IOP reduction was not high when the preoperative IOP was not high.1213 In this context, the degree of change of IOP after cataract surgery can be unpredictable and various in healthy subjects and OAG patients.
Therefore, in the present study, we investigated how cataract surgery might influence long-term IOP change in both healthy subjects and medically controlled OAG patients.
METHODS
Inclusion and exclusion criteria
The medical records of patients who had undergone cataract surgery and been followed up on for more than 1 year were reviewed. The present study included patients aged 18 years or older who had clear corneal phacoemulsification with posterior-chamber intraocular lens (IOL) implantation. Glaucoma patients with medically controlled OAG (preoperative IOP < 22 mmHg under medication) attending a glaucoma clinic and healthy subjects from the general ophthalmology clinic were enrolled. Glaucoma had been diagnosed in cases where glaucomatous visual field (VF) defect matched optic disc changes. The criteria to be eligible for the healthy subjects were a normal anterior segment on slit-lamp examination, IOP between 10 and 21 mmHg, cup-to-disc ratio of less than 0.6, no retinal nerve fiber layer (RNFL) defects in red-free RNFL photographs, and no glaucomatous VF defects.
The exclusion criteria were primary angle-closure attack, primary angle-closure suspect, PACG, ophthalmic disease (other than cataract) that could affect IOP, previous intraocular surgery, secondary glaucoma such as lens-induced glaucoma, neovascular glaucoma or uveitis, and complications during phacoemulsification. Patients were excluded also if, in the year following phacoemulsification, they underwent any additional non-glaucoma-related surgical or laser procedures such as laser capsulotomy.14
Study assessment
Data on IOP were collected preoperatively and at 1 day, 1 week, 1, 3 and 6 months, and 1, 2 and 3 years postoperatively. The preoperative and postoperative IOP values were derived from the mean of IOP readings taken on two separate days on the regular visit schedule using the Goldmann applanation tonometer. Preexisting (pre-cataract-surgery) glaucoma was evaluated, and glaucomatous patients were defined as those with a glaucomatous VF defect confirmed by two reliable VF examinations and by the presence of glaucomatous optic disc cupping. Glaucomatous optic disc cupping was defined as neuroretinal rim thinning, notching, excavation, or RNFL defect with corresponding VF deficit. All of the patients had preoperative gonioscopy showing open angles without peripheral anterior synechiae or areas of appositional closure. Visual acuity was measured using a Snellen chart. Cataract was graded using Lens Opacities Classification System III (LOCS III).
Phacoemulsification
The indication for surgery was reduced vision attributable to visually significant cataract. If a patient received cataract surgery on both eyes, only one eye was randomly enrolled. The operative procedures were as follows. Under topical anesthesia, a 3.0 mm clear corneal incision was made. After continuous curvilinear capsulorhexis using a bent 27-gauge needle, standard phacoemulsification was performed. A foldable IOL (Tecnis ZCB00 IOL; Abbot Medical Optics, Abbott Park, IL, USA) was inserted into the posterior chamber through the corneal incision. Irrigation-aspiration was performed for at least 30 seconds to remove as much viscoelastic material as possible from the anterior chamber. The IOL was also gently rocked to promote release of all visible viscoelastic material from behind it. The anterior chamber was reformed with balanced saline solution (BSS), and the corneal wound and side port were hydrated with BSS.
Statistical analyses
All of the analyses were performed using SAS version 9.4 (SAS Institute, Cary, NC, USA). Generalized estimating equations (GEE) were used to construct linear models, allowing for adjustable correlation of repetitive IOP checking in individual patients. By univariate and multivariate analyses, the associations between independent variables and the magnitude of postoperative IOP change were evaluated; these variables included gender, age, preoperative IOP, underlying disease, axial length, spherical equivalent, VF index, cataract grade, and presence of glaucoma. The variables selected for the multivariate analysis were those showing a P value less than 0.2 in the univariate analysis. Additionally, multi-collinearity was examined according to the variance inflation factor (VIF), based on which, we selected a variable showing a VIF < 4 in the multivariate analysis. All of the statistical tests were 2-sided with a 0.05 level of significance.
Ethics statement
The present study protocol was reviewed and approved by the Institutional Review Board (IRB) of Hallym University Sacred Heart Hospital (IRB No. 2018-I011). The requirement to obtain written informed consent was waived by the Institutional Review Board of Hallym University Sacred Heart Hospital, because our study was retrospective research based on medical records, and also because this research presented no more than minimal risk of harm to subjects.
RESULTS
A total of 754 eyes of 754 patients were enrolled in the study. One hundred and six (106) were assigned to the glaucoma group and 648 to the healthy group. The mean follow-up period was 1.59 ± 0.82 years in the healthy group and 1.47 ± 0.62 years in the glaucoma group (P = 0.128) (Table 1). There were no differences in the baseline demographics between the two groups, except for better preoperative visual acuity in the glaucoma group (P = 0.011). In detail, the glaucoma group consisted of 55 normal-tension glaucoma (NTG), 39 primary open-angle glaucoma (POAG), and 12 pseudoexfoliation glaucoma (PXG) patients (Supplementary Table 1). Additionally, Supplementary Table 2 summarizes the comparison of the baseline demographics and clinical features between patients with 1 and 3 years of follow up, respectively. There were no differences in the clinical characteristics between the two groups.
Table 1
Baseline demographics and clinical features of healthy subjects and glaucoma patients
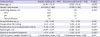
Values are presented as mean ± standard deviation.
HTN = hypertension, DM = diabetes mellitus, IOP = intraocular pressure, LOCS III = lens opacities classification system III.
aIndependent samples t-test; bχ2 test.
![]()
Serial change of IOP
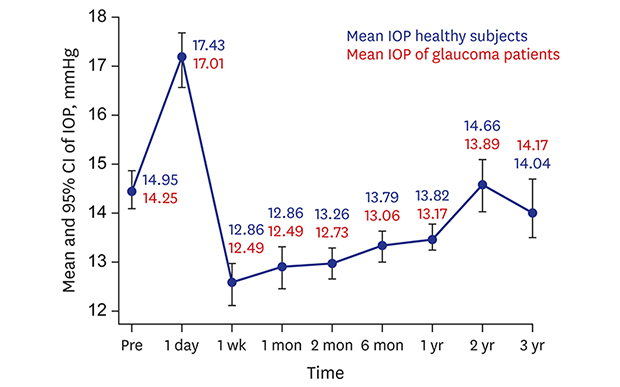
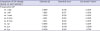
Fig. 1 plots the change in mean IOP values over time for all of the patients. The preoperative mean IOP was 14.48 ± 3.37 mmHg, which, by postoperative 1 day, had increased to 17.17 ± 6.15 mmHg. However, by postoperative 1 week, the IOP had decreased again, to 12.59 ± 3.84 mmHg. After postoperative 1 week, the mean IOP again showed an increasing tendency, as follows: 12.94 ± 3.71 mmHg at 1 month, 12.99 ± 3.21 mmHg at 3 months, 13.36 ± 3.13 mmHg at 6 months, 13.49 ± 2.97 mmHg at 1 year, 14.59 ± 3.35 mmHg at 2 years, and 14.03 ± 2.83 at 3 years.
 | Fig. 1Serial change of mean IOP and 95% CIs for all of the patients and each time-point.The vertical bars indicate the 95% CIs at the baseline, postoperative 1 day, 1 week, 1, 3, 6 months, and 1, 2, 3 years. The confidence intervals of the subsequent time-points lying outside the vertical bar are statistically significant. Additionally, the blue and red text indicates the mean IOP values for the healthy subjects and glaucoma patients, respectively.
IOP = intraocular pressure, CI = confidence interval.
|
Additionally, this study investigated the changes of mean IOP for both groups, healthy subjects and glaucoma patients, respectively (Table 2). There was no significant inter-group difference. After phacoemulsification, both groups showed immediate IOP elevation at postoperative 1 day; however, the mean IOP was decreased. In fact, from postoperative 1 week to 1 year, the mean IOP of both groups remained lower than the preoperative value. The IOP-lowering effect of phacoemulsification over the course of 1 year of follow up did not statistically differ between the healthy subjects and glaucoma patients (P > 0.05, respectively).
Table 2
Serial changes of mean IOP for healthy subjects and glaucoma patients
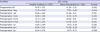
Values are presented as mean ± standard deviation.
IOP = intraocular pressure.
aIndependent samples t-test; bn = 232 healthy subjects vs. 46 glaucoma patients, cn = 144 healthy subjects vs. 28 glaucoma patients.
![]()
Degree of change of IOP for total patient group
The current study investigated, at each follow-up point, the degree of change from the preoperative IOP using the GEE method (Table 3). There was a positive tendency of change between the preoperative value and postoperative 1 day (P < 0.001); however, each subsequent follow-up point, from postoperative 1 week to 1 year, showed a negative coefficient value (all P < 0.001). Note though that the change of IOP at postoperative 1 year had a less steeply decreasing slope (correlation coefficient, −0.993) than those at postoperative 1 week and 1 month (correlation coefficients, −1.893 and −1.540, respectively).
Table 3
Analysis of preoperative IOP change at each follow-up point
![]()
The present study also investigated, for the total patient group, the distribution of IOP change between the preoperative value and that of the final follow up, as plotted on a box-and-whisker graph (Fig. 2). The mean difference between the preoperative value and the final follow up was −1.01 ± 3.74 mmHg (range, −17.0 to 10.0 mmHg). Each IOP change showed a significant difference by Wilcoxon signed rank test (P < 0.001). Further, the number of antiglaucoma medications between the preoperative value and that of the final follow up also decreased, from 1.45 ± 0.89 to 1.27 ± 0.82 (P = 0.025) (Supplementary Table 1).
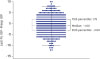 | Fig. 2Box-and-whisker graph of distribution of IOP change between final FU and preoperatively.The graph shows the median, interquartile, and range of difference of IOP (Last FU IOP−Preop IOP) for the overall group of patients (n = 754). The top of the box represents the third quartile (75th percentile; value, 1.75), and the bottom indicates the first quartile (25th percentile; value, −3.00) of the IOP-percentile difference. The median of the distribution is indicated by the horizontal line within the box. The median value (= −1.00) is located in a mild negative value. The highest line represents the high 95% confidence value and the lowest line the low 95% confidence value.
IOP = intraocular pressure, FU = follow up.
|
Univariate and multivariate analyses
Table 4 shows the data from univariate and multivariate analyses of the associations of baseline demographics and preoperative clinical features with postoperative IOP change at a fixed follow-up time. In the univariate analysis, age, preoperative IOP, preoperative spherical equivalent, and axial length showed significant associations with IOP change (P < 0.001, < 0.001, 0.027, and < 0.001, respectively) (Table 4). In the multivariate analysis employing a backward-elimination method, only age and preoperative IOP showed significant associations with IOP change (all, P < 0.001). Specifically, age was negatively correlated with IOP change (regression coefficient, −0.034), while preoperative IOP was positively correlated (regression coefficient, 0.419).
Table 4
Univariate and multivariate analyses of baseline demographics, preoperative clinical features, and IOP at fixed follow-up time
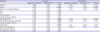
The numbers in bold and italics denote that the association is statistically significant (P < 0.05).
IOP = intraocular pressure, DM = diabetes mellitus, HTN = hypertension, LOCS III = lens opacities classification system III, VF = visual field, MD = mean deviation, PSD = pattern standard deviation.
aAnalysis using Generalized Estimating Equations method.
![]()
DISCUSSION
Many earlier studies on IOP change after cataract surgery in glaucoma patients have included angle-closure glaucoma.410151617 Meanwhile, the distribution of glaucoma in Korea is different from those in other countries, and the majority of glaucoma cases are composited with NTG.18 Therefore, in this study, we investigated how IOP changed in various ways after cataract surgery on open glaucoma and healthy subjects in Korea. For the total patient group, preoperatively the mean IOP was 14.48 ± 3.37 mmHg, which decreased to 13.49 ± 2.97 mmHg by postoperative 1 year, and the mean difference between the preoperative and final follow-up values was −1.01 ± 3.74 mmHg (Figs. 1 and 2). In detail, phacoemulsification showed a 1.03 ± 3.72 mmHg IOP reduction in the healthy subjects and a 1.08 ± 3.79 mmHg reduction in the glaucoma patients.
Previous studies have reported post-phacoemulsification IOP reductions from 1.1 mmHg to 3.5 mmHg in non-glaucomatous36192021and 1.0 mmHg to 5.5 mmHg in glaucomatous eyes.57910111213151617202223 Phacoemulsification in our study showed a similar pattern of IOP reduction, though the degree of reduction (1.03 mmHg and 1.08 mmHg in healthy subjects and glaucoma patients, respectively) was relatively lower than in previous studies.351220
There are possible explanations for this. The single most-common significant factor associated with greater IOP drop after phacoemulsification is higher IOP before phacoemulsification.1112132224 However, the preoperative IOP in the glaucoma group was 14.25 ± 3.35 mmHg, lower than that of the glaucoma groups in the relevant previous studies.5121324252627 Furthermore, in some of those studies,5242527 most of the enrolled glaucoma patients were high-tension glaucoma, whereas in the present study, NTG patients were a relatively high proportion (55 patients, 50.4%) of the total group, as is common in Korea,18 which fact is thought to have also contributed to the modest extent of IOP reduction achieved. Additionally, the present study excluded closed- and narrow-angle patients. Indeed, IOP reduction after cataract surgery is much higher in patients with closed-angle glaucoma than in those with OAG.101112132224 Similarly, higher IOP reduction for narrow-angle patients was well demonstrated in Hayashi's7 study on 74 eyes with ACG and 68 eyes with OAG. The ACG group's preoperative IOP, 21.4 ± 3.9 mmHg, was reduced to 14.5 ± 2.6 mmHg, and the OAG group's 20.7 ± 5.4 mmHg to 15.2 ± 3.8 mmHg, after 24 months of follow up. Certainly therefore, the initial exclusion of angle-closure patients in our study significantly blunted IOP-reducing effect of cataract surgery.
Among our present findings, IOP reduction was the highest at 1 week postoperatively, the degree of reduction gradually decreasing until 2 years postoperatively (Fig. 1). Accordingly, the postoperative IOP at 2 and 3 years showed no significant difference compared with the preoperative IOP (Table 3). In other words, the effect of IOP reduction regressed over time. This long-term regression phenomenon might be related to the mechanism of post-cataract-surgery IOP reduction. According to a study by Meyer et al.28, reduced trabecular outflow facility in otherwise healthy eyes can be improved by phacoemulsification. Therefore, it can be assumed that with the temporary improvement of outflow facility, the degree of IOP drop will also be lessened. However, the mechanism of IOP reduction after cataract surgery cannot be explained by a single mechanism. The present results for the healthy subjects and glaucoma patients in terms of postoperative IOP reduction strongly suggest another mechanism of IOP reduction. Our comparison of the postoperative IOP decrease in eyes with and without glaucoma at postoperative 1 year showed no statistically significant difference. If the decrease in IOP had been caused by an increase in trabecular outflow, a greater IOP reduction should have been shown in the healthy group, because the function of trabecular outflow is compromised in glaucomatous eyes. Therefore, in terms of outflow facility as it relates to IOP drop after cataract surgery, it could be assumed that the uveoscleral pathway plays a larger role than trabecular outflow in OAG. Similarly to our hypothesis, endogenous prostaglandin F2 released postoperatively is thought to enhance uveoscleral outflow.2829 Another study has reported that expansion of the Schlemm's canal was observed after cataract surgery.30
In the present multivariate analysis results, there was a significant association of IOP change with both preoperative IOP and age. In detail, higher preoperative IOP and younger age were associated with greater IOP reduction at a specific follow-up time point after phacoemulsification (r = 0.419 and r = −0.034, all P < 0.001) (Table 4). As is well known, higher preoperative IOP is a significant factor associated with greater reduction of IOP.11132224 On the other hand, prospective studies have reported that higher IOP before phacoemulsification is associated with a higher likelihood of IOP failure after phacoemulsification.724 In the present study, subjects with newly started or added glaucoma medications after cataract surgery had a higher preoperative IOP, 16.48 ± 4.67 mmHg, than did the total subjects (14.48 ± 3.37 mmHg; P < 0.001; data not shown).Therefore, in patients with high preoperative IOP, cataract surgery can be beneficial in terms of IOP reduction, but the risk of surgery and IOP failure increase as well. Another notable finding of the present study is the correlation of younger age with a greater IOP lowering effect after surgery when controlling for time and other associated factors (r = 0.034). In general, we can expect that the lens of older people, due to its increased size, will have an effect on outflow and, thus, that it will affect IOP more than in younger people; therefore, greater IOP reduction is to be expected in older individuals.31 The exact mechanisms of this greater IOP decrease in younger patients remain unclear, but there are two possible causes. First, in contrast to previous studies, cases of angle-closure glaucoma, which occurs predominantly in old age, were intentionally excluded, which fact might have lowered the degree of IOP reduction after cataract surgery in older patients. Second, Meyer et al.28 reported that a reduced preoperative coefficient of aqueous outflow and biochemical or blood-aqueous barrier alterations with release of prostaglandins might improve outflow facility.32 Based on this study, the mechanism of higher IOP reduction in young age might be inferred to be the result of either improved postoperative outflow facility or prostaglandin-mediated inflammatory response. Further, related investigations are needed.
Overall, our results are consistent with findings in previous studies that indicate improved glaucoma control after phacoemulsification.5733 In this respect, for a patient with cataract but mild, well-controlled glaucoma requiring few medications, phacoemulsification alone is a reliable option. However, depending on glaucoma severity, the treatment approach should be tailored to individual patients. This is especially so given the risk of complications associated with this surgery, most notably hypertensive spikes and visual-acuity loss resulting from the immediate and sharp postoperative IOP increase and fluctuations thereafter (as seen in this study, a preoperative IOP of 14.48 mmHg had increased to 17.17 mmHg by postoperative 1 day).23343536 In cases of moderate and severe glaucoma, therefore, surgeons should exercise a higher degree of attention. As noted earlier, the effect of post-phacoemulsification IOP reduction lessened over time, and postoperative IOP might regress to the baseline level. Therefore, long-term monitoring of IOP change is needed even though IOP reduction is achieved in the early phase of follow up.
There are some limitations to this study. First, the number of participants in the follow up fell significantly after 1 year. The initial total of 754 subjects had decreased to 278 at 2 years, and then again to 172 at 3 years. The minimum sample size required for regression analysis using the GEE method was calculated as 68 patients after setting the effect size at 0.15, the α error probability at 0.05, and the 1-β error probability at 0.8. Although the numbers of patients at postoperative 2 and 3 years satisfied the minimum sample size, there remained, due to this study's retrospective design, a possibility of selection bias in favor of higher-IOP patients, and such bias might have played a role in the elevation of mean IOP after 2 years of follow up (Fig. 1). Second, our study enrolled only medically controlled glaucoma patients (IOP < 30 mmHg); participants who would likely be highly associated with IOP spikes and IOP failure after cataract surgery had been selectively excluded. This selection bias might have resulted in IOP-reduction overestimation.
In conclusion, phacoemulsification results in IOP reduction, which effect was lessened in healthy subjects and glaucoma patients over the course of a long-term follow up. In cases of higher preoperative IOP and young patients, phacoemulsification alone is a reliable option for IOP control. However, we also should consider the risk of early-phase IOP elevation and IOP failure. Above all, notwithstanding the fact that IOP reduction can be achieved after phacoemulsification in the early phase of follow up, long-term monitoring of IOP change is necessary, because the effect of IOP reduction cannot necessarily be maintained. We hope that our results will prove useful to physicians who are planning cataract management, especially for patients with glaucoma.
 XML Download