Journal List > Yonsei Med J > v.58(4) > 1119863

Yadav, Lee, Kim, Ryu, Huh, Bae, Ahn, Chung, Park, and Koh: Combined Effect of Initial and Longitudinal Increases in γ-Glutamyltransferase on Incident Metabolic Syndrome: ARIRANG Study

Abstract

Purpose

Although γ-glutamyltransferase (GGT) is well known to be associated with metabolic syndrome (MS), prospective data on baseline and longitudinal changes in GGT levels and incident cases of MS are limited. We aimed to examine prospective associations between changes in GGT levels over time, as well as at baseline, and incident MS in Korean adults.

Materials and Methods

A total of 2579 Korean adults free of MS were followed up for 2.6 years. Data were collected from 2005–2008 (baseline) and from 2008–2011 (follow-up). Serum GGT levels were determined by enzymatic methods.

Results

During follow-up, 558 participants (21.6%) developed MS. A gradual increase in the incidence of MS was observed across GGT quartiles. After adjustment for confounding factors, the odds ratio and 95% confidence interval (CI) for new onset MS, comparing the highest to the lowest quartiles of baseline GGT, was 2.07 (95% CI: 1.52–2.80). The odds ratio for the highest GGT changes (>4 IU/L increase) in comparison to the lowest GGT changes (<-5 IU/L decrease) was 1.75 (95% CI: 1.32–2.33). Among participants with baseline GGT concentrations <the median, the odds ratio for incident MS, comparing participants with the highest GGT changes with the lowest GGT changes, was 1.52 (95% CI: 1.01–2.31). Among participants with baseline GGT concentration ≥the median, the corresponding odds ratio was 2.75 (95% CI: 1.84–4.10).

Conclusion

High initial GGT concentration and increases in GGT concentration over time should be considered independent predictors of and to have a combined effect on incident MS.

INTRODUCTION

Serum γ-glutamyltransferase (GGT) is a cell surface liver enzyme that participates in the extracellular catabolism of glutathione, which is a powerful antioxidant.1 Traditionally, GGT has been recognized as a biomarker of hepatobiliary disease and excessive alcohol consumption.2 However, serum levels of GGT have also been shown to be a biomarker for the development of cardiovascular risk factors, including hypertension and type 2 diabetes.345 Epidemiological studies have also noted an association between elevated GGT levels and increased risk for cardiovascular morbidity and mortality.678
Previous studies have reported that oxidative stress and chronic inflammation are involved in the pathogenesis of obesity-related metabolic disorders.910 Elevated GGT has been postulated to be a suitable marker of oxidative stress and the inflammatory response, which are key players in the pathogenesis of several metabolic diseases.11 Metabolic syndrome comprises a combination of several metabolic risk factors, including central obesity, hypertriglyceridemia, high blood pressure, low high density lipoprotein (HDL) cholesterol, and elevated blood glucose. The syndrome is a serious global public health concern, because it elevates the risks of developing type 2 diabetes and cardiovascular disease.1213
A wide range of cross-sectional and prospective studies have investigated the relationship between baseline GGT and the development of metabolic syndrome.14151617 To our knowledge, only one study has evaluated the ability of longitudinal changes in GGT to predict metabolic syndrome in middle-aged Korean men.18 However, the study involved limitations of using body mass index (BMI) instead of waist circumference (WC). Indeed, WC has been shown to be more effective than BMI for predicting obesity-related health risks, including metabolic syndrome.192021 Therefore, we used WC as a criterion to define obesity for diagnosing metabolic syndrome.
In this study, we hypothesized that both initial GGT concentration and further increases in GGT concentration over time might be associated with an increased risk of incident metabolic syndrome. We, thus, prospectively investigated associations between 1) baseline serum GGT concentrations, 2) changes in GGT concentrations over time, and 3) the combined effect of changes in GGT levels over time and baseline GGT with the development of incident metabolic syndrome over 2.6 years of follow-up, adjusting for key potential confounders.

MATERIALS AND METHODS

Subjects

This analysis used data from a prospective cohort study that was carried out from November 2005 to January 2008. This observation study, called “Korean Genome and Epidemiology Study on Atherosclerosis Risk of Rural Areas in the Korean General Population (KoGES-ARIRANG)”, mainly recruited participants who resided in the rural areas of Wonju and Pyeongchang in South Korea. The participants were middle-aged men and women between 40 to 70 years. Demographic shifts are rare in these areas; hence, long term follow-up can be performed on this population.
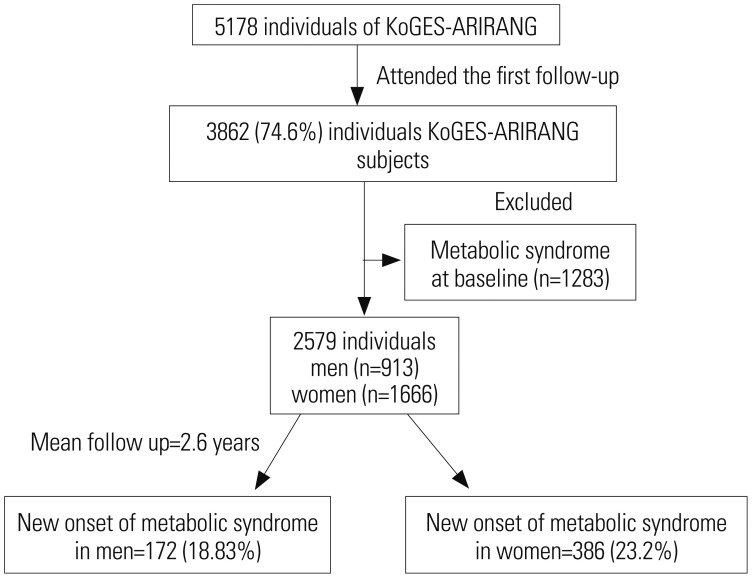
The baseline survey comprised 5178 adults (2127 men and 3051 women). A total of 3862 (74.6%) adults participated in the first follow-up survey (April 2008 to January 2011).15 In total, 1283 participants were excluded due to having metabolic syndrome at baseline. Thus, a total of 2579 participants without metabolic syndrome at baseline were included in the final analysis (Fig. 1).

Data collection of anthropometric and metabolic characteristics

At baseline and at the follow-up survey, participants underwent a comprehensive health examination that included patient medical history and completing a lifestyle questionnaire. Body weight and height were measured with the participants standing barefooted and wearing light indoor clothing. BMI was calculated as the ratio of weight (in kilograms) and the square of the height (in meters). WC was obtained with a tape measure (SECA-200; SECA, Hamburg, Germany) as described previously.15 Systolic (SBP) and diastolic blood pressures (DBP) were measured using a standard mercury sphygmomanometer. The mean of two readings of SBP and DBP was used for the analysis. Alcohol intake and smoking status were determined by the questionnaire and were represented in units of g/day and packs/day, respectively. Total alcohol consumption was calculated as the sum of the intakes of soju, beer, wine, liquor, and other alcoholic beverages per day. Participants who answered yes to the question, “Do your routinely perform physical exercise strenuous enough to make you sweat?” were categorized into the regular exercise group.
After fasting for more than 12 h or overnight, venous blood samples were collected from the participants. Blood glucose, serum HDL-cholesterol (HDL-C), triglyceride (TG), low density lipoprotein-cholesterol, aspartate transaminase, alanine transaminase (ALT), and GGT concentrations were measured by enzymatic methods (ADVIA 1650, Siemens, Tarrytown, NY, USA). The intra-assay and interassay coefficient of variation for GGT ranged from 1.8% to 5.3%. Glycated hemoglobin (HbA1c) was measured using a high-performance liquid chromatography Variant II Turbo machine (Bio-Rad, Hercules, CA, USA). Fasting insulin was determined by a double-antibody radioimmunoassay using a commercial kit (Biosource Europe SA, Nivelles, Belgium). Insulin resistance was calculated by the homeostasis model assessment of insulin resistance (HOMA-IR) model.22

Endpoint definition

The study endpoint was to estimate the new onset of metabolic syndrome, as defined by the harmonizing definition.23 According to this definition, metabolic syndrome is diagnosed by the presence of at least three of the following criteria: 1) abdominal obesity, defined by a WC of ≥90 cm for men or ≥85 cm for women (followed Korean Society of Obesity);24 2) hypertriglyceridemia, defined as a serum TG concentration ≥150 mg/dL; 3) low HDL-C, defined as a serum HDL-C concentration <40 mg/dL for men or <50 mg/dL for women; 4) high blood pressure, defined as a SBP ≥130 mm Hg, a DBP ≥85 mm Hg, or participants treated with antihypertensive agents; and 5) high fasting glucose, characterized by fasting serum glucose ≥100 mg/dL or previously known type 2 diabetes.

Ethics statement

All participants provided written consent before the outset of the study. The protocol was approved by the Institutional Review Board (IRB; CR105024-026) of Wonju Severance Christian Hospital.

Statistical methods

Data are expressed as means±SDs. Our study evaluated whether GGT levels at baseline are associated with any of the anthropometric and/or metabolic variables. Univariate analysis was performed to compare the characteristics of the participants based on quartiles of GGT using one-way ANOVA. The study participants were stratified into quartile categories according to baseline GGT concentrations using the following cut-offs: 11, 12 to 16, 17 to 27, and >28 IU/L. A multivariable logistic regression model was used to analyze the association between GGT at baseline and new onset of metabolic syndrome after adjustment for various conventional risk factors. The odds ratio (OR) of incident metabolic syndrome was calculated by comparing participants in the first quartile to successive quartiles of GGT using a logistic model.
To evaluate the relationship of longitudinal changes in GGT and the risk of metabolic syndrome, the linear trend across GGT change was calculated, taking the first quartile as a reference. The associations between changes in GGT (decrease <-5, decrease -4 to -1, increase 0 to 3, increase >4) and the risk of incident metabolic syndrome over 2.6 years were analyzed using multivariable logistic regression analysis. The overall adjusted models used in this study included model 1, model 2, and model 3. The first model included age (continuous variable) and sex. The second model included all of the variables of model 1, in addition to smoking, alcohol intake (continuous variable), and regular exercise (yes/no). The third model included the aforementioned confounding factors (models 1 and 2) plus total cholesterol (continuous variable) and BMI (continuous variable).
Lastly, we analyzed whether the relationship between GGT change and incident metabolic syndrome was modified by baseline serum GGT levels. To this end, we used the median levels of GGT as the cut-off point in stratified analysis and calculated the OR for incident metabolic syndrome according to change in GGT over the 2.6 years in relation to the subgroups of baseline GGT level (baseline GGT levels less than the median and greater than the median). The OR and 95% confidence interval (CI) were calculated and represented the results of logistic regression analysis. All analyses were performed using SAS, version 9.2 (SAS Institute, Cary, NC, USA). p values<0.05 were considered to indicate statistical significance.

RESULTS

Patient characteristics

After a mean follow-up of 2.6 years, 558 participants (21.6%) developed metabolic syndrome (Fig. 1). Baseline age, BMI, WC, alcohol intake, smoking, total cholesterol, SBP and DBP, TG, HOMA-IR, ALT and HbA1c were progressively higher and HDL-C was significantly lower with increasing quartiles of baseline GGT (all p-value<0.01) (Table 1).

New onset metabolic syndrome and its components stratified by GGT quartile

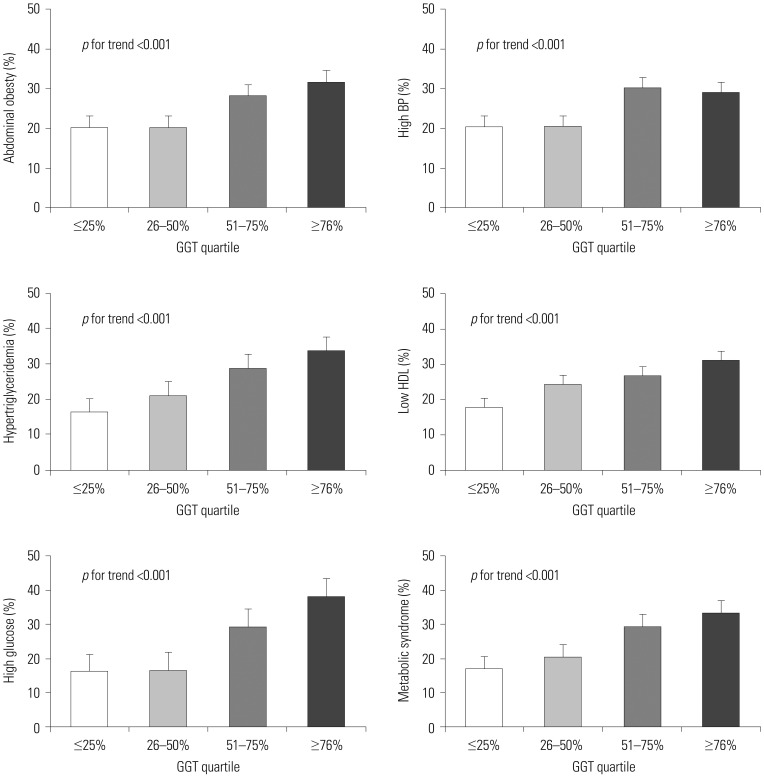
A stepwise increase in the incidence of metabolic syndrome was observed as GGT quartiles progressed from the lowest (13.7%) to highest GGT quartile (27.6%). The incidence of each component of metabolic syndrome was also significantly increased with increasing quartiles of baseline GGT (all p for trend <0.001) (Fig. 2).

Association between incident metabolic syndrome and GGT at baseline

The association between incident metabolic syndrome and baseline GGT level is shown in Table 2. In multivariable adjusted models (model III) (Table 2), the OR for new onset of metabolic syndrome, comparing the highest to the lowest quartile of baseline GGT, was 2.07 (95% CI 1.52–2.80; p for trend <0.001).

Association between incident metabolic syndrome and change in GGT

The association between incident metabolic syndrome and GGT change over the 2.6 years is shown in Table 3. The OR for the highest GGT changes (>4 IU/L increase) with the lowest GGT changes (<-5 IU/L decrease) were 1.75 (95% CI, 1.32–2.33), with statistically significant tests for trend (p<0.001).

Adjusted odds ratio for incident metabolic syndrome by change in GGT during 2.6 years and GGT at baseline

Among participants with baseline GGT concentrations <the median, the fully adjusted OR for incident metabolic syndrome, comparing participants with the highest GGT changes with the lowest GGT changes, was 1.52 (95% CI, 1.01–2.31). Among participants with baseline GGT concentrations ≥the median, the corresponding OR was 2.75 (95% CI, 1.84–4.10). The full adjusted ORs were significantly higher in participants with GGT changes over time above the median, compared with those with GGT changes below the median (all p<0.01), and demonstrated a combined effect for changes in GGT levels over time and baseline GGT (model III) (Table 4).

DISCUSSION

In this prospective cohort of apparently healthy between 40 to 70 years subjects, high baseline GGT concentration and increases in GGT concentration over time were associated with an increased risk of incident metabolic syndrome, independent of age, sex, smoking status, alcohol, exercise, BMI, and total cholesterol. The combined increase in the risk was particularly evident in subjects with high baseline GGT concentrations and increasing GGT concentrations between the initial and follow-up visits. Our findings support the hypothesis that high and increasing GGT concentrations over time should be considered as combined predictors for incident metabolic syndrome.
The association between serum GGT levels and incident metabolic syndrome has been controversial. A few previous studies have concluded that serum GGT level, even when it is within the reference range, can independently predict the onset of metabolic syndrome.1825 Our study clearly showed that a stepwise increase in baseline GGT levels significantly increases the risk of incident metabolic syndrome (from 13.7 to 27.6%) and the incidence of each component of metabolic syndrome.
There are very limited data in the literature as to whether changes in serum GGT levels over time influence the risk of incident metabolic syndrome. Ryu, et al.18 postulated an association between longitudinal change in GGT and metabolic syndrome in middle-aged Korean men. However, this study was limited in that it used the modified National Cholesterol Education Program definition of metabolic syndrome with BMI instead of WC. Our data clearly support the notion that increasing serum concentrations over time are associated with an increased risk of developing metabolic syndrome.
Our data also showed that the OR of incident metabolic syndrome is significantly increased when we stratified participants according to the median baseline GGT concentration. These data imply that baseline GGT values are an effect modifier of changes in serum GGT levels over time. The robust association between GGT changes and incident metabolic syndrome may imply that GGT changes, as well as initial GGT, play a key role in the development of metabolic syndrome.
Although this prospective study clearly demonstrated an association between an increase in GGT levels over time and incident metabolic syndrome, the exact mechanism for this association was not fully elucidated. Several possible explanations can be proposed: Serum levels of GGT have been recommended as a marker of oxidative stress.1126 Increases in serum GGT activity are responsible for the transport of excess glutathione into cells and for glutathione metabolism, which leads to oxidative stress.27 Accumulating evidence has suggested that oxidative stress plays a paramount role in the pathogenesis of metabolic syndrome.2829 Therefore, we hypothesized that elevated GGT levels may be associated with the development of metabolic syndrome. However, further studies are needed to examine other oxidative stress markers in participants with metabolic syndrome and to ascertain the precise mechanism underlying this phenomenon. Subjects with high GGT, even within the normal reference level, often exhibit nonalcoholic fatty liver disease, which is closely related to the accumulation of visceral fat and obesity.4 Excess fat in the liver contributes to the development of systemic insulin resistance and hyperinsulinemia.3031 Additionally, the inflammatory reaction that is activated by elevated GGT impairs normal insulin metabolism in the liver and other organs.3233 Thus, GGT is a potential predictive marker in the pathogenesis of metabolic syndrome. We speculate that insulin resistance, inflammation, and oxidative stress may play substantial roles in the noted association between increased GGT and metabolic syndrome development.
Our study had several limitations. First, the study included middle-aged and elderly Koreans residing in rural settings with a higher prevalence and incidence of metabolic syndrome. The higher prevalence of metabolic syndrome in these regions may be explained, at least in part, by increased adoption of a Western lifestyle.34 Therefore, our study results may not be broadly applicable to non-Korean populations. Secondly, we could not assess risk factors in 25% of the population due to patient loss during follow-up, which may have influenced our results and led to an underestimated risk of metabolic syndrome. Thirdly, our follow-up period was only 2.6 years, meaning that we could not assess if the association between GGT changes and incident metabolic syndrome persisted over a long period. Finally, increase in GGT level during the study period might not be directly associated with incident metabolic syndrome, because this study did not examine the exact date of incident metabolic syndrome. Despite these limitations, the main strength of our study was its prospective design. Using this design, we observed a stepwise increase in the relationship between GGT and metabolic syndrome. Moreover, the robust association between GGT changes and incident metabolic syndrome may imply that GGT changes play a pivotal role in the development of metabolic syndrome.
In conclusion, our study demonstrates that a longitudinal increase in GGT, even when GGT remains within the normal range, is an independent predictor of metabolic syndrome. Therefore, careful observation of temporal trends in GGT is necessary to reduce the risk of metabolic syndrome.

ACKNOWLEDGEMENTS

This study was supported in part by a grant from the Korea Centers for Disease Control and Prevention (2005-E71013-00, 2006-E71002-00, 2007-E71013-00, 2008-E71004-00, 2009-E71006-00, 2010-E71003-00).

Notes

The authors have no financial conflicts of interest.

References

1. Emdin M, Pompella A, Paolicchi A. Gamma-glutamyltransferase, atherosclerosis, and cardiovascular disease: triggering oxidative stress within the plaque. Circulation. 2005; 112:2078–2080. PMID: 16203922.
2. Whitfield JB. Gamma glutamyl transferase. Crit Rev Clin Lab Sci. 2001; 38:263–355. PMID: 11563810.
crossref
3. Lee DH, Ha MH, Kim JH, Christiani DC, Gross MD, Steffes M, et al. Gamma-glutamyltransferase and diabetes--a 4 year follow-up study. Diabetologia. 2003; 46:359–364. PMID: 12687334.
4. Lee DH, Jacobs DR Jr, Gross M, Kiefe CI, Roseman J, Lewis CE, et al. Gamma-glutamyltransferase is a predictor of incident diabetes and hypertension: the Coronary Artery Risk Development in Young Adults (CARDIA) Study. Clin Chem. 2003; 49:1358–1366. PMID: 12881453.
5. Kim NH, Huh JK, Kim BJ, Kim MW, Kim BS, Kang JH. Serum gamma-glutamyl transferase level is an independent predictor of incident hypertension in Korean adults. Clin Exp Hypertens. 2012; 34:402–409. PMID: 22471622.
crossref
6. Lee DS, Evans JC, Robins SJ, Wilson PW, Albano I, Fox CS, et al. Gamma glutamyl transferase and metabolic syndrome, cardiovascular disease, and mortality risk: the Framingham Heart Study. Arterioscler Thromb Vasc Biol. 2007; 27:127–133. PMID: 17095717.
7. Ruttmann E, Brant LJ, Concin H, Diem G, Rapp K, Ulmer H. Vorarlberg Health Monitoring and Promotion Program Study Group. Gamma-glutamyltransferase as a risk factor for cardiovascular disease mortality: an epidemiological investigation in a cohort of 163,944 Austrian adults. Circulation. 2005; 112:2130–2137. PMID: 16186419.
8. Wannamethee G, Ebrahim S, Shaper AG. Gamma-glutamyltransferase: determinants and association with mortality from ischemic heart disease and all causes. Am J Epidemiol. 1995; 142:699–708. PMID: 7572939.
crossref
9. Abete I, Goyenechea E, Zulet MA, Martínez JA. Obesity and metabolic syndrome: potential benefit from specific nutritional components. Nutr Metab Cardiovasc Dis. 2011; 21(Suppl 2):B1–B15. PMID: 21764273.
crossref
10. Roberts CK, Barnard RJ, Sindhu RK, Jurczak M, Ehdaie A, Vaziri ND. Oxidative stress and dysregulation of NAD(P)H oxidase and antioxidant enzymes in diet-induced metabolic syndrome. Metabolism. 2006; 55:928–934. PMID: 16784966.
crossref
11. Lee DH, Blomhoff R, Jacobs DR Jr. Is serum gamma glutamyltransferase a marker of oxidative stress? Free Radic Res. 2004; 38:535–539. PMID: 15346644.
12. Sattar N, McConnachie A, Shaper AG, Blauw GJ, Buckley BM, de Craen AJ, et al. Can metabolic syndrome usefully predict cardiovascular disease and diabetes? Outcome data from two prospective studies. Lancet. 2008; 371:1927–1935. PMID: 18501419.
crossref
13. Scott R, Donoghoe M, Watts GF, O'Brien R, Pardy C, Taskinen MR, et al. Impact of metabolic syndrome and its components on cardiovascular disease event rates in 4900 patients with type 2 diabetes assigned to placebo in the FIELD randomised trial. Cardiovasc Diabetol. 2011; 10:102. PMID: 22104275.
crossref
14. Lee MY, Koh SB, Koh JH, Nam SM, Shin JY, Shin YG, et al. Relationship between gamma-glutamyltransferase and metabolic syndrome in a Korean population. Diabet Med. 2008; 25:469–475. PMID: 18346161.
15. Kim JY, Ahn SV, Yoon JH, Koh SB, Yoon J, Yoo BS, et al. Prospective study of serum adiponectin and incident metabolic syndrome: the ARIRANG study. Diabetes Care. 2013; 36:1547–1553. PMID: 23275369.
16. Kawamoto R, Kohara K, Tabara Y, Miki T, Otsuka N. Serum gamma-glutamyl transferase levels are associated with metabolic syndrome in community-dwelling individuals. J Atheroscler Thromb. 2009; 16:355–362. PMID: 19755788.
crossref
17. Liu CF, Zhou WN, Fang NY. Gamma-glutamyltransferase levels and risk of metabolic syndrome: a meta-analysis of prospective cohort studies. Int J Clin Pract. 2012; 66:692–698. PMID: 22698421.
crossref
18. Ryu S, Chang Y, Woo HY, Yoo SH, Choi NK, Lee WY, et al. Longitudinal increase in gamma-glutamyltransferase within the reference interval predicts metabolic syndrome in middle-aged Korean men. Metabolism. 2010; 59:683–689. PMID: 19922966.
19. Janssen I, Katzmarzyk PT, Ross R. Waist circumference and not body mass index explains obesity-related health risk. Am J Clin Nutr. 2004; 79:379–384. PMID: 14985210.
crossref
20. Bener A, Yousafzai MT, Darwish S, Al-Hamaq AO, Nasralla EA, Abdul-Ghani M. Obesity index that better predict metabolic syndrome: body mass index, waist circumference, waist hip ratio, or waist height ratio. J Obes. 2013; 2013:269038. PMID: 24000310.
crossref
21. Wei M, Gaskill SP, Haffner SM, Stern MP. Waist circumference as the best predictor of noninsulin dependent diabetes mellitus (NIDDM) compared to body mass index, waist/hip ratio and other anthropometric measurements in Mexican Americans--a 7-year prospective study. Obes Res. 1997; 5:16–23. PMID: 9061711.
crossref
22. Matthews DR, Hosker JP, Rudenski AS, Naylor BA, Treacher DF, Turner RC. Homeostasis model assessment: insulin resistance and beta-cell function from fasting plasma glucose and insulin concentrations in man. Diabetologia. 1985; 28:412–419. PMID: 3899825.
23. Alberti KG, Eckel RH, Grundy SM, Zimmet PZ, Cleeman JI, Donato KA, et al. Harmonizing the metabolic syndrome: a joint interim statement of the International Diabetes Federation Task Force on Epidemiology and Prevention; National Heart, Lung, and Blood Institute; American Heart Association; World Heart Federation; International Atherosclerosis Society; and International Association for the Study of Obesity. Circulation. 2009; 120:1640–1645. PMID: 19805654.
24. Lee SY, Park HS, Kim DJ, Han JH, Kim SM, Cho GJ, et al. Appropriate waist circumference cutoff points for central obesity in Korean adults. Diabetes Res Clin Pract. 2007; 75:72–80. PMID: 16735075.
crossref
25. Suh BS. The association between serum gamma-glutamyltransferase within normal levels and metabolic syndrome in office workers: a 4-year follow-up Study. Korean J Fam Med. 2012; 33:51–58. PMID: 22745888.
crossref
26. Kugelman A, Choy HA, Liu R, Shi MM, Gozal E, Forman HJ. gamma-Glutamyl transpeptidase is increased by oxidative stress in rat alveolar L2 epithelial cells. Am J Respir Cell Mol Biol. 1994; 11:586–592. PMID: 7946387.
crossref
27. Nakanishi N, Suzuki K, Tatara K. Serum gamma-glutamyltransferase and risk of metabolic syndrome and type 2 diabetes in middle-aged Japanese men. Diabetes Care. 2004; 27:1427–1432. PMID: 15161799.
28. Furukawa S, Fujita T, Shimabukuro M, Iwaki M, Yamada Y, Nakajima Y, et al. Increased oxidative stress in obesity and its impact on metabolic syndrome. J Clin Invest. 2004; 114:1752–1761. PMID: 15599400.
crossref
29. Ceriello A, Motz E. Is oxidative stress the pathogenic mechanism underlying insulin resistance, diabetes, and cardiovascular disease? The common soil hypothesis revisited. Arterioscler Thromb Vasc Biol. 2004; 24:816–823. PMID: 14976002.
crossref
30. Marchesini G, Brizi M, Bianchi G, Tomassetti S, Bugianesi E, Lenzi M, et al. Nonalcoholic fatty liver disease: a feature of the metabolic syndrome. Diabetes. 2001; 50:1844–1850. PMID: 11473047.
31. Chitturi S, Abeygunasekera S, Farrell GC, Holmes-Walker J, Hui JM, Fung C, et al. NASH and insulin resistance: Insulin hypersecretion and specific association with the insulin resistance syndrome. Hepatology. 2002; 35:373–379. PMID: 11826411.
crossref
32. Ridker PM, Wilson PW, Grundy SM. Should C-reactive protein be added to metabolic syndrome and to assessment of global cardiovascular risk? Circulation. 2004; 109:2818–2825. PMID: 15197153.
crossref
33. Kerner A, Avizohar O, Sella R, Bartha P, Zinder O, Markiewicz W, et al. Association between elevated liver enzymes and C-reactive protein: possible hepatic contribution to systemic inflammation in the metabolic syndrome. Arterioscler Thromb Vasc Biol. 2005; 25:193–197. PMID: 15499043.
34. Lim S, Shin H, Song JH, Kwak SH, Kang SM, Yoon JW, et al. Increasing prevalence of metabolic syndrome in Korea: the Korean National Health and Nutrition Examination Survey for 1998-2007. Diabetes Care. 2011; 34:1323–1328. PMID: 21505206.
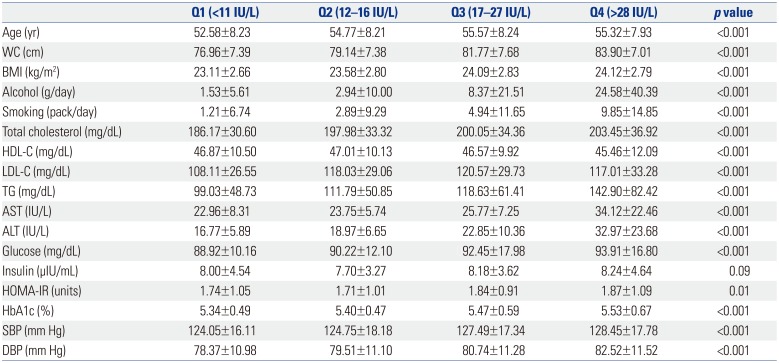
Fig. 1

Description of the study population. KoGES-ARIRANG, Korean Genome and Epidemiology Study on Atherosclerosis Risk of Rural Areas in the Korean General Population.

ymj-58-763-g001
Fig. 2

Incidence of each component of metabolic syndrome and metabolic syndrome per se by GGT quartile. GGT, γ-glutamyltransferase; BP, blood pressure; HDL, high density lipoprotein.

ymj-58-763-g002
Table 1

Baseline Characteristics of Participant by GGT Quartiles

ymj-58-763-i001
Q1 (<11 IU/L) Q2 (12–16 IU/L) Q3 (17–27 IU/L) Q4 (>28 IU/L) p value
Age (yr) 52.58±8.23 54.77±8.21 55.57±8.24 55.32±7.93 <0.001
WC (cm) 76.96±7.39 79.14±7.38 81.77±7.68 83.90±7.01 <0.001
BMI (kg/m2) 23.11±2.66 23.58±2.80 24.09±2.83 24.12±2.79 <0.001
Alcohol (g/day) 1.53±5.61 2.94±10.00 8.37±21.51 24.58±40.39 <0.001
Smoking (pack/day) 1.21±6.74 2.89±9.29 4.94±11.65 9.85±14.85 <0.001
Total cholesterol (mg/dL) 186.17±30.60 197.98±33.32 200.05±34.36 203.45±36.92 <0.001
HDL-C (mg/dL) 46.87±10.50 47.01±10.13 46.57±9.92 45.46±12.09 <0.001
LDL-C (mg/dL) 108.11±26.55 118.03±29.06 120.57±29.73 117.01±33.28 <0.001
TG (mg/dL) 99.03±48.73 111.79±50.85 118.63±61.41 142.90±82.42 <0.001
AST (IU/L) 22.96±8.31 23.75±5.74 25.77±7.25 34.12±22.46 <0.001
ALT (IU/L) 16.77±5.89 18.97±6.65 22.85±10.36 32.97±23.68 <0.001
Glucose (mg/dL) 88.92±10.16 90.22±12.10 092.45±17.98 93.91±16.80 <0.001
Insulin (µIU/mL) 8.00±4.54 7.70±3.27 8.18±3.62 8.24±4.64 0.09
HOMA-IR (units) 1.74±1.05 1.71±1.01 1.84±0.91 1.87±1.09 0.01
HbA1c (%) 5.34±0.49 5.40±0.47 5.47±0.59 5.53±0.67 <0.001
SBP (mm Hg) 124.05±16.11 124.75±18.18 127.49±17.34 128.45±17.78 <0.001
DBP (mm Hg) 78.37±10.98 79.51±11.10 80.74±11.28 82.52±11.52 <0.001

WC, waist circumference; BMI, body mass index; HDL-C, high density lipoprotein cholesterol; LDL-C, low density lipoprotein cholesterol; TG, triglyceride; AST, aspartate transaminase; ALT, alanine transaminase; HOMA-IR, homeostasis assessment method for insulin resistance; HbA1c, glycated hemoglobin; SBP, systolic blood pressure; DBP, diastolic blood pressure; GGT, γ-glutamyltransferase.

Data are expressed as mean±standard deviation.

Table 2

Association between Incident Metabolic Syndrome and GGT at Baseline

ymj-58-763-i002
GGT at baseline
Q1 (<11 IU/L) Q2 (12–16 IU/L) Q3 (17–27 IU/L) Q4 (>28 IU/L)
Number of Incident MetS (%) 95 (13.74) 114 (20.03) 163 (25.23) 186 (27.56)
 Model I 1.00 1.59 (1.17–2.16) 2.69 (2.02–3.58) 2.98 (2.18–4.05)
 Model II 1.00 1.59 (1.17–2.15) 2.71 (2.03–3.62) 2.94 (2.14–4.03)
 Model III 1.00 1.38 (1.01–1.90) 2.01 (1.42–2.82) 2.07 (1.52–2.80)

GGT, γ-glutamyltransferase.

Data are represented in odds ratio (95% confidence interval) or n (%). Model I: adjusted for age+sex, Model II: Model I+smoking, alcohol, and exercise, Model III: Model II+total cholesterol and body mass index.

Table 3

Association between Incident Metabolic Syndrome and Change in GGT Over 2.6 Years

ymj-58-763-i003
GGT change quartiles during 2.6 years
Q1 (<−5 IU/L) Q2 (−4– −1 IU/L) Q3 (0–3 IU/L) Q4 (>4 IU/L)
Model I 1.00 1.01 (0.75–1.32) 1.37 (1.05–1.78) 1.68 (1.28–2.19)
Model II 1.00 1.01 (0.76–1.33) 1.35 (1.03–1.77) 1.66 (1.27–2.17)
Model III 1.00 0.95 (0.71–1.28) 1.43 (1.08–1.90) 1.75 (1.32–2.33)

GGT, γ-glutamyltransferase.

Data are represented in odds ratio (95% confidence interval). Model I: adjusted for age+sex, Model II: Model I+smoking, alcohol, and exercise, Model III: Model II+total cholesterol and body mass index.

Table 4

Adjusted Odds Ratio for Incident Metabolic Syndrome by Change in GGT Over 2.6 Years and GGT at Baseline

ymj-58-763-i004
GGT change quartiles during 2.6 years
Q1 (<−5 IU/L) Q2 (−4– −1 IU/L) Q3 (0–3 IU/L) Q4 (>4 IU/L)
Baseline GGT <median
 Model I 1.00 0.87 (0.55–1.35) 1.22 (0.82–1.80) 1.99 (1.33–2.96)
 Model II 1.00 0.86 (0.55–1.36) 1.20 (0.81–1.77) 1.97 (1.32–2.95)
 Model III 1.00 0.88 (0.55–1.40) 1.24 (0.82–1.87) 1.52 (1.01–2.31)
Baseline GGT >median
 Model I 1.35 (0.89–2.07) 1.81 (1.23–2.64) 2.94 (1.99–4.33) 3.41 (2.34–4.97)
 Model II 1.33 (0.86–2.03) 1.79 (1.22–2.63) 2.88 (1.95–4.27) 3.37 (2.30–4.94)
 Model III 1.37 (0.91–2.05) 1.44 (0.92–2.25) 2.38 (1.57–3.59) 2.75 (1.84–4.10)

GGT, γ-glutamyltransferase.

Data are represented in odds ratio (95% confidence interval). Model I: adjusted for age+sex, Model II: Model I+smoking, alcohol, and exercise, Model III: Model II+total cholesterol and body mass index.

TOOLS
Similar articles