

 PDF
PDF ePub
ePub Citation
 Print
Print


INTRODUCTION
The neuroprotective and neuroregenerative effects of mesenchymal stem cells (MSCs) have been demonstrated by cumulative experiments using rat models of spinal cord injury (SCI) (12). Prior to clinical application of stem cell therapy for SCI, substantial topics such as understanding the fate of transplanted MSCs and the ideal route of transplantation must be clarified. Transplanted MSCs differentiate into neuronal or glial cells for the neuroprotection and neuroregeneration of injured spinal cord. However, only a small number of infused MSCs engraft into injured tissues, also quickly disappeared (3). The paracrine mechanism after MSC transplantation was verified to change the microenvironment in SCI lesions for inducing neuroprotection (34). It is not enough that current data support the neuroprotective effect initiated by transplanted MSCs themselves through cell replacement.
The present authors hypothesized that the method of MSC transplantation can affect the fate of transplanted MSCs. There have been only a few studies investigating optimal method of MSC transplantation. In the present study, biomaterial "scaffold" was selected as a carrier of MSCs and compared to the direct MSCs injection into the injured spinal cord. Poly-lactic-co-glycolic acid (PLGA) and chitosan scaffolds were used because of their excellent biocompatibility (5). We performed an in vivo comparative study between injection- and scaffold based MSC transplantation methods using a rat model of acute SCI. Engraftment and differentiation of transplanted MSCs, and expressions of neuroprotective cytokines were investigated. Functional improvement of rat hindlimbs was also investigated for a clinical assessment. We tried to demonstrate the experimental evidence for selecting more efficient method of MSC transplantation in acute SCI, in an effort to facilitate neuroprotection at the injured cord lesion.
MATERIALS AND METHODS
Contusive SCI model
Adult male Sprague-Dawley (SD) rats (body weight 282-322 g) were used. Each of the 48 rats was anesthetized with ketamine (50 mg/kg) and rompun (2 mg/kg) via intraperitoneal injection. Briefly, their backs were shaved and sterilized with antiseptic betadine. Preoperatively, 5 mg gentamicin was administrated via intramuscular injection. Rat spinal cords were exposed by laminectomy at T9 after exposure of the paravertebral muscles from T8-10. All of the spinal contusions were induced by a 25 g-cm contusion using the MASCIS (Multicenter Animal Spinal Cord Injury Study) impactor (a rod weighing 10 g and dropped from a height of 2.5 cm) at the T9 level. Postoperatively, 5 mg ketoprofen was administered via intramuscular injection for 3 days, and manual emptying of the bladder was performed twice a day for 1 week. Immunosuppressive agents were not used in any of the subjects. For further details, see the previously described procedures (6).
Group allocation and postoperative care
Rats were randomly assigned to one of the following four groups: 1) IL group (n = 12, SCI + intralesional injection for MSC transplantation), 2) IP group (n = 12, SCI + delivery of MSCs via a PLGA scaffold), 3) IC group (n = 12, SCI + delivery of MSCs via a chitosan scaffold), 4) Control group (n = 12, SCI only). A total of 48 rats were used: four rats for histological evaluation and eight rats for biochemical analysis in each group. Animals were kept under standardized conditions (two rats/cage, 20-24°C, 45%-65% relative humidity, and 12-hour daylight) and were provided with food and water ad lib throughout the study. All surgical procedures, including pre- and post-surgical animal care, were carried out in accordance with the Laboratory Animal Welfare Act, and the Guidelines and Policies for Rodent Survival Surgery, as stipulated by the Animal Studies Committee of our institute (IACUC approval No. 2012-0034-01).
Isolation, culture, and characterization of MSCs
Bone marrow was obtained from the femoral bones of rats. Femoral bones were harvested, and both ends were cut. Bone marrow was aspirated with an 18-gauge needle and then diluted to 45 mL with Dulbecco's Modified Eagle's Medium (DMEM) (Sigma-Aldrich, Milwaukee, WI, USA) supplemented with 10% heat-inactivated fetal bovine serum (FBS) (GibcoBRL, Grand Island, NY, USA), 2 mM L-glutamate (Sigma-Aldrich), 100 U/mL penicillin and, 0.1 mg/mL streptomycin (Sigma-Aldrich). Bone marrow aspirates were plated, and then incubated in a humidified atmosphere of 5% CO2 at 37ºC. For selection of MSCs, non-adherent cells were eliminated by replacing the medium 48 hours after cell seeding. For each passage, cells were plated at density of about 8,000 cells/cm2 and were grown to confluence; this was followed by flow cytometric analysis of the cultured MSCs. In brief, cells were detached with 0.05% trypsin-EDTA solution (Sigma-Aldrich) for 3 minutes, and washed twice with PBS containing 0.1% bovine serum albumin. For direct assays, aliquots of cells at a concentration of 1 × 10⁶ cells/mL were immunolabeled at room temperature for 30 minutes with the following antibodies: Fluorescein isothiocyanate (FITC)-conjugated CD 29, 45 and 90. MSCs are known to have a CD 29+ and CD 90+ immunophenotype, but lack the CD 45+ hematopoietic immunophenotype. All of the monoclonal antibodies were purchased from Pharmingen/Becton Dickinson (Flanklin Lakes, NJ, USA). As an isotype-matched control, mouse immunoglobulin G1-FITC or mouse immunoglobulin G1-PE was used. Labeled cells were analyzed using a FACSCalibur flow cytometer (Becton Dickinson) with the use of CellQuest software.
Impregnation of MSCs onto scaffolds and cell transplantation
MSCs were labeled with PKH 26 (Red Fluorescent Cell Linker Kit, 10-3 M, Sigma, St. Louis, MO, USA) before transplantation. PKH26 is a fluorescent labeling membrane dye and has been widely used in in vivo cell tracking and cell proliferation studies.
PLGA is a copolymer that is approved by the U.S. Food and Drug Administration (FDA) for human therapeutic use, owing to its biodegradability and biocompatibility. For the IP group, MSCs were seeded at a concentration of 1 × 10⁶ cells in 10 uL onto a 3 × 3 mm PLGA film, which was fitted into the wells of a 24-well plate, and cultured for 4 days before transplantation. Chitosan also has many desirable physicochemical and biological characteristics, and is a linear polysaccharide composed of a α-1,4-linked N-acetyl-D-glucosamine. For the IC group, MSCs were seeded onto a 3 mm length-chitosan fiber in the same manner as the PLGA samples. PLGA (molecular weight: 50 kDa) and chitosan (molecular weight: 300 kDa) were purchased from Meta Biomed Co. Ltd. (Cheongwon, Korea) and KittoLife Co. Ltd. (Pyeongtaek, Korea), respectively. Cells were cultured with growth medium, which was changed every two days.
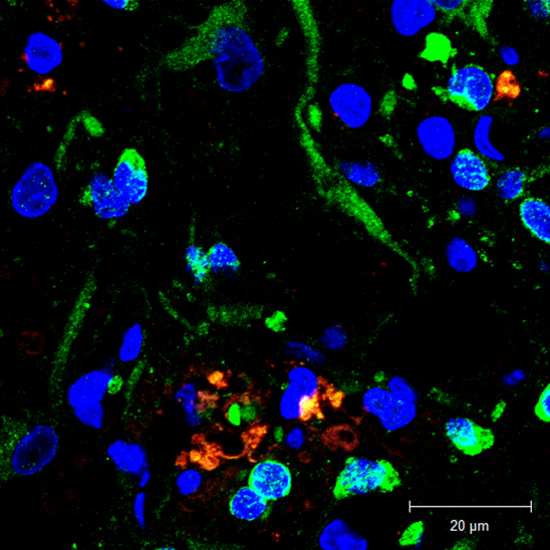
Prior to transplantation, impregnations of MSCs into scaffold were confirmed by using scanning electron microscopy (SEM) (JSM-5410LV, JEOL Ltd., Tokyo, Japan). Cultured MSCs were thoroughly impregnated, either onto a PLGA film, or a chitosan fiber (Fig. 1). In the scaffold group, the MSC-loaded scaffolds (3 × 3 mm-thin PLGA film or 3 mm length-slim chitosan fiber) were applied on to the dorsal surface of the injured spinal cord right after contusive injury. Since contusive injury had made sufficient damage of the spinal cord, any additional durotomy was not necessary. In addition, a toothless surgical micro-forceps was used to carry and put the MSCs-loaded film (PLGA)/fiber (chitosan) carefully on the injured cord lesion for minimizing damage to MSCs-loaded scaffolds and injured cord as well. For the IL group, straight after the contusive injury, and a concentration of 1 × 10⁶ cells in 10 μL was directly injected, using a Hamilton needle (26-gauge). Uniform administration was performed carefully at both the caudal and rostral portions of the injured site.
 | Fig. 1Mesenchymal stem cells (MSCs) were confirmed by scanning electron microscopy before transplantation. Cultured MSCs were seeded onto (A) a PLGA film (IP group), and (B) a chitosan fiber (IC group). The impregnated MSCs on the scaffolds were confirmed by immunofluorescence (IF) staining, which were shown to be PKH 26-positive (× 200).
|
Immunofluorescence (IF) staining for identifying MSCs
Four rats in each group were assigned to immunohistochemical staining for evaluation of engraftment, differentiation, and proliferation of the transplanted cells. At 6 weeks post-transplantation, the injured spinal cord was obtained from euthanized rats. The 1.5 cm spinal cord blocks were obtained from each of sacrificed rats. Then the tissue blocks were cut to 5 µm thickness and three nonconsecutive sections including the epicenter were used for every analysis in each subject. To identify the differentiated cell type of the transplanted MSCs, double immunofluorescence (IF) staining was performed using primary antibodies, namely: GFAP (1:50, Chemicon, Temecula, USA) for astrocytes, CC-1 (1:50, Chemicon) for oligodendrocytes, and NeuN (1:100, Chemicon) for neurons, according to the previously described procedures (7). Cells that were positive for these markers (green) were co-stained with PKH 26 and DAPI (4',6-Diamidino-2-Phenylindole; blue, Invitrogen, Eugene, OR, USA), and were counted using a confocal microscope. For quantitative analysis of the engraftment of transplanted MSCs according to each transplantation route, cells expressing co-staining of PKH 26 and DAPI were counted in six fields under high-power magnification (× 400).
Neurotrophic growth factor analysis
The production of growth factors by transplanted MSCs is believed to perform a neuroprotective function after SCI. To evaluate the expression of brain-derived neurotrophic factor (BDNF) and neuronal growth factor (NGF) at the injured spinal cord, real-time RT-PCR and Western blot analysis were performed at 6 weeks post-transplantation. Spinal tissue blocks (approximately 1.5 cm length) were removed encompassing the epicenter, and stored at -80°C. RNA (ribonucleic acid) was extracted using RNeasy® mini kits (Qiagen, Seoul, Korea), and total RNA samples of 50 ng/µL and BDNF, NGF primers were added to Master Mix one step SYBR® Primescript™ RT-PCR kit II (Takara Biotechnology, Mountain View, CA, USA) and subjected to quantitative RT-PCR amplification in a Real Time PCR system CFX-96 machine (Bio-Rad, Carlsbad, CA, USA). RT-PCR conditions were as follows: pre-incubation: 95°C for 10 seconds and 42°C for 5 minutes, 95°C for 10 seconds; amplification: repeated 40 cycles at 95°C for 15 seconds, 57°C for 1 minute, and 72°C for 10 seconds; melting: 95°C for 5 seconds, 60°C for 1 minute on an applied CFX-96 machine (Bio-Rad). The primer sequences for RT-PCR were: BDNF, 5'- CCC ATG GGT TAC ACG AAG GA-3' (forward), 5'-CCC GAA CAT ACG ATT GGG TAG T-3' (reverse), 88bp; NGF, 5'- AGC GTA ATG TCC ATG TTG TTC TAC-3' (forward), 5'-TGC TAT CTG TGT ACG GTT CTG C-3' (reverse), 79 bp; GAPDH, 5'-GAC AAC TTT GGC ATC GTG GAA-3' (forward), 5'-ATG CAG GGA TGA TGT TCT GG-3' (reverse) 133 bp.
For Western blot analysis, samples were homogenized on ice in RIPA buffer (150 mM NaCl, 50 mM Tris-HCl pH 7.4, 2 mM EDTA, 1% NP-40, 0.1% Triton X-100, 0.1% SDS, 1 mM Na3VO4, 1 mM sodium deoxycholate, 1 mM PMSF, 10 mg/mL aprotinin, and 5 mg/mL leupeptin). Lysates were centrifuged at 16,000 rpm for 10 minutes at 4°C. Proteins were separated by SDS-polyacrylamide gel electrophoresis and were then transferred to a polyvinylidene difluoride membrane (Hybond-P, Amersham Pharmacia Biotech, Buckinghamshire, UK). Membranes were blocked with 5% fat-free dry milk for 1 hour in Tris-buffered saline (0.1% Tween-20, 20 mM Tris-HCl, 137 mM NaCl, pH 7.4) followed by overnight incubation at 4°C with the primary antibodies. The antibodies used for immunoblotting were the following: FITC tagged anti-BDNF antibody (1:500, Santa Cruz, CA, USA), and FITC tagged anti-NGF antibody (1:500; Santa Cruz). Membranes were washed, followed by incubation with secondary peroxidase-conjugated anti-rabbit or anti-mouse antibodies (Amersham Pharmacia Biotech) that were diluted 1:2000 in Tris-buffered saline with 0.01% Tween 20. An antibody detection system (ECL, Amersham Pharmacia Biotech) was used and membranes were exposed to X-ray film. Protein band intensities were quantified with a VDS densitometer (Amersham Pharmacia Biotech).
Functional assessment
The Basso, Beattie, and Bresnahan (BBB) locomotor rating scale (8) was monitored every week for 6 weeks after transplantation. Two researchers at separate times and locations recorded the BBB scores after 2 minutes of observation.
Statistical analysis
All data were expressed as means ± standard deviation. For intergroup comparisons of cell engraftment, differentiation, quantification of neurotrophic factors, and functional recovery, the Mann-Whitney U test was used. For analysis of mean BBB scores at 6 weeks post-transplantation, the Kruskal-Wallis test was used. Values of P that were less than 0.05 were considered to be statistically significant. 0.05 ≤ P < 0.10 was considered to have borderline statistical significances. The statistical software used was SPSS version 18.0 (SPSS Inc. Chicago, IL, USA).
RESULTS
Phenotype expression of the cultured MSCs
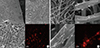
Flow cytometry analysis was performed to confirm immunophenotypes. Cells that were positive for CD 29, and CD 90, and negative for CD 45 were recorded (Fig. 2). Results show that the cultured cells have MSC phenotype, and do not have any specific hematopoietic phenotype.
Engraftment of the transplanted MSCs in the injured spinal cord
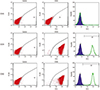
At 6 weeks post-transplantation, the transplanted MSCs were found at the injured cord lesion in each group. In the IL group, PKH 26-positive MSCs were found along the injection tract as a cluster. In the IP and IC groups, most transplanted PKH 26-positive MSCs were found around the cystic glial scar at the dorsal side of the injured spinal cord, and the cells tended to invade the cystic lesion (Fig. 3). Mean numbers of engrafted MSCs (PKH 26-positive) in the IL, IP, and IC groups were 20.62 ± 0.69, 25.63 ± 1.71, and 26.71 ± 1.75 cells/high power filed (HPF), respectively. The number of engrafted MSCs was significantly higher in the IP and IC groups than in the IL group (P = 0.08 for IP vs. IL; P = 0.02 for IC vs. IL). There was no significant difference when comparing the IP group vs. the IC group (P = 0.77).
 | Fig. 3Engraftment of the transplanted cells was investigated. (A) IL group: PKH 26-positive MSCs were found along the injection tract as a cluster. (B) IP group: most transplanted MSCs were found around the glial scar at the dorsal side of the injured spinal cord, and the cells tended to invade the cystic scar. (C) IC group: PKH 26-positive MSCs were also found around the glial scar and the cells tended to invade the cystic scar. In each figure, from the left, H & E stain (× 40); H & E stain (× 400); IF stain merged with PKH 26 and DAPI (× 400). Red arrows indicate transplanted MSCs.
|
Differentiation of the MSCs in the SCI lesions
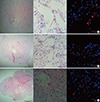
The transplanted MSCs differentiated into different cells according to their delivery routes (Fig. 4). The mean number of engrafted MSCs showing astrocyte differentiation (co-stained cells with GFAP and PKH 26) was 6.71 ± 0.7 in the IP group and 6.83 ± 0.29 in the IC group, which were both lower than the mean of 9.67 ± 0.68 in the IL group (P = 0.02 for IP vs. IL; P = 0.02 for IC vs. IL). The mean number of engrafted MSCs showing oligodendrocyte differentiation (co-stained cells with CC-1 and PKH 26) was 16.5 ± 1.39 in the IP group and 14.9 ± 0.3 in the IC group, which were both higher than the mean of 8.63 ± 0.63 in the IL group (P = 0.02 for IP vs. IL; P = 0.01 for IC vs. IL). The mean number of engrafted MSCs showing neuron differentiation (co-stained cells with NeuN and PKH 26) was 13.37 ± 1.46 in the IP group and 14.53 ± 0.6 in the IC group, which were both higher than the mean of 11.92 ± 1.69 in the IL group, but with no statistical significance observed (P = 0.39 for IP vs. IL; P = 0.22 for IC vs. IL).
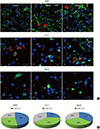 | Fig. 4MSCs showed various differentiated cell types according to their transplantation delivery routes. (A) Co-localized IF staining with PKH 26 (red), DAPI (blue), and cell markers (green) for differentiated cells were counted under high-power magnification (× 1,000); cell markers were GFAP for astrocytes, CC-1 for oligodendrocytes, and NeuN for neurons. (B) Astrocytic differentiation was predominant in the IL group; Oligodendrocytic differentiation was predominant in the scaffold groups; Neuronal differentiation in each group showed similar proportions.
|
The transplanted MSCs mainly differentiated into astrocytes in the IL group, while oligodendrocytes were predominantly detected in the scaffold groups. Although the counted mean number of neurons was smaller in the IL group than in the scaffold groups, the expressed proportion of neurons in each group showed no significant differences (P = 0.77 for IP vs. IL; P = 0.46 for IC vs. IL). In other words, the differentiated proportions of neurons in each group were similar. The ratio of co-localization in each specimen was calculated by [the counted number of co-stained cells with cell markers (astrocyte: GFAP, oligodendrocyte: CC-1, neuron: NeuN) and PKH 26 / the counted number of PKH 26-stained cells]. Table 1 summarizes the engraftment and differentiation of the transplanted MSCs by IF staining at a high power magnification (× 400).
Table 1
Summary of quantitative analysis of engraftment and differentiation of the transplanted cells by immunofluorescence (IF) staining

Each cell numbers were counted at 6 fields in 3 sections obtained from the epicenter under × 400 magnifications.
IL, indicates intralesional transplantation; IP, indicates transplantation of cells on PLGA scaffold; IC, indicates transplantation of cells on chitosan scaffold; MSCs, mesenchymal stem cells.
*Counted cells with PKH 26 positive; †[The numbers of co-stained cells with cell markers (astrocyte: GFAP, oligodendrocyte: CC-1, neuron: Neu N) and PKH 26 / the numbers of PKH 26 stained cells] × 100.
![]()
Real-time RT-PCR for neurotrophic factors
BDNF and NGF gene expression was analyzed by RT-PCR (n = 4, each group). The expression of BDNF messenger ribonucleic acid (mRNA) in the IL group (2.27 ± 0.36), IP group (2.09 ± 0.35), and IC group (1.81 ± 0.24) was significantly higher compared to that of the control group (0.62 ± 0.03) (P = 0.02 for IL versus control; P = 0.03 for IP versus control; P = 0.02 for IC versus control). The expression of NGF mRNA in the IL, IP, IC, and the control group was 1.18 ± 0.2, 1.16 ± 0.12, 1.32 ± 0.06, and 0.76 ± 0.13, respectively (P = 0.13 for IL versus control; P = 0.13 for IP versus control; P = 0.05 for IC versus control). NGF gene expression in the IC group was higher than in the control group, but only with borderline statistical significance (Fig. 5).
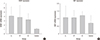 | Fig. 5Expression of brain-derived neurotrophic factor (BDNF) and neuronal growth factor (NGF) genes were analyzed by RT-PCR. (A) BDNF mRNA expression in the transplanted groups was significantly higher than in the control group. (B) NGF mRNA expression in the IC group was numerically higher than in the control group, with borderline statistical significance (mRNA: messenger ribonucleic acid).
|
Western blot analysis for neurotrophic factors
Protein levels of BDNF and NGF were quantified by Western blot analysis (n = 4, each group). Relative optical densities of BDNF in the IL group (1.22 ± 0.15), IP group (1.30 ± 0.1), and IC group (1.27 ± 0.1) were significantly higher than that of the control group (0.61 ± 0.09) (P = 0.02 for IL versus control; P = 0.03 for IP versus control; P = 0.02 for IC versus control). There were no significant differences between the transplanted groups, but numerically higher expression rates of BDNF were shown in both scaffold groups compared to the IL group, albeit by narrow margins. Relative optical densities of NGF in the IL group (4.1 ± 0.64), IP group (4.2 ± 0.63), and IC group (4.17 ± 0.5) were significantly higher than that of the control group (1.43 ± 0.46) (P = 0.02 for IL versus control; P = 0.03 for IP versus control; P = 0.04 for IC versus control). There were no significant differences between the transplanted groups as well, but numerically higher expression rates of NGF were shown in both scaffold groups compared to the IL group, albeit by narrow margins (Fig. 6).
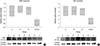 | Fig. 6Neurotrophic growth factors were quantified by Western blot analysis. (A) The relative optical densities of BDNF in the transplanted groups (IL, IP, and IC) were significantly higher than that of the control group. (B) The relative optical densities of NGF in the transplanted groups were significantly higher than that of the control group.
|
Functional recovery of the rat hindlimbs
All of the contusive rats included in the study manifested complete hindlimb paraplegia immediately after the injury. There were no significant differences in the pre-transplantation BBB scores between the four groups; however, at 6 weeks post-transplantation, the mean BBB scores in the IL, IP, IC, and control groups were 7.9 ± 1.1, 7.9 ± 2.1, 8.7 ± 2.1, and 2.9 ± 1.0, respectively. The IC group showed the highest BBB score at 6 weeks post-transplantation. The functional recovery in the transplanted groups was significantly better than that of the control group (P = 0.001) (Fig. 7). There was no significant difference between the IP and IC group (P = 0.62).
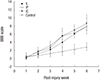 | Fig. 7All rats including the control showed a gradual recovery of hindlimb function for 6 weeks following spinal cord injury. The Basso, Beattie and Bresnahan (BBB) scores of scaffold groups at every week were consistently higher than those of the IL group, throughout the entire 6 weeks. The IC group showed the highest BBB score at the final follow-up.
|
DISCUSSION
Before the stem cell therapy for SCI can be utilized in a clinical setting, several critical issues such as the ideal delivery route for cell transplantation and the fate of transplanted cells must be addressed. A conventional method of intralesional stem cell transplantation is a direct injection into the spinal cord. The injection method creates an inevitable needle injury to the already injured spinal cord. An increasing pressure around the contused spinal cord raises another possible concern. We observed that MSC concentrates tend to leak from the puncture site after injection through preliminary experiments. Kang et al. (6) suggested that intravenous delivery of MSCs can be an easy and safe transplantation route for SCI. However, they highlighted that intravenous delivery also has its limitations, such as cell trapping in other organs and a higher chance of immune reactions. The authors designed current study in order to minimize secondary damage at the injured spinal cord and simultaneously overcome the limitation of intravenous MSC transplantation, by using a scaffold based method. Scaffolds have been established as good mediators of stem cell transplantation for SCI (5). Some investigators designated scaffolds as vehicles of therapeutic agents or MSCs to modulate neuroregeneration after SCI (59). PLGA and chitosan can provide a good framework to bridge the neural gap at SCI lesion (10). The authors used PLGA and chitosan as scaffolds for MSC transplantation as well, and compared their efficacy and safety with the injection method. Although previous studies compared the efficacy of different routes of MSC transplantation, by counting the volume of engrafted MSCs, they did not investigate MSC differentiation or functional improvement (1112).
In the current study, the numbers of engrafted MSCs were higher in scaffold groups than in the IL group. The mean BBB score was highest in the IC group at 6 weeks post-transplantation albeit without statistical significance. Chen et al. (13) suggested that BBB score in the transplanted group was significantly higher than those in the non-transplanted groups. They proposed that the numbers of engrafted MSCs could influence the functional recovery. Our results were consistent with their suggestion. The scaffold based method can be a good delivery route for MSC transplantation with advantage of minimizing secondary damage to the injured spinal cord.
The fate of transplanted MSCs was various according to their delivery routes. Some researchers proposed that astrocytic differentiation can be a default pathway for transplanted MSCs or neural stem cells from the in vivo study (4). Astrocytes have both favorable and deleterious effects on the healing process after SCI (14). In the early stage of SCI, astrocytes isolate and encompass the injured site, possibly to prevent additional damage to the surrounding tissue (1115). In the late phase of SCI, astrocytes also participate in the synthesis of a glial scar that is rich in chondroitin sulfate proteoglycans (CSPGs), which are inhibitory to axonal growth (16). In the current study, astrocytic differentiation was found in smaller proportions in scaffold groups compared to the IL group. The scaffold based transplantation of MSCs is expected to minimize the late detrimental effects of astrocytes in SCI lesions. Parr et al. (17) suggested that preferential oligodendrocytic differentiation of transplanted MSCs lead to the possibility of promoting greater remyelination of the surviving axons, and providing potential neuroprotection in SCI lesions. The scaffold groups showed the oligodendrocytic differentiation predominantly in our study. The scaffold based MSC transplantation is expected to have greater potency of axonal remyelination and neuroprotection than the intralesional injection method.
MSCs have a therapeutic function mediated by neuroprotective growth factors such as anti-apoptotic molecules and anti-inflammatory cytokines. These mediators promote a favorable microenvironment for neuronal regeneration and remyelination. The neuroprotective growth factors, BDNF and NGF were expressed in larger amounts in the transplanted groups (IL, IP, and IC) than in the control group. There were no significant differences between the three transplanted groups, which suggested that the neuroprotective effect of scaffold based transplantation was at least equivalent to that of the conventional injection method. As many studies suggest that the therapeutic effect of stem cell transplantation is attributed to indirect beneficial effects on microenvironment rather than direct effects of differentiated functional cells (318), higher expression of neuroprotective growth factors may be related to the functional improvement in the current study.
There are some limitations of this study. First, besides the determination of transplantation route, optimal timing is one of important factors to be considered. Transplantation in the acute phase of SCI results in a low rate of engraftment because of the severe inflammatory environment. Transplantation right after SCI in this study maybe affected the survival and engraftment of MSCs. Second, although we tried to use the same number of 1 × 10⁶ cells in each of three transplantation groups, actual percentage of engrafted cells could not be estimated due to inevitable loss of cells during the transplantation procedure. In addition, a relative short time for clinical observation (post-transplantation 6 weeks) would be one of the limitations. Six weeks would not be enough time for evaluation of the direct effects of transplanted cells. However, the present study demonstrated that scaffold based MSC transplantation for acute SCI provided more cellular engraftment and considerable clinical outcomes compared to the intralesional injection transplantation of MSC.
In conclusion, scaffold based MSC transplantation may be one of the possible options as the effective and safe transplantation method of stem cell therapy for SCI, though the immunologic reactions and secondary mass effect by scaffold should be addressed.
 XML Download