

 PDF
PDF Citation
 Print
Print


INTRODUCTION
The left internal thoracic artery (LITA) has been used as the first conduit of choice in coronary artery bypass graft surgery (CABG) because of its excellent long-term patency and favorable clinical outcomes.12 The theoretical advantages of using the LITA as a CABG conduit include 1) its wall characteristics as an elastic artery, 2) its comparable size with the native coronary artery, and 3) the anti-atherosclerotic effects of affluent nitric oxide (NO) released from the endothelial layer.345
In addition, a composite grafting strategy based on the in situ LITA enables an-aortic off-pump CABG in which the risk of stroke could be minimized.6 A previous study showed that the patency of the grafts, even that of the internal thoracic artery (ITA), decreased when they were used as an aorto-coronary fashion.7 A recent randomized controlled trial showed that the patency of the saphenous vein (SV) improved and was non-inferior to that of the right ITA when it was used as a composite graft based on the in situ LITA.8 Theoretical advantages using bypass conduits as composite grafts compared to aorto-coronary grafts have been suggested as 1) conduits anastomosed to the side of the LITA are exposed to less circulatory stress than those anastomosed to the ascending aorta and 2) the composite conduits are exposed continuously to endothelial protective substances such as NO released from the LITA.910 However, there has been no study evaluating whether there are substances other than NO that could be beneficial for the bypass conduit, native coronary artery or ischemic myocardium.
Metabolomics is a systemic study detecting and analyzing small molecules which are associated with cellular metabolism, biological phenotypes and dynamic physiological states present in certain specimens at certain time point using two main techniques, mass spectrometry (MS) and nuclear magnetic resonance (NMR). MS is useful instrument for the determination and identification of the exact mass of metabolites with high sensitivity and specificity, while NMR is suitable for the structural elucidation of metabolites.1112 Analyzing of samples using metabolomics approach may lead to discovery of novel biomarkers which can explain the long-term patency of ITA. However, such study was not conducted using metabolomics approach.
Thus, in this study, we aimed to clarify whether there are any differences in metabolic profiles between the LITA and ascending aorta using gas chromatography-time of flight-MS (GC-TOF-MS).
METHODS
Study design
The present study was conducted as a prospective observational study and patients in whom CABG was planned using the LITA through median sternotomy were screened for study eligibility. With an estimated number of patient enrollment as 10 per month based on our institutional clinical volume, the study was designed to enroll patients either until 20 study patients were included or until 3 months of enrollment period was completed to minimize any bias from a prolonged storage period of blood samples. Patient enrollment was started on August 31, 2017 and enrollment of 20 patients was completed on November 15, 2017. During the study period, 24 patients were screened and 4 of these patients were excluded because there was a substantial risk of manipulating the heavily calcified ascending aorta. Mean age of the study patients was 63.8 ± 10.8 years and 14 patients were men (Table 1). Nineteen patients underwent isolated CABG and the other patient underwent combined CABG and aortic valve replacement.
Table 1
Baseline characteristics of the 20 study patients

Sample collection and preparation
Under general anesthesia and hemodynamic monitoring, the LITA was harvested after median sternotomy and intravenous heparin (300 IU/kg) was injected before cutting the distal end of the LITA to maintain an activated clotting time greater than 300 seconds. After pericardiotomy, 2 mL of whole blood was simultaneously drawn from the ascending aorta and the LITA. Aorta sample was drawn by direct puncture using 2 mL syringe with 21 gauge needle, and LITA sample was collected by shedding to opened 2 mL syringe. Both samples were injected to ethylenediaminetetraacetic acid-coated vacutainers (Becton, Dickinson and Company, Franklin Lakes, NJ, USA) through 21 gauge syringe needles. All sample procedures were carefully performed to avoid any hemolysis. Immediately after sampling, plasma was separated by centrifugation at 3,000 rpm for 10 minutes at 4°C and stored in a −72°C liquefied nitrogen (N2) freezer until sample preparation for MS.
Chemicals
Extraction solvents, including high-performance liquid chromatography grade of isopropanol, acetonitrile, and water were purchased from J.T. Baker Chemical Co. (Phillipsburg, NJ, USA). The chemicals used for derivatization including fatty acid methyl ester (FAME) mixtures, pyridine, methoxamine (MeOX) hydrochloride, and N-Methyl-N-(trimethylsilyl)trifluoroacetamide (MSTFA) were purchased from Sigma-Aldrich (St. Louis, MO, USA). Reference standards and internal standards used for identification and semi-quantification of selected markers were also obtained from Sigma-Aldrich.
Untargeted metabolomics
Untargeted metabolomic analysis was performed using a high-resolution mass analyzer GC-TOF-MS (LECO Corporation, St. Joseph, MI, USA). The samples were prepared as described previously.11 Briefly, 50 µL of plasma samples was extracted using 1 mL of degassed extraction solution (acetonitrile:isopropanol:H2O = 3:3:2). For the quality control (QC) samples, 100 µL of each sample was pooled after the first extraction. The extracted samples were evaporated under a N2 evaporator and subjected to a second extraction with 400 µL of extraction solution (acetonitrile:H2O = 1:1). Completely dried samples were then derivatized with 10 µL of methoximation solution (20 mg/mL MeOX hydrochloride in pyridine) at 30°C for 90 minutes in a shaking incubator and cooled at room temperature. The samples were further derivatized with 90 µL of mixture solution (5% FAME in MSTFA) at 70°C for 45 minutes and cooled again. The prepared samples were then transferred into GC injection vials.
For the GC analysis, a 1 µL aliquot of each prepared sample was injected with a front inlet split ratio of 20. The QC samples were injected after every ten samples to ensure the quality of the analysis. The metabolites from the samples were separated through Rtx-5MS columns (Restek Corporation, Bellefonte, PA, USA). The GC oven temperature was increased from 50°C at a rate of 20°C per minutes until the oven temperature reached 350°C to separate the metabolites. The mass spectrometer was set to detect metabolites ranging from 50 to 800 m/z (mass per charge ratio) with an acquisition voltage and a rate of 1,750 and 20 spectra/second, respectively. The transfer line and ion source temperatures were set to 280°C and 250°C, respectively.
Metabolomics data analysis
Metabolomics data analysis was performed using Metaboanalyst 4.0, a web-based software.13 Metabolites with over 50% missing values were excluded in the following analyses. Interquartile range was applied for the data filtering and Pareto scaling was applied as a data pretreatment method for normalization.1415 Statistical analyses, such as principal component analysis (PCA) and the volcano plot,161718 were performed to discover metabolic markers showing significant differences between the ITA and ascending aorta. Briefly, the PCA is an unsupervised multivariate analytical method using an unpaired data set of samples method to visualize subtle similarities or differences among complex datasets.16 The volcano plot is a combination analysis of fold change (FC) and t-test which visualizes the difference between datasets by the Y-axis with log10 (P value) and the X-axis with number of significant pairs which meet the FC cutoff criteria defined below. For the volcano plot analysis, false discovery rate (FDR)-adjusted P values from paired t-tests were used to control FDR in multiple tests.19 For selection of marker candidates the mean initial cutoff values of FC were set to be higher than 1.1 or lower than 0.9 with a significant threshold count percent set to be greater than 60%. The final markers were selected based on cutoff values of the volcano plot with a mean FC > 1.2 or < 0.8 and a significant threshold count percent > 75%.2021
ChromaTOF 4.6 (LECO Corporation) was used to assign the name of markers. Three commercially available libraries, including the NIST/EPA/NIH Mass Spectral Library (Version 2.2), LECO-Fiehn Rtx5 and Wiley (9th edition), were used22 with a cut-off value of 70% to match the minimum similarity of the detected spectrum.
Metabolite set enrichment analysis (MSEA)
Identified metabolites were reviewed through the literature and their main metabolic pathways were determined using the Kyoto Encyclopedia of Genes and Genomes pathway database (http://www.genome.jp/kegg/pathway.html) to select other potential metabolic markers.16
Quantitative analysis
Prior to the marker quantification, confirmation on assigned name of the markers was conducted by comparing mass spectrum with commercially available reference standards. For the quantification, GC-TOF-MS based semi-quantification was performed using the commercially available reference standards of identified metabolites. Dodecanoic acid methyl ester, eicosanoic acid methyl ester, and octadecanoic acid methyl ester from the FAME mixtures were used as the internal standards. The peak area was used for the quantification. For quantification of the hypothetical markers, the concentration was determined using an enzyme-linked immunosorbent assay (ELISA) kit (NOVATEINBIO, Woburn, MA, USA) analyzed through a VersaMaxPLUS microplate reader (Molecular Device, San Jose, CA, USA). The quality of the ELISA was treated as accurate if the quantification of the metabolite was duplicated, including a standard curve, and the coefficient of variation was less than 15% in all samples.
All statistical analyses were conducted using the GraphPad Prism 7.0 software package (GraphPad Software, San Diego, CA, USA). A paired t-test was used for statistical comparison between the concentrations from the ITA and ascending aorta. The P values of less than 0.05 were considered statistically significant in the paired t-test.
RESULTS
GC-TOF-MS based untargeted metabolomics
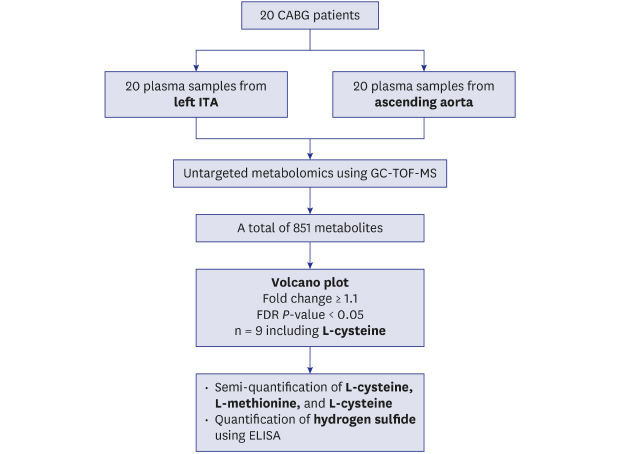
A total of 851 peaks were detected by GC-TOF-MS. Tightly clustered QC samples in the PCA plot showed that GC-TOF-MS analysis was conducted properly. No obvious separation was observed between the ITA and ascending aorta groups in the paired PCA plot (Fig. 1). In volcano plot analysis, a total of nine peaks met the initial criteria (Fig. 2). Among the nine selected peaks, the peak shape and mass spectrum comparison with the commercial library excluded four markers that were considered as derivatization reagents or artifacts. L-cysteine, propanoic acid, cholesterol, picolinic acid and L-glutamine were selected as possible markers (Table 2). In the subsequent volcano plot analysis with the final cut-off criteria, the L-cysteine showed a statistically higher peak intensity in the ITA than the ascending aorta (mean FC = 1.86, P = 0.02) (Fig. 3).
Fig. 1
The PC analysis plot. (A) QC samples were tightly clustered in the principal component plot. (B) There is no obvious separation between the ITA and ascending aorta samples.
PC = principal component; AA = ascending aorta, ITA = internal thoracic artery, QC = quality control.
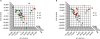
Fig. 2
Results of initial volcano plot analysis. Nine peaks from gas chromatography-time of flight-mass spectrometry results met the initial volcano plot analysis criteria (cut-off values = mean fold change > 1.1 or < 0.9, significant count threshold 60%, false discovery rate-adjusted P value < 0.05).
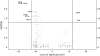
Table 2
Possible markers selected by initial volcano plot analysis based on the cut-offs of mean fold change > 1.1 or < 0.9, significant count threshold 60% and FDR-adjusted P value < 0.05

Fig. 3
Results of GC-TOF-MS based metabolomics data analysis. GC-TOF-MS based metabolomics data analysis showed a significantly higher peak intensity of L-cysteine in the ITA than in the ascending aorta.
AA = ascending aorta, GC-TOF-MS = gas chromatography-time of flight-mass spectrometry, ITA = internal thoracic artery.
aP = 0.02.
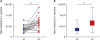
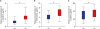
Based on the MSEA, three intermediate metabolites in the ‘cysteine and methionine metabolism pathway' linked with L-cysteine, such as L-methionine, L-homocysteine and L-cystine, were selected for the subsequent analyses. Hydrogen sulfide (H2S), one of the final products, was also selected as one of the hypothetical markers. The GC-TOF-MS based semi-quantification demonstrated that plasma concentrations of L-cysteine, L-methionine, and L-cystine were 2.0-, 1.4- and 1.2-fold higher, respectively, in the ITA than in the ascending aorta (P < 0.001 in each, Table 3 and Fig. 4). L-homocysteine was not detected in the samples. ELISA showed that the plasma concentrations of H2S were significantly higher in the ITA than in the ascending aorta (P = 0.001) (Table 3).
Table 3
The gas chromatography-time of flight-mass spectrometry based semi-quantified concentrations of intermediate metabolites from ‘cysteine and methionine metabolism pathway' and H2S

Fig. 4
Results of semi-quantification analysis of intermediate metabolites. The plasma concentrations of (A) L-cysteine, (B) L-methionine, and (C) L-cystine were 2.0-, 1.4- and 1.2- fold higher, respectively, in the ITA than in the ascending aorta.
AA = ascending aorta, ITA = internal thoracic artery.
aP < 0.001.
DISCUSSION
This study demonstrated 2 main findings. First, there were differences in the plasma metabolome profiles of the 2 common blood sources for CABG, the LITA and the ascending aorta. Second, the plasma concentration of L-cysteine was 2-fold higher in the LITA than in the ascending aorta.
Previous studies demonstrated that patency rates of bypass grafts might be lower when the bypass conduit was used as an aorto-coronary fashion than when it was used as a composite graft based on the LITA.78 Contradictory results also existed that the patency of the radial artery (RA) was lower when it was used as a composite graft based on the LITA compared to aorto-coronary grafts.2324 However, a previous systematic review demonstrated that the best evidence suggests that the site of proximal anastomosis has little or no effect on RA graft patency following CABG.25
One of the theoretical reasons for this difference may be that the composite conduits could be exposed continuously to endothelial protective substances such as NO released from the LITA.9 Another study showed that arterial grafts including the LITA had a protective effect on disease progression of the native coronary artery distal to the anastomosis compared to the SV which was used as an aorto-coronary fashion.26 Therefore, the authors speculated that metabolically active arterial grafts might produce vasoactive and endothelial progenitor substances that defend the native vessels from the progression of atherosclerosis. The present study was conducted to clarify whether there is any difference in metabolome profiles beyond NO that affect the long-term fates of the composite grafts and native coronary vessels with untargeted metabolomics approach using GC-TOF-MS.
In the present study, the concentration of L-cysteine was proven to be higher in the LITA than in the ascending aorta. The semi-quantification of major intermediates correlated with L-cysteine based on MSEA confirmed that the higher peak of L-cysteine in the LITA was not an erroneous finding. In addition, we quantified the plasma concentration of H2S in the ITA and ascending aorta because L-cysteine is capable of interconversion to types of sulfide containing amino acids, and it is the most important donor for biosynthesis of H2S.2728
L-cysteine is a non-essential amino acid and a precursor for protein synthesis and various essential metabolites. Moreover, H2S is regarded as the third endogenous gaseous signaling molecules affecting the cardiovascular system, a so-called “gasotransmitter” following NO and carbon monoxide.272829303132
Previous studies demonstrated the anti-atherosclerotic and antioxidant effects of L-cysteine 33343536; one study showed cardioprotective mechanisms of L-cysteine through an antioxidant effect that directly scavenges reactive free radicals and a mechanism that increases anaerobic energy production in a rat heart model.33 Another study revealed that exogenous L-cysteine in the rat heart model attenuates ischemia-reperfusion injury by stimulating the synthesis of H2S by cystathionine-γ-lyase in the myocardium.34 The protective effects of H2S on the myocardium and vascular endothelium include antioxidative action, suppression of beta-adrenergic function, reduction of apoptosis, preservation of mitochondrial function and high energy phosphate, promotion of angiogenesis, vasodilation and inhibition of atherosclerosis.3031 These favorable effects of L-cysteine and H2S in addition to NO could be the reasons for the high long-term patency rates and cardioprotective effects of the LITA and composite grafting strategies in CABG. Also, with further investigations, these metabolomic approach and results could be applied to pharmacological modulation therapy for post myocardial revascularization patients.
There are several limitations to the current study that must be noted. First, the number of study patients could not be determined based on statistical methods because this study was designed to perform untargeted metabolomics in which no primary end-point could be assumed and to compare the concentrations of metabolites between the two different sites in the same patient. Second, the number of patients enrolled was relatively small. Although all confounding variables could be eliminated by comparing the samples from the same patients, further studies with large numbers of patients using targeted metabolomics might be needed to draw definite conclusions about the metabolome profiles in the LITA and ascending aorta and to validate and confirm findings of the present study. Third, further analyses by including tissue or cells might be needed to clarify the mechanism of the high concentration of L-cysteine in the LITA. Finally, analyses of blood samples from other grafts such as RA, gastroepiploic artery and SV were not performed because the aim of the present study was to compare metabolomics profiles of bloods from 2 arteries that are used as blood flow sources in CABG.
In conclusion, there were distinguishable plasma metabolome profiles between the LITA and the ascending aorta, particularly a significantly higher plasma concentration of L-cysteine in the LITA and a higher concentration of H2S.
 XML Download