

 PDF
PDF ePub
ePub Citation
 Print
Print


INTRODUCTION
Osteoporosis is defined as a systemic skeletal disease characterized by low bone density and the microarchitectural deterioration of bone tissue with a consequent increase in bone fragility [1]. Loss of bone density occurs with advancing age, and the rate of fracture increases markedly with age, giving rise to both morbidity and mortality [2]. Osteoporosis is a very serious disease, especially in menopausal women. Early osteoporosis is often not diagnosed as it remains asymptomatic and does not become clinically evident until fractures occur [12].
Hip fracture has been recognized as the most serious consequence of osteoporosis [3]. In 2010, 21 million men and 137 million women aged ≥ 50 years had a high risk of bone fracture; these numbers are expected to double by 2040, alongside the increase in predominantly Asian subjects [4]. A 2015 World Health Organization (WHO) report noted that musculoskeletal conditions place a heavy burden on individuals and have important health consequences in both developed and developing countries [5].
In the 2009 Korean National Health and Nutrition Examination Survey (KNHANES), 8.1% of men and 38.7% of women aged ≥ 50 years were diagnosed with osteoporosis [6]. In terms of the country-specific prevalence rates of osteoporosis in women aged ≥ 50 years, the rates ranged from 9% (UK) to 15% (France and Germany) based on the total hip bone mineral density (BMD) and from 16% (United States of America (USA)) to 38% (Japan) when spine BMD data were included. In men, the prevalence rates ranged from 1% (UK) to 4% (Japan) based on the total hip BMD and from 3% (Canada) to 8% (France, Germany, Italy, and Spain) when spine BMD data were included [7]. According to these data, the prevalence of osteoporosis in Koreans is considered close to the upper limit for both men and women. BMD in humans is determined by calcium metabolism, and the blood calcium concentration depends on the absorption ratio of calcium in the small intestine, calcium resorption in the kidney, and bone remodeling. The use of calcium plus vitamin D supplements as an intervention could decrease the risk of fractures in middle-aged to older adults [8]. Vitamin D plays an important role in skeletal growth and maintenance by increasing calcium resorption, especially in the renal tubules [9].
Serum 25(OH)D is an indicator of nutritional vitamin D status; if the vitamin D content in the body is insufficient, its serum concentration is significantly lowered and BMD is decreased [10]. A serum 25(OH)D concentration ≥ 20 ng/mL is considered adequate for healthy individuals, according to a committee of the Institute of Medicine of America [11]; a cut-off value of 10 ng/mL is used by the WHO for vitamin D deficiency [2]. However, in Korea, no standard for vitamin D deficiency exists to date.
In the 2009 KNHANES, the percentage of men and women with serum 25(OH)D deficiency was 61.8% and 75.4%, respectively [12]. Vitamin D can be biosynthesized in the human body through ultraviolet irradiation. Serum 25(OH)D concentration, which is the best indicator of vitamin D status, has a significant positive correlation with ultraviolet radiation dose [13]. However, dermatologists warn that ozone depletion can lead to overexposure to ultraviolet B, leading to an increased incidence of skin cancer [14]. People increasingly refrain from exposing themselves to sunlight and use sunscreen [15]; thus, the amount of vitamin D synthesized in the human body is steadily decreasing [16].
Meanwhile, many studies have shown that dietary vitamin D affects blood 25(OH)D levels. The serum vitamin D levels among people living in northern Europe (Norway and Sweden) are higher than those among residents of southern Europe (Spain and Italy) due to a high intake of fatty fish and cod liver oil [17]. The high intake of vitamin D-rich foods among Japanese individuals was associated with high serum 25(OH)D levels during seasons with less sun exposure. In the fall and winter, Japanese individuals typically consume large amounts of fish, cod liver oil, seafood, and eggs, which are sources of vitamin D [18]. These studies suggest that the dietary intake of vitamin D is very important in improving the human vitamin D status. In South Korea, vitamin D was not included in the food composition databases used for the KNHANES; therefore, the vitamin D intake of Korean individuals has not yet been assessed and the relationship between vitamin D intake, BMD, and serum vitamin D concentration is not well studied.
In a precedent study, we reanalyzed the results of the 2009 KNHANES to identify the vitamin D intake level of Korean adults and found a significant positive association between serum 25(OH)D levels and vitamin D intake [12]. Although many studies have reported that high serum vitamin D concentration, calcium intake, and vitamin D supplements are associated with high BMD [1920212223], studies on the relationship between dietary vitamin D intake and BMD are rare. Therefore, the purpose of this study was to investigate the association between dietary vitamin D intake and BMD in Korean adults aged 50 years and older vulnerable to having low BMD.
SUBJECTS AND METHODS
Study participants and measurements
To investigate the relationship between vitamin D intake and BMD in Korean adults over 50 years of age, data from the 2009 KNHANES were used. The 2009 KNHANES was conducted by analyzing data from a blood biochemical survey, a nutrition survey, a health questionnaire, physical measurements, and a BMD survey. Of the 10,533 KNHANES (2009) subjects, 5,065 individuals aged ≥ 50 years were evaluated in this study. Subjects with unknown menopausal status (n = 319), missing data in the food intake survey (n = 902), missing BMD data (n = 301), a vitamin D intake > 60 g/day (n = 48), or missing data on their alcohol consumption, smoking and physical activity status, BMI and anthropometric measurements, serum 25(OH)D concentration, sun exposure, and use of vitamin/mineral supplements (n = 1,687) were excluded from this study. Finally, data on 1,808 subjects (900 men and 908 women) were included in this analysis. In the 2009 KNHANES, blood biochemical test was performed at the Neodyne Medical Research Institute. The levels of serum glucose (mg/dL), serum cholesterol (mg/dL), and alkaline phosphatase (ALP) were measured using a blood auto-analyzer (Hitachi Automatic Analyzer 7600, Hitachi, Japan) with the reagents Pureauto S GLU, SCHO-N, TG-N, and ALP (Sekisui, Japan). Blood insulin (µIU/mL) and serum 25(OH)D (ng/mL) concentrations were measured by immunoradiometric assays with an INS-IRMA kit (Biosource Europe Sa, Nivelles, Belgium), a 25-hydroxyvitamin D 125I RIA kit (DiaSorin Inc., Stillwater, MN, USA), and a gamma-counter (1470 WIZARD; PerkinElmer, Turku, Finland). Daily nutrient intake was assessed for energy, calcium, and vitamin D levels from food intake data that were collected using the 24-hour recall method for one day. The categorical variables used in the health interview were monthly alcohol consumption (yes/no), current smoking status (yes/no), and area of residence. The areas of residence were subclassified into the central region (Seoul, Incheon, Gyeonggi, Gangwon, Chungcheongnambuk, and Daejeon) and southern region (Jeollanam-do, Gyeongsangnam-do, Jeju, Daegu, Gwangju, Busan, and Ulsan). The continuous variables obtained through physical and biochemical examinations were body mass index (BMI), serum glucose (mg/dL), cholesterol (mg/dL), insulin (µIU/mL), ALP (IU/mL), and serum 25(OH)D (ng/mL) levels. The study protocol was approved by the ethical committee of Chungnam National University, Korea (201406-SB-029-01).
Vitamin D database and dietary vitamin D intake
Since KNHANES does not provide a vitamin D database, the vitamin D intake was assessed using the database developed in the previous study [13] with food intake data collected using the 24-hour recall method. Based on the vitamin D database of the nutrient content data book published by the Korean Nutrition Society in 2009, a vitamin D database for 397 foods was newly established. The final vitamin D database consisted of 1,588 foods. The coverage for the number of foods in the newly established vitamin D database was 45.4%. Contents of dietary supplements were not documented in the KNHANES (2009).
BMD
The subjects were divided into the “normal”, “osteopenia”, and “osteoporosis” groups according to their BMDs and were examined for differences according to their baseline characteristics, blood indices, and nutrient intake. BMD was measured at three sites: the femoral total hip, femoral neck, and lumbar spine. The diagnostic criteria for bone health status were as follows: normal (T-score ≥ −1), osteopenia (T-score < −1 and > −2.5), and osteoporosis (T-score ≤ −2.5), as proposed by the WHO Study Group, based on measurement by dual-energy X-ray absorptiometry [2].
Association between serum 25(OH)D concentration and BMD
The association between serum 25(OH)D concentration and whole-body total BMD (WBT-BMD), femoral total hip BMD, femoral neck BMD, and lumbar spine BMD was analyzed collectively in all subjects as well as in men and women separately. The association between serum 25(OH)D concentration and WBT-BMD was investigated in both the serum 25(OH)D-deficient and normal groups. The cut-off point for serum 25(OH)D deficiency in this study was 20 ng/mL (50 nmol/L), according to a study by Dawson-Hughes et al. [24].
Association between BMD and vitamin D intake or calcium intake
To investigate the relationship between vitamin D intake and BMD, we divided the subjects into the vitamin D-deficient group (serum 25(OH)D < 20 ng/mL) and the normal group (serum 25(OH)D ≥ 20 ng/mL) and analyzed the association between vitamin D intake and BMD in each group. We then evaluated the association between vitamin D intake and BMD before and after adjusting for calcium intake as the confounding variable. To investigate the association between vitamin D intake and BMD in groups with similar calcium intake levels, we estimated the difference in the WBT-BMD between subjects with vitamin D intake levels lower and higher than the average intake, after dividing the subjects into quartiles by calcium intake.
Statistical analysis
The analysis of the KNHANES data for weighting was performed by complex samples analysis according to the statistical guidelines of the Korea Centers for Disease Control and Prevention. The general characteristics of the subjects (such as current smoking status, monthly alcohol consumption, and area of residence), anthropometric and biochemical indices, and nutrient intake levels by BMD were compared using complex samples analysis. Calcium and vitamin D intakes were examined by BMD after adjustment for energy intake. Differences in the current smoking status and monthly alcohol consumption as well as area of residence were analyzed using the chi-square test. The means and standard errors (SE) of the anthropometric and biochemical indices and nutrient intake levels were calculated according to the BMD type, and the results were verified using descriptive statistics in the complex samples general linear model (CSGLM). The association between BMD according to skeletal site and serum 25(OH)D concentration were analyzed using a linear regression analysis in the CSGLM, after adjusting for confounding factors. These confounding variables included alcohol consumption, smoking status, age, area of residence, BMI, blood glucose, cholesterol and insulin levels, ALP activity, and calcium intake in all subjects collectively. In men, the confounders adjusted for were BMI, blood glucose and insulin levels, and ALP activity; in women, the corresponding variables were alcohol consumption, age, BMI, ALP activity, and calcium intake. The association between WBT-BMD and serum 25(OH)D concentration in subjects with serum 25(OH)D < 20 ng/mL collectively in all subjects and in men and women separately were analyzed using a linear regression analysis in the CSGLM, after adjusting for age, sex, and calcium intake in all subjects and age and calcium intake in men and women. The association between BMD according to skeletal site and vitamin D intake in vitamin D-deficient or normal subjects, after adjusting for confounding factors (age, sex, and calcium intake in all subjects and age and calcium intake in men and women), was analyzed using CSGLM. As the consumption patterns and energy intakes are different in men and women, the mean and SE of vitamin D intake from the vitamin D-rich food groups in participants according to the BMD were calculated after adjusting for energy intake, age, and sex in all subjects collectively; these were also calculated for men and women separately after adjusting for energy intake and age. The significant differences were analyzed by descriptive statistics and verified by CSGLM. The subjects were divided into quartiles according to their calcium intake. After that, we calculated the difference in WBT-BMD between subjects whose vitamin D intake was above and below the mean intake for each quartile by descriptive statistics and verified these by CSGLM. All statistical analyses were conducted using SPSS version 22.0 (IBM Corp., Armonk, NY, USA). An alpha of 0.05 was used to determine a significant F-value.
RESULTS
Baseline characteristics and nutrient intake by BMD groups
The subjects' general characteristics, biochemical indices, and nutrient intakes by BMD category are shown in Table 1. After adjusting for age and sex, the proportion of monthly alcohol drinkers was significantly lower in the osteoporosis group among all subjects and in the normal group among women (P < 0.001, respectively). Also, the proportion of current smokers was significantly lower in the osteoporosis group among all subjects (P < 0.001). There was no difference in BMD according to area of residence. Among all subjects, the osteoporosis group had a significantly lower BMI (P < 0.001). The fasting blood glucose levels were lower in the osteoporosis group than in the other groups among all subjects and men (P < 0.001). Insulin levels were higher in the osteoporosis group than in the other groups in men (P < 0.001). Among all subjects, the blood cholesterol concentrations were significantly higher in the osteoporosis group (P < 0.01). Among all subjects, serum ALP levels were higher in those with a low BMD (P < 0.001). There was no difference in BMD according to serum 25(OH)D levels. In men, the lower the BMD, the lower the energy intake (P < 0.05). The intake of micronutrients was proportional to the energy intake, and the older the subject, the lower the energy intake. Therefore, we examined the differences in calcium and vitamin D intakes according to BMD after adjusting for energy intake and age in both men and women and for energy intake, age, and sex in all subjects. Among all subjects, the lower the BMD, the lower the calcium intake (total: P < 0.01, men and women: P < 0.05). Vitamin D intake was significantly lower in the osteoporosis group among women (P < 0.05; Table 1).
Serum 25(OH)D concentration and BMD
Table 2 shows the associations between serum 25(OH)D levels and site-specific BMD in among all subjects collectively and among men and women separately. The results were analyzed after adjusting for the factors affecting BMD, as described in the methods. Among all subjects, the higher the serum 25(OH)D concentration, the higher the WBT-BMD, femoral total hip BMD, and femoral neck BMD (P < 0.01). We detected no significant association between serum vitamin D level and BMD in men and women (Table 2).
Next, we divided the subjects into two groups: those with a serum vitamin D concentration ≤ 20 ng/mL (deficient) and those > 20 ng/mL; the association between serum vitamin D concentration and BMD was examined in each group. In the serum vitamin D-deficient group of all subjects and of women, there was a relationship between serum 25(OH)D concentration and WBT-BMD (P < 0.05; Table 3).
Vitamin D intake and BMD
Since the BMD and serum vitamin D levels of the subjects were found to be associated in the group with serum 25(OH)D deficiency (< 20 ng/mL), we examined the association between vitamin D intake and site-specific BMD in those with a serum 25(OH)D concentration < 20 ng/mL. The associations between the variables were analyzed after adjusting for calcium intake, age, and sex in all subjects and calcium intake and age in men and women to avoid the interference of the effects of calcium intake, which is known to have the greatest effect on BMD [18]. There were 979 vitamin D-deficient subjects (407 men and 572 women). Among all subjects collectively and among men and women separately, there was no association between vitamin D intake and BMD before and after adjusting for calcium intake (Table 4).
Vitamin D-rich food groups and BMD
The vitamin D intake from different source food groups was analyzed according to BMD. Among all subjects and in men, the source food group that differed in terms of vitamin D intake according to BMD was milk and dairy products; the osteoporosis group had a significantly lower vitamin D intake from milk and dairy products (total subjects: P < 0.05, men: P < 0.001; (Table 5).
Difference in BMD by vitamin D intake in quartiles of calcium intake
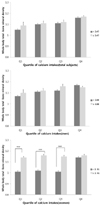
Based on the results of the association between vitamin D intake and BMD after adjustment for calcium intake, we divided the subjects into quartiles according to calcium intake and analyzed the difference in BMD between the group with a higher-than-average daily vitamin D intake and the group with a lower-than-average daily intake in each quartile. No difference in BMD according to the vitamin D intake level in the total population as well as in men were found. In women, however, the BMD of the group with a vitamin D intake above the average intake (2.51 µg/day) was higher than that of the group with a lower intake of vitamin D in the 1st to 3rd quartiles of calcium intake (P < 0.001). There was no difference in BMD according to vitamin D intake in women with a calcium intake higher than 538 mg/day (Fig. 1).
DISCUSSION
This study showed that vitamin D intake was the lowest in women with osteoporosis. In addition, an increase in vitamin D intake was found to be effective in increasing BMD in groups with low calcium intake. Calcium is the most important constituent of the bone and vitamin D promotes the absorption of calcium in the body. However, according to a study on the consumption of nutritional supplements among 946 middle-aged Korean individuals with an average age of 47.7 years, the percentage of people who took calcium supplements was 60%, but only 2.9% of the people took vitamin D supplements [25]. In an investigation on the consumption of supplements for bone health among 360 Korean postmenopausal women with osteoporosis, the intake rate of calcium (30%) was much higher than that of vitamin D (3%) [26], indicating that Koreans' awareness of the importance of vitamin D intake for osteoporosis treatment is relatively poor when compared to their awareness on the importance of calcium intake.
Aging is associated with a reduction in BMD [2]; in our report too, BMD significantly decreased with increasing age. In general, while light to moderate alcohol consumption has been reported to increase BMD, heavy alcohol consumption reduces it [2728]. In this study, the percentage of non-alcohol drinkers was higher among both men and women with osteoporosis. However, since the KNHANES only identified if participants consumed alcohol at the time of the survey, the causal relationship between alcohol consumption and bone health could not be analyzed. The BMI of the participants significantly decreased with a lower BMD; this has been confirmed in several previous studies. DeSimone et al. [29] reported that body weight is an important predictive factor of BMD in both Caucasians and African-Americans as a high body weight leads to a high BMD. Furthermore, based on reports that showed a higher prevalence of sarcopenia in Korean patients with hip fractures [30], BMD and muscle loss are likely associated. Specifically, since there is a trend of decreasing muscle mass and increasing body fat with aging, it may be more beneficial to focus on maintaining or increasing body weight by improving muscle mass or increasing body weight following a reduction in body fat.
In this study, serum glucose and insulin levels according to BMD showed a significant difference only in men and were lower in the osteoporosis group than in the other two groups. However, the levels of serum glucose and insulin in the male osteoporosis group were within the normal ranges of 70–110 mg/dL and 4–16 µIU/mL, respectively. As insulin has an anabolic effect on the bone [31], BMD is high in participants with hyperinsulinemia and low in those with hypoinsulinemia [3233]. Since the adverse effects of hyperinsulinemia on BMD have been reported [34], further investigation is needed to determine the effect of insulin on BMD. In this study, the BMD of the male participants decreased alongside the levels of blood glucose and insulin; the effect of insulin in women was unclear. While the level of ALP, an effective indicator of bone resorption, is known to increase significantly in postmenopausal women [3536], ALP levels significantly increased with a lower BMD in both men and women in this study.
Various studies have reported the optimal concentrations of serum 25(OH)D in the human body. While the Institute of Medicine, USA, states that the optimal concentration of serum 25(OH)D for bone health is a minimum of 50 nmol/L (20 ng/mL) [37], Dawson-Hughes et al. [24] identified that the optimal concentration of serum 25(OH)D for the prevention of bone fractures was a minimum of 30 ng/mL (75 nmol/L). However, Hwang et al. [38], in their study based on the 2009 KNHANES that aimed to determine the optimal level of serum 25(OH)D for bone health in Korean senior citizens, suggested that a concentration of 20 ng/mL is desirable, since parathyroid hormone levels increase when the level of serum 25(OH)D is < 12.1 ng/mL and the femur BMD only increases when the blood serum 25(OH)D level reaches 20.4 ng/mL. While the serum 25(OH)D level measured in 120 Croatian postmenopausal women was 18.78 ± 6.71 ng/mL [35] and comparable to those of Korean women aged ≥ 50 years, the average serum 25(OH)D level in 2,251 postmenopausal women aged 55–69 years in certain regions of China was 23.0 ng/mL (17.1–30.5 ng/mL) [36], which is higher than that in Korean women. As an indicator of vitamin D nutritional status, it is well-known that serum 25(OH)D level is closely associated with BMD [39]. In this study, serum 25(OH)D level was associated with WBT-BMD, femoral total hip BMD, and femoral neck BMD level in all participants; specifically, this association was evident in the group with serum 25(OH)D levels < 20 ng/mL. These findings are consistent with those reported by Sadat-Ali M et al. [19], indicating that an improved nutritional vitamin D status improves bone health, in particular in adults and seniors with vitamin D deficiency.
In the present study, energy and calcium intake had the greatest impact on bone health status, and the energy intake decreased as BMD reduced. Calcium intake also decreased with lower BMD in men; in women, it was markedly reduced in the osteoporosis group. Although the recommended nutrient intake (RNI) of calcium in Korean individuals is 700 mg for men and 800 mg for women, only 12.3%–28.4% of men and 9.9%–19.5% of women were consuming more than the RNI [12]. Furthermore, the average intake of vitamin D was 3.6–4.4 µg/day in men and 2.1–2.6 µg/day in women, which is markedly lower than 10 µg, the adequate intake established by the Korean Nutrition Society. Vitamin D intake was significantly lower in the groups with low BMD, specifically in Korean women aged ≥ 50 years. This finding suggests that vitamin D intake has a direct effect on BMD. A meta-analysis of randomized controlled trials supports the use of calcium and vitamin D supplements as an intervention to reduce the risk of fractures in older adults [823].
Furthermore, when calcium intake levels were divided into quartiles, BMD was higher in the subjects with high vitamin D intakes, specifically in those in the 1st to 3rd quartiles, although this result was only observed in women. In men with similar levels of calcium intake, BMD was not significantly different when subjects were stratified according to vitamin D intake. This can be attributed to the difference in the rate of BMD decline between women and men over 50 years of age. The calcium intake of Koreans tend to be very low, and the highest intake observed in the 3rd quartile was 537.74 mg/day, which is only 67% of the recommended intake for Koreans. These findings indicate that increasing the vitamin D intake in women with a low calcium intake may improve BMD. In calcium-related BMD studies, a daily supplement of 1,000 mg of calcium carbonate plus 400 IU of vitamin D3 [4041], and 1,200 mg of calcium plus 800 IU of vitamin D3 [4243] helped to reduce the risk of fractures. Although it is well-known that vitamin D improves calcium absorption in the intestine and is needed for bone growth and remodeling, the results of a meta-analysis showed no effect from the vitamin D supplement alone. However, the meta-analysis supported the combined use of vitamin D and calcium to reduce the risk of fractures [44].
The most important factor affecting serum 25(OH)D levels is exposure to sunlight; although Korea has high solar irradiation levels, the serum 25(OH)D levels of Korean women are very low due to the extreme avoidance of sunlight. Given that vitamin D intake from food is likely important under these circumstances, we investigated the major food sources of vitamin D in Koreans. We found that the types of foods that served as major sources of vitamin D were highly limited; specifically, the intake of milk and dairy products was low, compared to that in North American and European countries [45]. In the male osteoporosis group, the amount of vitamin D provided by milk and dairy products was not only significantly lower than that in the other two groups but was essentially non-existent, indicating a lack of vitamin D intake from milk and dairy sources. Although the prevalence of osteoporosis in men is known to gradually increase after the age of 70 years, these findings suggest that early-onset osteoporosis can also occur in men with an insufficient intake of milk and dairy products. Lee et al. [46] reported in their preliminary study on Korean individuals that the intake of milk and dairy products in adult men contributed to increasing BMD. However, the most important food source of vitamin D for Koreans is seafood, accounting for over 70% of the total vitamin D intake [12]. In the present study, in women aged ≥ 50 years, the vitamin D food sources that showed a significant difference in intake levels according to bone health status were seafood and mushrooms. Vitamin D intake from mushrooms was significantly lower in the osteoporosis group than in the other two groups. Thus, to improve the nutritional vitamin D status in Korean women, it is necessary to ensure a sufficient intake of dairy products through the consumption of various food types. While mushrooms are widely enjoyed by Koreans and known as a food source of vitamin D, their contribution toward the vitamin D intake in Korean adults is not high and is comparable to that of meat and poultry. However, since mushrooms are categorized as vegetables, have few calories, and are high in dietary fibers and substances that promote immune function compared to the other food sources of vitamin D, they act as a vitamin D source that provides a number of health benefits. Consequently, it is essential to develop measures to increase mushroom consumption. As vitamin D intake through food consumption is limited, various countries have implemented successful policies that promote vitamin D intake in their citizens [2344]. Importantly, since food consumption levels are lower in elderly adults than in other adults, there are limitations pertaining to increasing the vitamin D intake through natural food sources. The 2012 UK Chief Medical Officers Joint Guidelines identified seniors aged > 65 years as nutritionally vulnerable and recommended that they consume vitamin D supplements [47]. The 2010 National Osteoporosis Foundation (NOF) recommended a daily calcium intake of 1,200 mg and a daily vitamin D intake of 800-1,000 IU (20–25 mcg) for adults aged ≥ 50 years [48]. Moreover, the Korean Society of Bone Metabolism and the 2010 North American Menopause Society have implemented the recommendations of the NOF for the prevention and treatment of osteoporosis in postmenopausal women. However, rather than suggesting the consumption of nutritional supplements to meet these recommended standards, priority should be given to raising calcium and vitamin D intakes by encouraging the consumption of natural food sources of vitamin D to improve the status of other nutrients and identifying vitamin D-rich foods and ways to utilize them. In addition, as few studies have focused on the vitamin D intake of Koreans, further investigations on calcium and vitamin D metabolism are required.
The main limitation of the present study is that the actual vitamin D intake of individuals aged ≥ 50 years may have been underestimated due to the failure to consider the amount of vitamin D consumed through supplements. Despite this limitation, we provided important data on the vitamin D intake in Korean adults aged ≥ 50 years and evaluated the relationship between vitamin D intake and BMD; our findings may help improve the vitamin D status and BMD in Koreans.
This is the first study to investigate the relationship between vitamin D intake and BMD using a large-scale survey of Koreans. Although our vitamin D database is not completely established, it covers more than 90% of the vitamin D source foods consumed by Koreans and is sufficient to understand the trend of vitamin D intake of Koreans. The results of this study could be helpful in establishing a health strategy to improve BMD in Korean women over 50 years of age. Nevertheless, such strategies should start at an early age before peak bone mass is reached. Our results also showed that high vitamin D intake may be beneficial to bone health if calcium intake is less than about 550 mg/day. Therefore, elderly women should be encouraged to consume enough vitamin D source foods and a nation-wide vitamin D fortification program should be designed and examined for its efficacy in improving bone health, especially for Korean adults aged 50 years and older, who are vulnerable to having low BMD.


 XML Download