

 PDF
PDF ePub
ePub Citation
 Print
Print


INTRODUCTION
Epilepsy is a disorder of recurrent spontaneous seizures, and the hallmarks of its associated electrophysiological abnormalities are cerebral hyperexcitability and hypersynchrony, which are represented by interictal epileptiform discharges (IEDs) in the routine electroencephalogram (EEG). IEDs play a critical role in the diagnosis of the specific type of epilepsy, and their presence or absence during serial EEGs is an essential laboratory marker for decision-making about treatment withdrawal.1
Benign epilepsy with centrotemporal spikes (BECTS) is a highly typical age-related epilepsy syndrome with excellent seizure and EEG outcomes.2 Its benign course has been explicitly recognized, and the new terminology of self-limited epilepsy with centrotemporal spikes (SLECT) has newly appeared.3 Most SLECT patients exhibit normal waking EEGs except for centrotemporal spikes on waking,4 which means that there is no abnormality to detect in a routine visual analysis of their waking EEG. It is well known that centrotemporal spikes persist longer than their seizures, and usually last until adolescence.5 For cases where anticonvulsants are initiated in BECTS patients, waiting for IEDs to disappear could take longer due to the natural course of BECTS. Additional information such as connectivity in an otherwise normal waking background EEG in BECTS is therefore needed.
Stam et al.6 introduced the phase lag index (PLI) to statistically quantify the phase synchronization of two signals. The PLI performed better than previous methodologies such as the imaginary part of coherence in detecting true changes in phase synchronization. However, the PLI is sensitive to noise and volume conduction. Vinck et al.7 introduced the weighted phase lag index (wPLI) to reduce the influences of common noise sources and changes in the phase of the coherency. Among many association measures used in connectivity analyses of EEG and magnetoencephalogram (MEG) signals, the wPLI is a good candidate parameter for revealing synchronized data.
A few studies have analyzed the resting-state functional connectivity of BECTS using the EEG. However, the results were contradictory in showing decreased8 or increased9 connectivity depending on the different association measures used. We therefore performed the present study to visualize the differences in connectivity and network topology with the aim of clarifying the real situation. The hypothesis tested in this study was that the network itself and its topology differ between BECTS patients and their corresponding disease-free controls. To the best of our knowledge, no previous study has analyzed the EEG resting-state functional connectivity using the wPLI, or addressed the network topology difference in BECTS.
The purpose of this study was to visualize the resting-state functional connectivity of spike-free waking background EEGs of BECTS patients and reveal any abnormalities from the visually normal EEG of BECTS patients at the time of diagnosis and before treatment. The resting-state functional connectivity and network topology measures of BECTS were compared to those of disease-free controls.
Go to : 
METHODS
Patients and controls
Patients with BECTS who visited Seoul National University Bundang Hospital between June 2003 and February 2016 were identified using a clinical data warehouse program. The diagnosis of BECTS was made at the clinic and was reassessed for this research according to the International League Against Epilepsy criteria.10 The inclusion criteria were showing a typical benign and self-limiting course of BECTS,311 and the availability of serial routine (sleep with or without waking) EEGs from onset to remission and sufficient medical information to confirm the typical benign nature of the seizure and EEG outcomes. The exclusion criteria were a short follow-up, loss to follow-up, evidence of atypical progression,1213 availability of sleep EEG recordings only at the diagnosis, or EEG recordings containing excess artifacts that would hinder connectivity analysis.
Since EEGs differ significantly during development in this age group,14 sex- and age-matched controls were recruited from the same institution. Control EEGs were obtained from patients who underwent EEG examinations for evaluations of syncope or seizure-like events. Only patients in a normal neurological condition and who were free of central nervous system disorders such as headaches, developmental delay, and epilepsy were included in the disease-free control group.
EEG examinations
EEGs were recorded using a 32-channel digital EEG system (Grass Telefactor; West Warwick, RI, USA) with electrodes placed according to the international 10–20 system. The sampling rate was 200 Hz. EEGs were recorded without sedation whenever possible, but patients were sedated with chloral hydrate if necessary (50 mg/kg; maximum, 1 g). Only EEGs of sufficient length were analyzed. Medication-naïve EEGs at the diagnosis of BECTS were analyzed to exclude the effect of medication on functional connectivity.
EEG preprocessing and epoch selection
Since the purpose of this study was to identify the difference in functional connectivity relative to the otherwise normal waking EEG of patients, epochs for analysis were selected from spike-free parts of waking EEGs. Moreover, the EEGs were also scanned for possible contamination by artifacts, and so finally spike- and artifact-free epochs were analyzed. Quiet wakefulness was evaluated based on the quality of the posterior rhythm, overall EEG background, and presence of artifacts. All of the EEGs were reformatted to average reference montage to minimize the confounding effects of specific brain activities and to achieve reference cancellation effects.15 Raw EEG files were transformed into European Data Format (EDF) files using a bandpass filter (0.5–70 Hz) and a 60-Hz notch filter. As many 8-second epochs as possible were selected as described above. Data transformation into ASCII files was performed using Brain Electrical Source Analysis (BESA) Research software (version 6.0, BESA, Grafelfing, Germany). The epoch length was set to 1,600 data points (8 seconds at 200 Hz) based on a reference paper and subsequent research that assessed the minimum length of a recording required for wPLI analysis.16
Band separation
For off-line analysis using MATLAB (Natick, MA, USA), the recordings were converted into ASCII files at a sampling rate of 200 Hz. Epochs were bandpass filtered into the following commonly used frequency bands: delta (0.5–4 Hz), theta (4–8 Hz), lower alpha (8–10 Hz), upper alpha (10–13 Hz), and beta (13–30 Hz). All of the subsequent analyses were performed separately for these bands.
Use of wPLI to measure functional connectivity
The wPLI,7 which is an extension of the PLI, was used as a measure of functional connectivity. The PLI is an index of the asymmetry in the distribution of phase differences calculated from the instantaneous phases of two time series. The instantaneous phases were determined using the Hilbert transformation, with a Hann window applied before implementing the concurrent fast Fourier transform. If Δϕ is the phase difference, the PLI is defined as:
where E is a function that computes the mean value, and sgn is a function that extracts the sign of a real number. The wPLI can be derived by weighting each phase difference according to the magnitude of the lag as follows:
This weighting reduces the risk of a true signal being affected by small noise perturbations. Uncorrelated noise sources increase the signal power, but the wPLI is calculated based only on the imaginary component, which increases the robustness against noise.
Construction of network connectivity
We constructed a weighted undirected network by defining 19 EEG electrodes (Fp1, F3, C3, P3, O1, Fp2, F4, C4, P4, O2, F7, T3, T5, F8, T4, T6, Fz, Cz, and Pz) as network nodes and the wPLI values between electrode pairs as edges. A single connectivity network was calculated for each epoch. To improve reliability, we computed the representative connectivity network by averaging the computed single connectivity networks.17
Network metrics
For network analysis, we calculated several metrics for the representative connectivity network for each subject. Global network metrics were calculated using the Brain Connectivity Toolbox in MATLAB.17 The global network metric has a single representative value for each network. The global wPLI was calculated as the average of the weights of all edges, and it represents the overall connectivity in specific frequency bands. The mean clustering coefficient (CC) and the characteristic path length (CPL) were calculated from the network as the global metrics. The CC is a measure of the degree to which nodes in a graph tend to cluster together. The mean CC is calculated by averaging the CC values for all nodes, and a higher mean CC value indicates that the network tends to create tightly knit groups characterized by a relatively high density of connections. The CPL is calculated by averaging the shortest path lengths between all node pairs.
Comparison between patients and controls
The overall frequency and amplitude distributions of the two groups were analyzed using power spectral density (PSD) graphs. The PSD graph was generated for each epoch, and the obtained graphs were averaged for each subject. The PSD graphs of each subject were then averaged for group analysis. The EEG resting-state functional connectivity was compared between the two groups by comparing the wPLI values of all edges. The mean global wPLI values for each frequency band were compared. Network topology measures were compared to identify differences in network characteristics.
Statistical analysis
Statistical analysis was performed using SPSS for Windows (version 22.0, IBM Corp., Armonk, NY, USA). Whether the wPLI, CPL, CC, and global wPLI values conformed to a normal distribution was checked using the Kolmogorov-Smirnov test. Since this was confirmed for all of the variables, a paired t-test was applied to matched pairs with a two-sided alpha threshold of 0.05. The p values were corrected for 30 different frequency bands for the PSD and 5 different frequency bands for network metrics with the Bonferroni method. For comparisons of connectivity itself, the nominal p value was used initially to compare only the paired wPLI values of nodes. To deal with the problems of multiple testing, we adopted the approach for controlling the false discovery rate (FDR) provided in the network-based statistic (NBS) Connectome MATLAB package (version 1.2).18 We applied the FDR approach to each frequency band to reject the null hypothesis at the level of individual connections. We used 19×19 connectivity matrices of each frequency band as inputs for the FDR approach with 50,000 permutations and a significance threshold of 0.05. A one-sided t-test was applied solely due to a limitation of the NBS Connectome software.
Ethical issues
The protocol of this study was reviewed and approved by the Institutional Review Board of the Seoul National University Bundang Hospital (IRB No. B-1705-399/102). The IRB waived the need to obtain informed consent due to the retrospective nature of the review of medical records and EEG data.
Go to :
RESULTS
Among 132 patients who were diagnosed with BECTS, 30 patients (17 males and 13 females) with sufficient information and follow-up duration were included in the analysis. The reasons for exclusion were loss to follow-up (12 patients), short follow-up (63 patients), initial raw EEG data loss due to data storage problems (12 patients), and EEG quality insufficient for connectivity analysis (15 patients). The mean age at onset was 8.5 years (range, 5.5–11.0 years) and the mean age at EEG recording was 8.7 years (range, 5.5–12.1 years). The mean follow-up duration of the patients was 5.0 years after onset (range, 3.5–9.0 years). Thirty disease-free control children were 1:1 matched for age at the time of EEG recording and sex for paired analyses. The mean age of these controls at EEG recording was 8.8 years (range, 5.8–12.4 years). The mean numbers of epochs analyzed were 28.3 (range, 12–67) and 43.5 (range, 12–154) for the patients and controls, respectively.
The PSD graphs of absolute and relative powers did not differ significantly between the patient and control groups. Both the absolute (Fig. 1A) and relative (Fig. 1B) powers peaked in the lower alpha band for both groups.
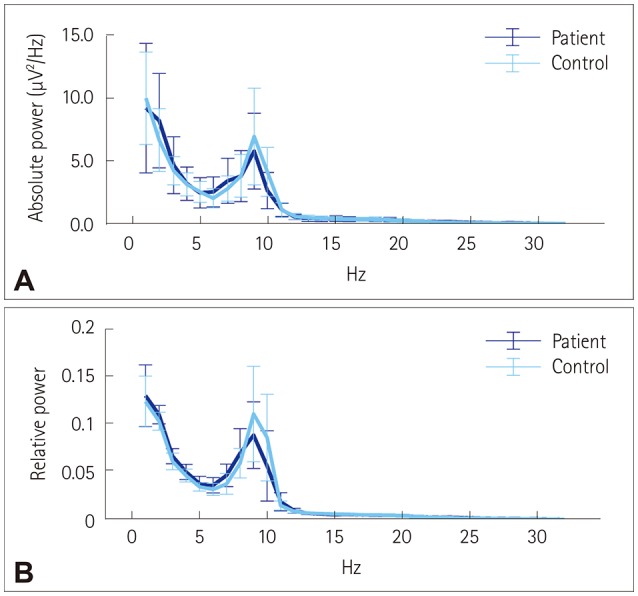 | Fig. 1Power spectral density graphs. Absolute (A) and relative (B) PSD graphs for the benign epilepsy with centrotemporal spikes and control groups, with bars showing median and median absolute deviation values. The results were similar for the PSD, and activity peaked in the lower alpha band. PSD: power spectral density.
|
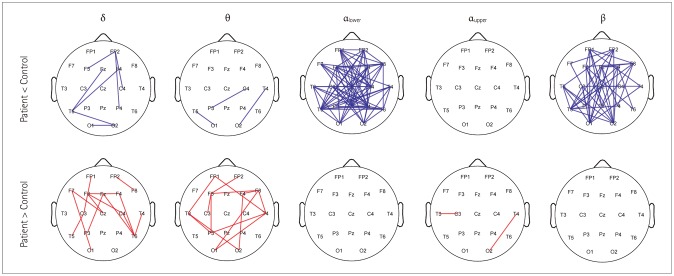
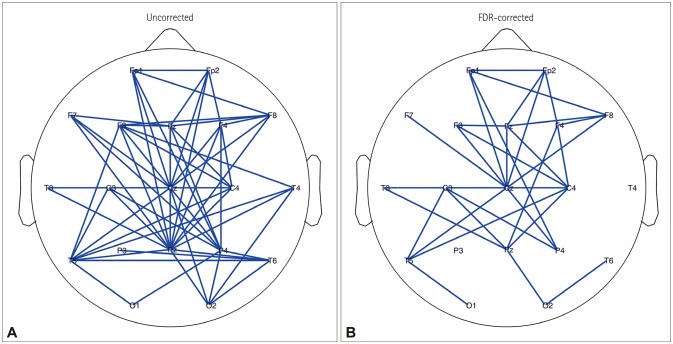
Association matrices constructed using the wPLI showed band-specific differences (Fig. 2A). Comparing only the difference at a specific edge of a certain band (without correction) revealed significant differences for increased or decreased connectivity in the delta and theta bands. However, wPLI values that were different were consistently lower for the lower-alpha-band and beta-band connectivity, and they were increased for the upper alpha band (Figs. 2B and 3). We found 32 significant connections based on the FDR-corrected p values only in the matrix of the lower alpha band with the null hypothesis that the connectivity is increased in controls compared with patients. There was no significant connection in the matrices of the delta, theta, upper alpha, and beta bands. No significant connection was found in the matrices of all frequency bands with the null hypothesis that the connectivity is increased in patients compared with controls (Fig. 4).
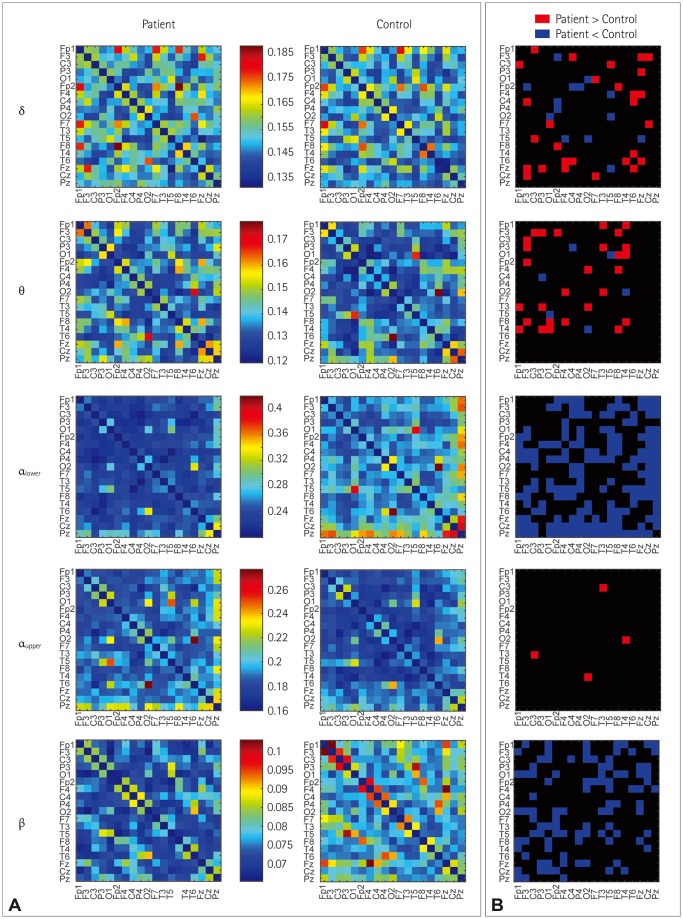 | Fig. 2A heat map of an adjacent matrix plot of band-specific resting-state functional connectivity (A) and differences of the edges (B). The heat map shows the connectivity in the delta, theta, lower alpha, upper alpha, and beta bands with different color scales for each band. The p values were not corrected for each frequency band or the 171 edges. Only a certain band and an edge were compared between benign epilepsy with centrotemporal spikes patients and controls to produce the connectivity difference pattern.
|
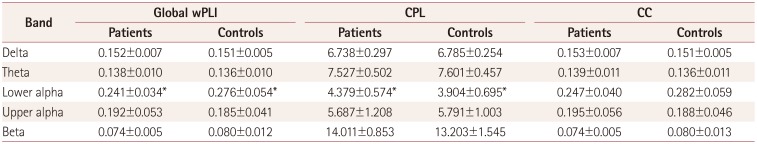
The averaged wPLI values were significantly lower in the lower alpha band for BECTS (Fig. 5 and Table 1). The global network topology measures of CPL and mean CC were analyzed for each of the five frequency bands. The CPL in the lower alpha band was significantly longer in patients, which indicates that the global integration of resting-state functional connectivity is reduced in BECTS compared to in disease-free controls. In other words, the resting-state connectivity in BECTS patients is less efficient than that in healthy controls. However, the CC did not differ significantly between the two groups.
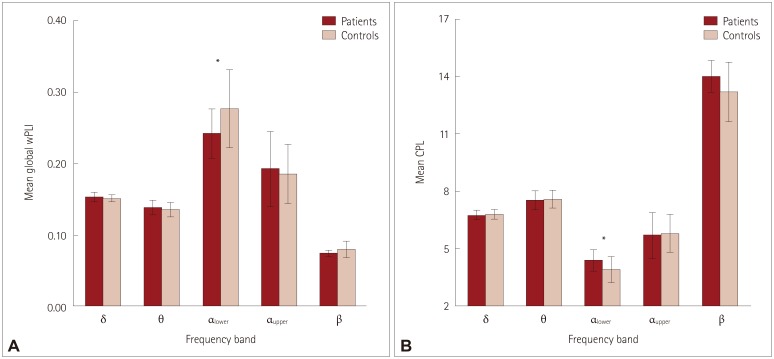 | Fig. 5Mean global wPLI values (A) and CPL of benign epilepsy with centrotemporal spikes patients and controls, with error bars indicating standard deviations. CPL: characteristic path length, wPLI: weighted phase lag index.
|
Table 1
Global wPLI, CPL, and CC for BECTS patients and controls in five frequency bands
![]()
Go to :
DISCUSSION
Differences in resting-state functional connectivity identified from normal waking EEGs
The purpose of this study was to reveal differences in connectivity between otherwise normal waking EEGs of BECTS patients and disease-free controls. Several differences were found by applying connectivity analysis to resting-state waking EEGs. Network topology aberrations were identified in the connectivity for the lower alpha band. Connectivity represented as a matrix of wPLI values between the nodes was decreased along certain edges, and the average wPLI was significantly lower for the lower-alpha-band connectivity. The resting-state connectivity of the BECTS showed less integration or lower efficiency. There were recognizable differences in the connectivity in the background waking EEGs of BECTS patients even though they appeared to be normal in routine visual inspections. These findings are concordant with previous reports of alterations of BECTS connectivity that were otherwise not identified in routine visual inspections.8919 Several studies have found differences in otherwise normal waking EEGs for focal epilepsy onset,20 patients and family members of idiopathic generalized epilepsies,21 and mesial temporal lobe epilepsy and frontal nocturnal epilepsy.22 These previous findings as well as the results of the present study suggest that EEG resting-state connectivity analysis can provide novel information that is otherwise not recognized in routine visual inspections. This additional information can help understand the pathophysiology of epilepsy and may be useful as a electrophysiological marker in both research and clinical practice. The electrophysiological biomarker identified in the connectivity analysis of BECTS can also be used in clinical decision-making in combination with centrotemporal spikes that last longer than clinical remission.
Decreased functional connectivity in BECTS patients
The association measure employed in this study was wPLI, which is a measure of phase synchronization. The comparisons of connectivity revealed consistently decreased connectivity in specific edges in the lower alpha and beta bands. We also revealed a significant decrease in the overall connectivity in the lower alpha band, as represented by a significantly lower global wPLI. This finding implies reductions in the synchronization of brain electrical activity between combinations of certain electrodes as well as global connectivity in BECTS patients compared to controls. A similar study that compared 11 patients with controls using lagged phase synchronization (LPS) as an association measure found that LPS was weaker in the beta band.19 Low-resolution electromagnetic tomography of the EEG functional connectivity showed that alpha-band functional connectivity was increased in 17 BECTS patients compared to 19 healthy controls.9 The conflicting results from different studies seem to arise from the use of different connectivity measures. In contrast to EEG studies, functional magnetic resonance image (fMRI) studies of BECTS have consistently found decreased connectivity between eloquent cortices.2324 Moreover, interhemispheric hyposynchrony was observed in a recent fMRI study,25 and a decreased EEG correlation has also been observed for focal epilepsy.26 The simultaneously application of multiple features revealed decreased functional connectivity in pediatric focal epilepsy.27 Combining our findings with those of previous studies (and especially fMRI studies) suggests that global connectivity is decreased in focal epilepsy such as BECTS. This decreased global connectivity in BECTS indicates the need for further research into the association between connectivity and functional deficits.
Resting-state functional connectivity of BECTS showed low global efficiency
The CPL, which is an integration measure of global network topology, was significantly longer for lower-alpha-band connectivity in BECTS. Since the global efficiency is expressed as an inverse to CPL, we can infer that the lower-alpha-band resting-state functional connectivity of BECTS is less integrated and less efficient. It is particularly interesting that this is a consistent finding of focal epilepsy connectivity. A recent systematic review of connectivity analysis in focal epilepsy concluded that increased CPL was a typical feature of the global topology in EEG studies.28 Increased CPL has also been revealed by studies of patients with focal epilepsy due to tumors293031 and temporal lobe epilepsy.32 Another study of focal epilepsy using fMRI also found increased CPL.33 Our finding adds BECTS as further evidence of increased CPL in focal epilepsy connectivity. Since CPL is a measure of integration, increased CPL corresponds to requiring more steps for parallel information transfer, low efficiency, and less integration. However, the clinical significance or consequence of this decreased efficiency is still unknown; for example, it could be related to global dysfunction due to epilepsy or a countermeasure against focal hyperexcitation and hypersynchrony. Further research regarding the functional efficiency and functioning of the brain should be performed to correctly and precisely understand the significance of network topology.
wPLI and the results from other studies
This is the first study to have applied the wPLI as an association measure for connectivity analysis in BECTS. The wPLI is a phase-based measure that has the advantages of a reduced sensitivity to volume conduction and the improved detection of changes in phase synchronization.15 This measure has shown good agreement with MEG connectivity findings for adults in the alpha band and was suggested to be a useful measure for connectivity analysis.34 Its reproducibility and reliability have been reported based on high-resolution EEG studies.35 However, the scarcity of applications of wPLI in epilepsy makes it difficult to determine the clinical consequences of the findings in this study beyond the general network topology. Connectivity studies using the wPLI are more popular in the fields of psychiatry and anesthesiology than in epilepsy. A study of mild cognitive impairment with type 2 diabetes found that decreased PLI values and increased CPL were related to cognitive impairment.36 Theta-band connectivity measures have been found to be related to dyslexia in children,37 and increased beta-band wPLI connectivity was observed in patients with generalized social anxiety disorder.38 The present findings provide further evidence for the usefulness of the wPLI in connectivity analyses of neurological disorders including epilepsy.
Analyzing the lower alpha band
Distinct band specificity was evident in the present restingstate connectivity results. When connectivity itself was compared, different edges showed varying degrees of increases or decreases in wPLI values in the delta and theta bands. However, in the lower alpha and beta bands, the difference was a consistently lower wPLI in BECTS. Likewise, the network topology measures (e.g., CPL) differed only in the lower alpha band. Activities up to 100 Hz can be measured using an EEG device with a sampling rate of 200 Hz, which allows a wide range of EEG activities to be recorded. It is crucial to select the appropriate frequency band for analysis.15 Notwithstanding the rare conditions where broadband analysis is helpful, band-specific analysis produces different findings according to the specific bands analyzed.394041 Most reports have been on connectivity changes in theta, alpha, and beta bands, with only rare reports on the delta band. The specific band to be selected can be recommended based on PSD graphs.15 It is reasonable to select the band of activity that is the most prominent in the EEG epochs. The PSD graphs of the patients and controls in the present study indicated that the activity was most prominent in the lower alpha band, and significant differences were identified between connectivity in the lower alpha and beta bands. This study provides further support for selecting the alpha and beta bands when analyzing pediatric epilepsy or pediatric EEG for connectivity analysis. It is also advisable to utilize the wPLI values in the alpha and beta bands for the further analysis of serial EEG connectivity in order to reveal changes following the disease course, and adding this marker for clinical decision-making.
Using routine EEG as a substrate for analysis
Unlike other studies that made EEG recordings separately in different research settings, we used EEGs obtained in the EEG laboratory of a single hospital. A major hurdle for EEG analysis is minimizing artifacts and ensuring that the system is in the resting state.1542 Performing EEG separately in a research setting might be less difficult for adult subjects. However, performing research in children is more difficult, and recruiting healthy controls is a significant obstacle to the success of any research. Individual artifacts can be removed using various methods, but there is always concern that the removal of an artifact could distort the original signal.43 By carefully selecting epochs with a stable resting state and avoiding artifacts in the analysis as much as possible, it should be possible to apply EEG resting-state connectivity analysis to routinely obtained clinical EEGs.
Limitations
As with all other association measures of EEG, the wPLI only represents and provides some of the information contained in an EEG signal. Each measure has its own limitations and strengths, and so it is necessary to combine different measures in order to collect as much information as possible when analyzing network connectivity and the network topology. Some of the present patients were given chloral hydrate for sedation, which could have affected the obtained results. This should be verified by further studies that do not involve sedation. We recruited disease-free controls rather than evaluating strictly normal controls. Recruiting normal controls separately and performing specific tests to recruit healthy controls could solve this potential limitation. The inability to link the findings in this study to the pathophysiology of BECTS or clinical significant findings is another limitation that should be resolved by further research, such as serial EEG connectivity analysis, combining the laterality of spikes, and neuropsychological testing to check cognitive functioning.
In conclusion, the EEG resting-state connectivity constructed using wPLI in BECTS patients differed from that in controls. Certain connections in the lower alpha and beta bands were consistently decreased. Global connectivity was decreased in the lower alpha band. The global network topology showed less integrated and less efficient connections in BECTS patients compared to in the controls. Even though the waking EEG without centrotemporal spikes had no abnormalities, it showed connectivity aberrations that were not recognized in the routine EEG analysis. This difference in resting-state connectivity could be a candidate electrophysiological biomarker along with centrotemporal spikes.
Go to :
 XML Download