

 PDF
PDF ePub
ePub Citation
 Print
Print


INTRODUCTION
Pediatric emergency departments (PED-EDs) are mainly visited by pediatric patients younger than 18 years who have a variety of ailments. However, at tertiary medical institutions where subspecialties are well established, transient patients (age, 18–21 years) and adult patients (older than 21 years) often also present to the PED-ED.12 Most of these patients are diagnosed with chronic refractory pediatric diseases during childhood and so have often received treatment in pediatric departments.123 Transient and adult patients (TAPs) present to the PED-ED because they are accustomed to receiving treatment for their long-term diseases that developed during childhood in such a department.4 Because these patients are older than 18 years, it would seem that they should be treated in the adult emergency department instead. However, because they wish to continue receiving care in a familiar setting, TAPs with refractory pediatric diseases often present to the PED-ED in emergency situations.5678
The proportion of TAPs examined in pediatric departments is particularly high in the neurology, hematology-oncology, cardiology, and genetics areas.9 This is due to many diseases being first treated in these departments during childhood, and the clinical progression of these diseases tends to be chronic and complex.91011 Additionally, because these diseases begin during childhood, continuing developmental and emotional interventions by medical staff in these departments are important for TAPs and should be maintained even after they become older.1212 Disease etiologies are often genetic in the pediatric neurologic area, and the course of these diseases can significantly impact their outcomes. TAPs with neurologic diseases (N-TAPs) often present to the PED-ED, and so pediatric neurologists need to be prepared to treat them.10
Some studies have investigated TAPs presenting to the PED-ED, but they have produced few data.23 Furthermore, epidemiologic studies of N-TAPs presenting to PED-EDs are even less common.156 Pediatric neurologists need to understand the characteristics of N-TAPs in order to be able to provide them with the best medical management. We investigated the characteristics of N-TAPs and pediatric patients with neurologic diseases (N-PEDs) who presented to the PED-ED of a tertiary-care hospital in Korea.
Go to : 
METHODS
Inclusion of patients and data collection
This was a retrospective study conducted using data from the PED-ED of a single tertiary-care center (Gangnam Severance Hospital). We reviewed the medical records of 34,439 patients who presented to the PED-ED from 2013 to 2017. We then selected patients with neurologic symptoms and those who had been treated in the pediatric neurology department and subsequently underwent neurologic evaluations and treatment in the PED-ED. This study enrolled 2,315 patients, with patients younger than 18 years categorized as N-PEDs and those 18 years or older categorized as N-TAPs. This study was approved by the Institutional Review Board of Gangnam Severance Hospital, and all study participants provided informed consent (approval no. 3-2017-0263).
Study design: subgroup analyses
The primary goal of this study was to compare N-TAPs and N-PEDs. We analyzed certain subgroups of N-TAPs and N-PEDs and made comparisons between admitted and discharged N-TAPs and N-PEDs in order to identify the patient characteristics associated with hospitalizations and discharges.
Demographics and variables used in the analysis
The medical records of N-TAPs and N-PEDs were examined carefully. Patient demographics and variables such as age, sex, time of presentation (year), route of entry to the PED-ED, main symptom, severity level, main diagnosis at the time of the presentation, hospitalization status, and insurance status were identified. We used the Korean Triage and Acuity Scale (KTAS) to quantify the severity levels of the patients.13 Triage severity was defined by the following KTAS scores: 1) need for resuscitation, 2) emergency, 3) urgent, 4) less urgent, and 5) nonurgent. We classified the patients into two groups (neurologic and systemic) based on the diagnosis that was most relevant to their health status at the time of presenting to the PED-ED. There are several types of health-care insurance in South Korea, including the National Health Insurance Service, which covers almost the entire population, and Medical Aid, which is a public assistance program for poor or physically disabled individuals.1415 We therefore also investigated the distribution of medical insurance types among the neurologic patients who presented to the PED-ED.
Statistical analysis
All analyses were performed using SPSS (version 20.0, IBM Corp., Armonk, NY, USA). The descriptive statistics included means, standard deviations, medians, and ranges. The chisquare test, Fisher's exact test, and parametric t tests were used to evaluate differences between groups, with p<0.05 considered statistically significant.
Go to :
RESULTS
Clinical characteristics of neurologic patients who presented to the PED-ED
Table 1 presents the clinical characteristics of the 2,315 neurologic patients who presented to the PED-ED from 2013 to 2017. Patients aged 2 to 5 years accounted for the largest proportion (32.9%), and N-TAPs accounted for 2.4% of all patients. The median age of the patients was 5 years (range, birth to 41 years). The sex ratio was 58.1:41.9 (males:females). The total number of patients who presented to the PED-ED during the 5-year observation period decreased over time. Direct presentations were the most frequent method of entry to the PED-ED (90.0%). Febrile seizures, headaches, and afebrile seizures were the main symptoms (80.8%) for all patients. The most-frequent severity level was grade 3 (n=1,713, 74.0%), and the severity levels of the patients conformed to a normal distribution.
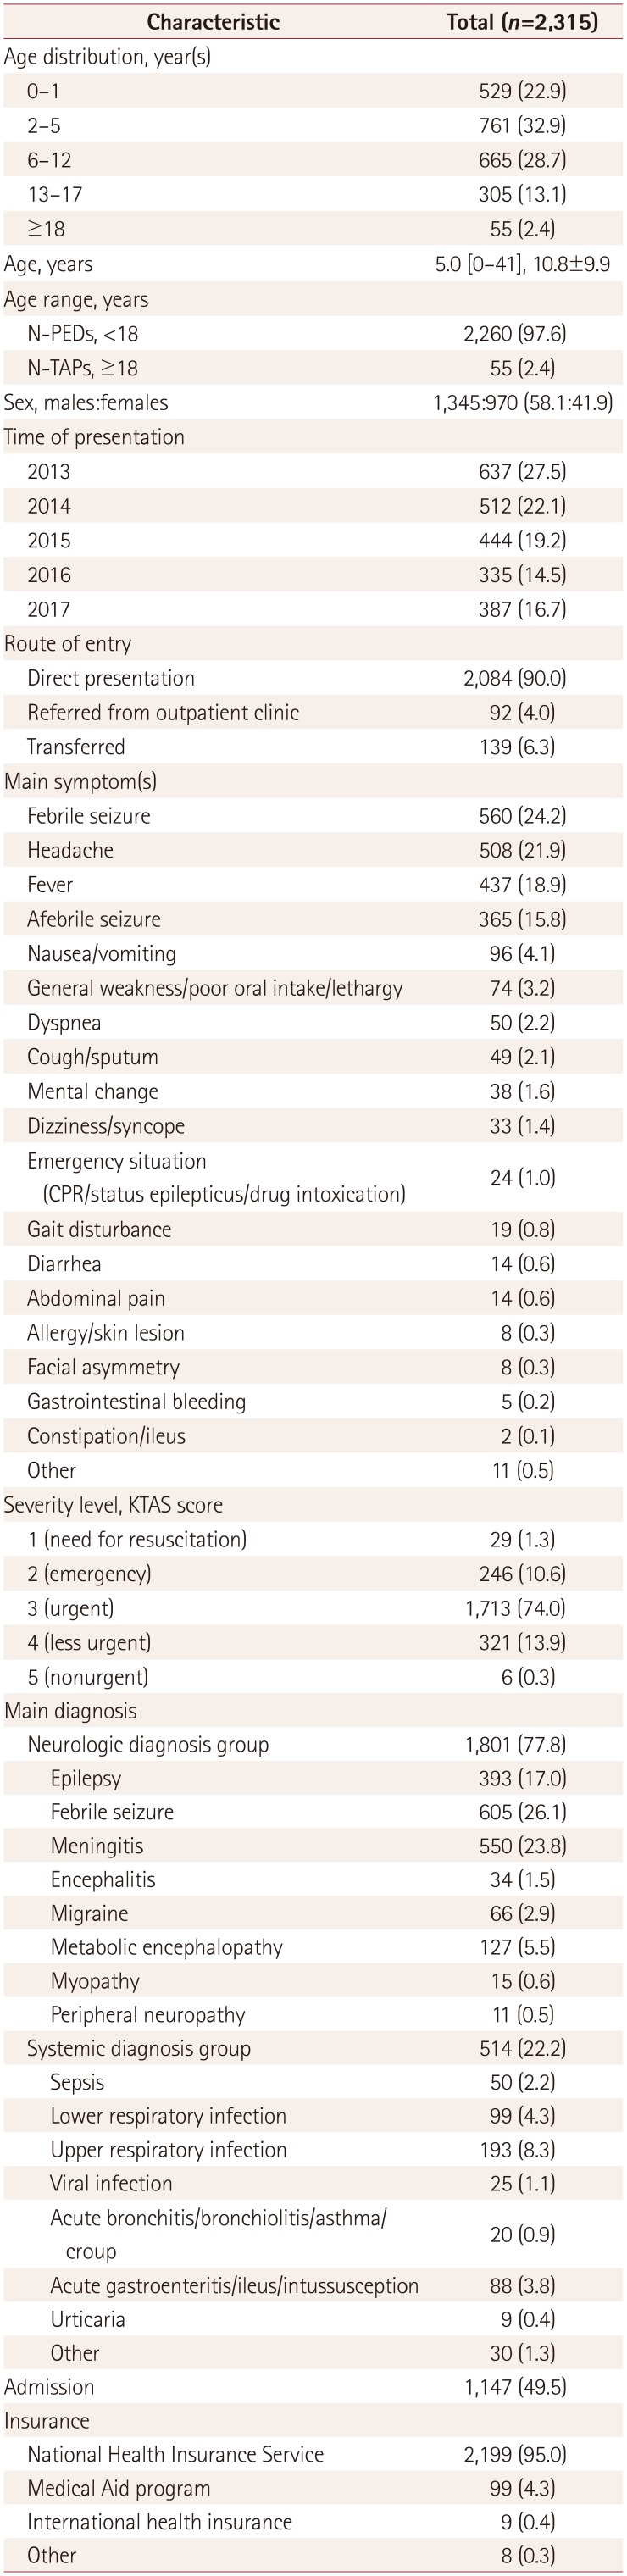
Table 1
Clinical characteristics of neurologic patients who presented to the PED-ED from 2013 to 2017
![]()
The neurologic diagnosis group (n=1,801, 77.8%) comprised patients with febrile seizures (n=605, 26.1%), meningitis (n=550, 23.8%), epilepsy (n=393, 17.0%), and other symptoms. Upper respiratory infections (n=193, 8.3%), lower respiratory infections (n=99, 4.3%), acute gastroenteritis/ileus/intussusception (n=88, 3.8%), and sepsis (n=50, 2.2%) were the main diagnoses for those in the systemic diagnosis group (n=514, 22.2%). The hospitalization rate for patients who presented to the PED-ED was 49.5%, and most of them were insured by the National Health Insurance Service (n=2,199, 95.0%).
Characteristics of neurologic patients in the PED-ED: admission and discharge
Of all the patients, 1,147 were hospitalized and 1,168 were discharged (Table 2). The annual age distribution differed significantly between the admission and discharge groups (p<0.001). N-TAPs were represented more in the admission group. The annual decrease in the number of patients was significantly larger in the admission group than in the discharge group (p<0.001). The distribution of the route of entry to the PED-ED differed significantly between the admission and discharge groups, with more patients referred from outpatient clinics or transferred from other locations in the admission group. The main symptoms also differed significantly between the two groups, with severity levels of 1 (need for resuscitation) and 2 (emergency) being significantly more common in the admission group than in the discharge group. A systemic diagnosis as the primary diagnosis was also significantly more common in the admission group than in the discharge group (31.6% vs. 12.9%, p<0.001). The proportion of patients who received insurance through the Medical Aid program was significantly higher in the admission group than in the discharge group (p<0.001).
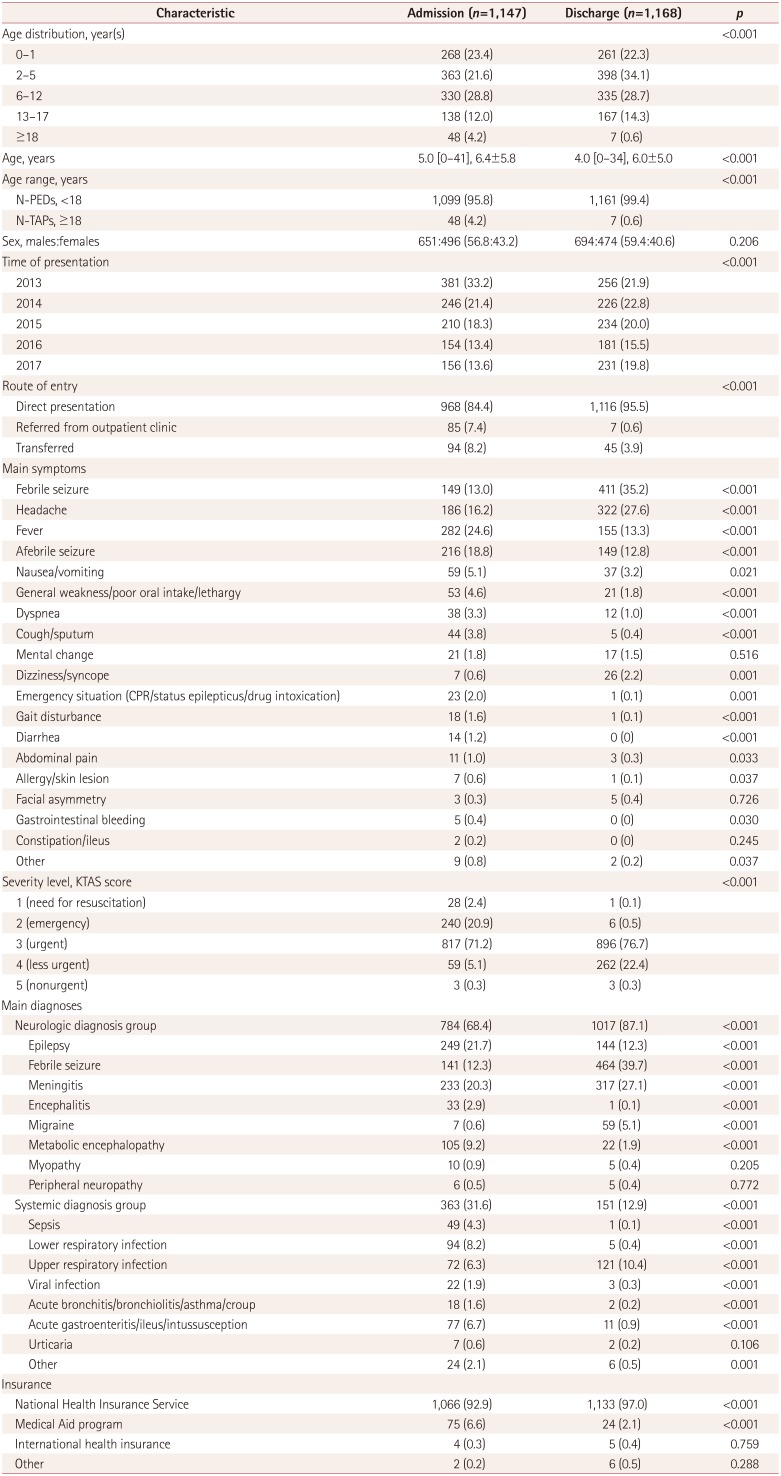
Table 2
Comparison of clinical characteristics between admitted and discharged neurologic patients presenting to the PED-ED
![]()
Characteristics of neurologic patients in the PED-ED: N-TAPs and N-PEDs
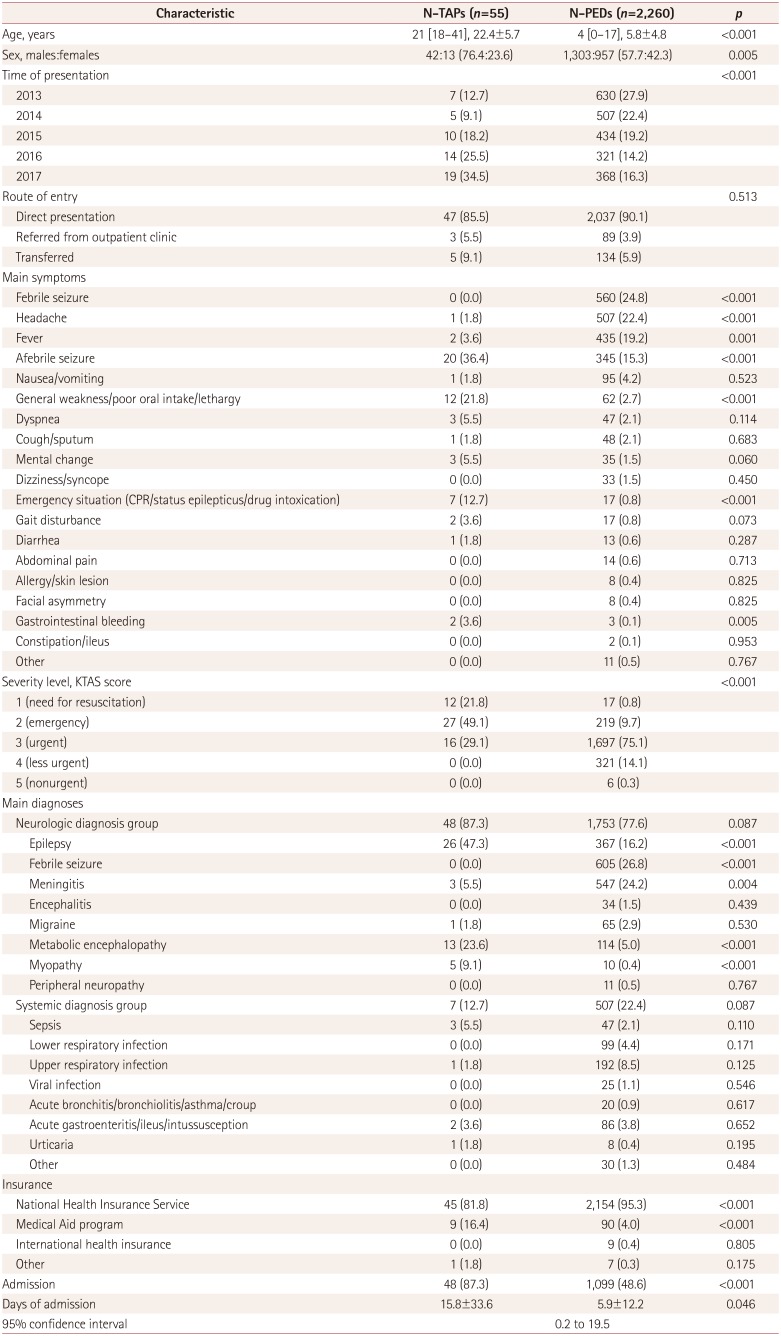
The proportion of boys was significantly higher in the N-TAP group than in the N-PED group (76.4% vs. 57.7%, p=0.005) (Table 3). Presentations to the PED-ED by N-TAPs increased over time, whereas those by N-PEDs gradually decreased, with a significant difference between the groups (p<0.001) (Fig. 1). In particular, presentations by N-TAPs almost tripled from 2013 to 2017. The severity level was higher and the main symptoms were more severe in N-TAPs than in N-PEDs. The severe main symptoms comprised afebrile seizures, general weakness, poor oral intake, lethargy, and other emergency situations. The proportion of patients with febrile seizures, headaches, and seizures was significantly higher for N-PEDs. No N-TAPs had a KTAS severity score of 4 or 5 (Fig. 2). N-TAPs seemed to be more likely than N-PEDs to have underlying primary neurologic diagnoses, but the difference was not statistically significant (p=0.087). Epilepsy and metabolic disease were significantly more common among N-TAPS than among N-PEDs (p<0.001 for both), while febrile seizures and meningitis were significantly more common among N-PEDs (p<0.001 for both). The proportion of patients insured by the Medical Aid program was significantly higher among N-TAPs than among N-PEDs (p<0.001). The admission rate was higher (p<0.001) and the mean length of hospital stay was longer (p=0.046) for N-TAPs than for N-PEDs.
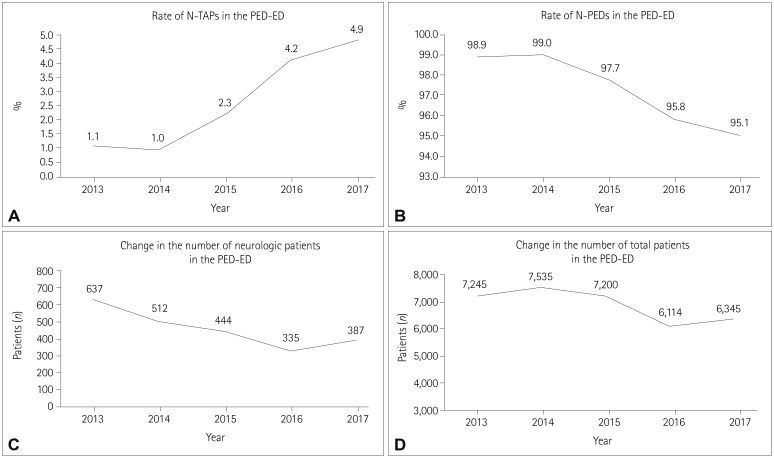 | Fig. 1Changing rates of N-TAPs and N-PEDs presenting to the PED-ED. Yearly changes in the numbers of N-TAPs, N-PEDs, neurologic patients, and total patients in the PED-ED. A: The number of N-TAPs steadily increased, and the proportion of N-TAPs presenting to the PED-ED more than quadrupled from 2013 to 2017. B: Unlike N-TAPs, the proportion of N-PEDs presenting to the PED-ED is steadily declining. C: Yearly changes in neurologic patients presenting to the PED-ED (both N-TAPs and N-PEDs). Neurologic patients presenting to the PED-ED show a gradually declining trend. D: Annual change in total patients presenting to the PED-ED. The total number of PED-ED patients is declining. N-PEDs: pediatric patients with neurologic diseases, N-TAPs: transient and adult patients with neurologic diseases, PED-ED: pediatric emergency department.
|
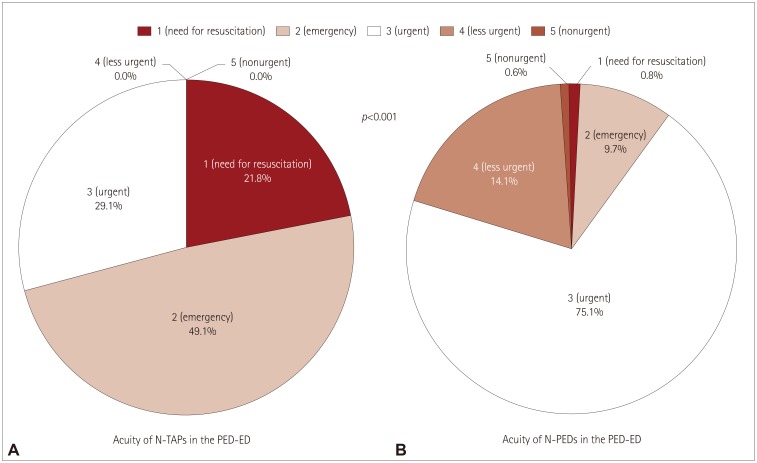 | Fig. 2Difference in severity levels (KTAS scores) between N-TAPs and N-PEDs. Comparison of the severity of disease in N-TAPs and N-PEDs based on KTAS scores. A: Severity distribution for N-TAPs presenting to the PED-ED. B: Severity distribution for N-TAPs presenting to the PED-ED. Overall, the N-TAPs presenting to the PED-ED had a higher severity level. The distributions in (A) and (B) were statistically significant. KTAS: Korean Triage and Acuity Scale, N-PEDs: pediatric patients with neurologic diseases, N-TAPs: transient and adult patients with neurologic diseases, PED-ED: pediatric emergency department.
|
Table 3
Comparison of the clinical characteristics of N-TAPs and N-PEDs presenting to the PED-ED
![]()
Characteristics of N-TAPs presenting to the PED-ED: admission and discharge
There were 55 N-TAPs, of which 48 were in the admission group and 7 were in the discharge group (Table 4). The proportion of boys was much higher in the admission group than in the discharge group (81.3% vs. 42.9%, p=0.046). The route of entry or main symptom did not differ significantly between the two N-TAPs groups. However, there was a significant intergroup difference (p=0.02) in the distribution of severity levels, with 25% of those in the admission group requiring resuscitation. However, no patient in either group had a severity level of 4 or 5. There was no statistically significant difference in the main diagnosis or insurance status between the two groups.
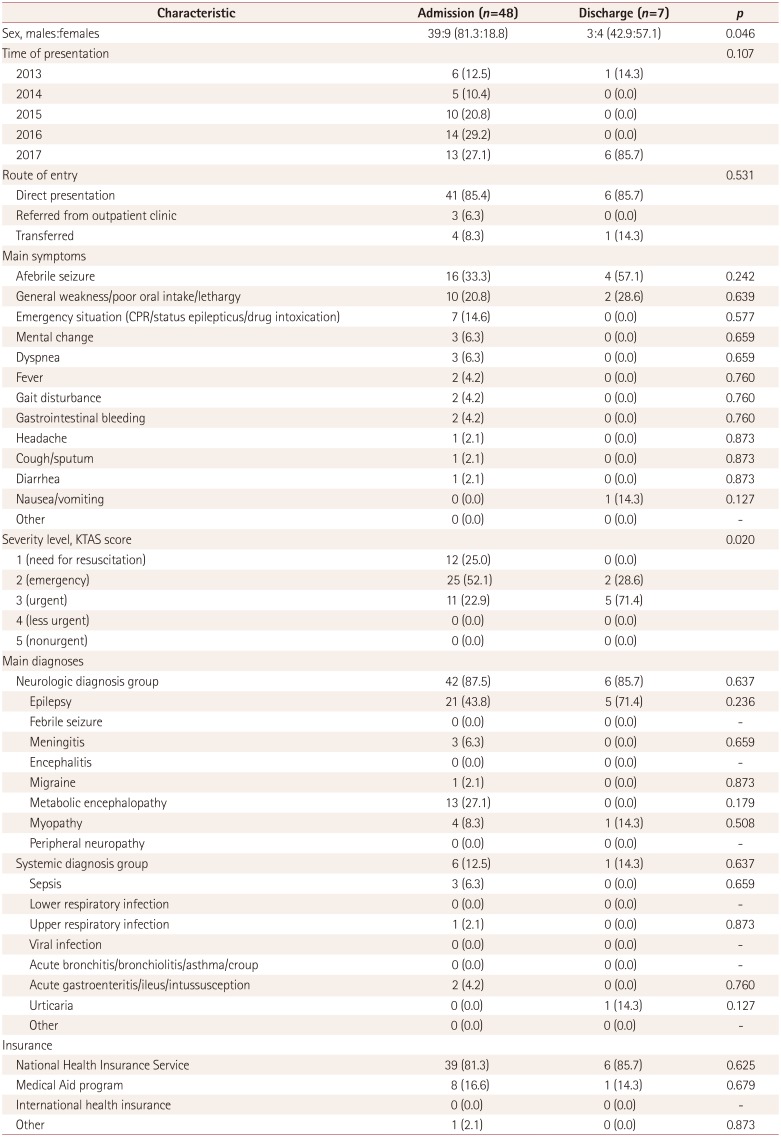
Table 4
Comparison of clinical characteristics of admitted and discharged N-TAPs presenting to the PED-ED
![]()
Characteristics of N-PEDs presenting to the PED-ED: admission and discharge
The age distribution of N-PEDs was statistically identical in the admission and discharge groups during the 5-year study period (Table 5). The numbers of patients in both groups decreased over time, with the decrease being significantly greater in the admission group than in the discharge group (p<0.001). Regarding the route of entry to the PED-ED, being referred from outpatient clinics or transferred from other locations was significantly more common in the admission group (p<0.001).
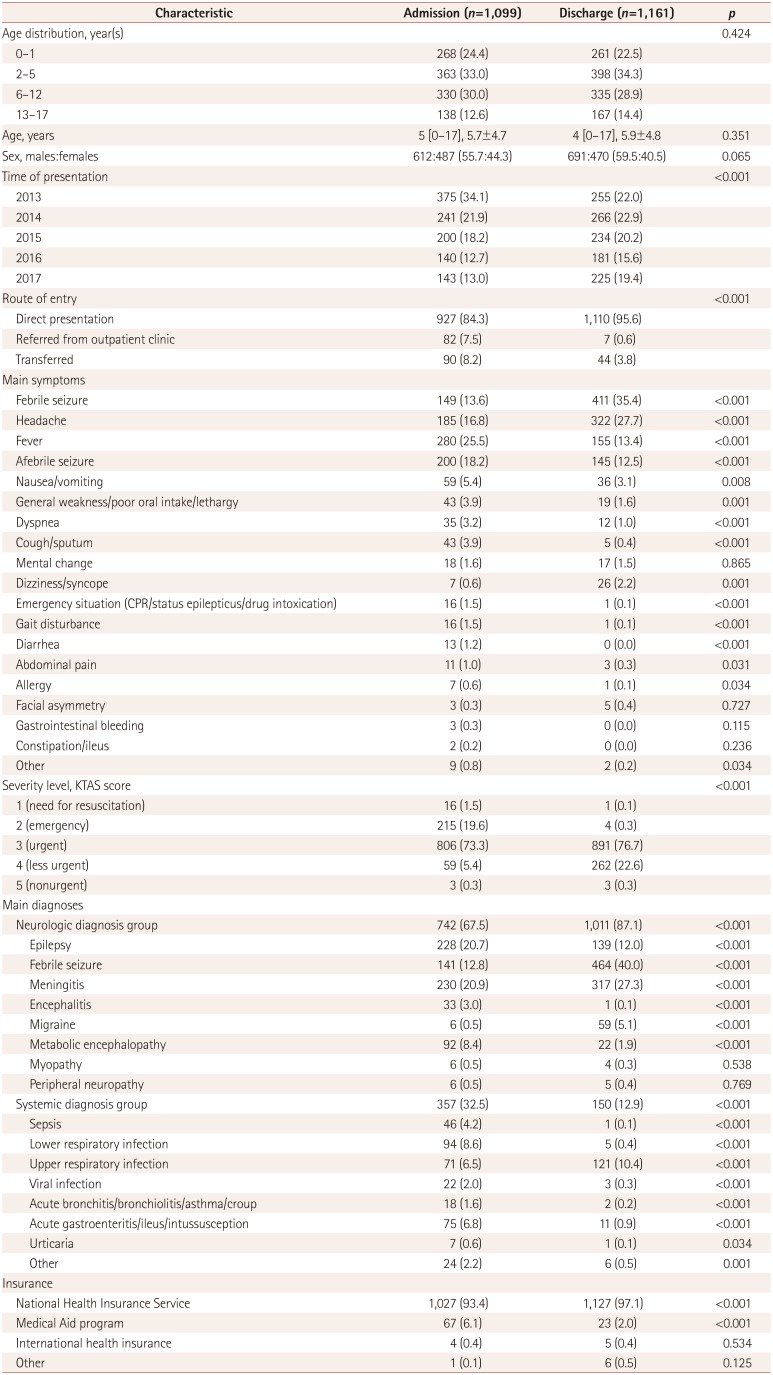
Table 5
Comparison of clinical characteristics of admitted and discharged N-PEDs presenting to the PED-ED
![]()
In terms of the main symptoms, there were significantly more patients with fevers, afebrile seizures, and nausea/vomiting in the admission group than in the discharge group, whereas febrile seizures, headaches, and dizziness/syncope were significantly more common in the discharge group. The proportion of patients with severity levels of 1 and 2 was significantly higher in the admission group (p<0.001). There was a strong tendency for the underlying systemic diagnosis to be the main symptom in the admission group, and these patients generally had a larger number of separate diagnoses compared to those in the discharge group. Significantly more patients in the admission group were insured by Medical Aid (p<0.001).
Underlying diagnoses of N-TAPs in the PED-ED
There were 6 diagnoses among the 55 N-TAPs who presented to the PED-ED during the 5-year study period (Table 6): epilepsy, neurometabolic diseases, muscular dystrophy, spinal atrophy, meningitis, and migraine. Epilepsy was the mostcommon condition (n=26, 47.3%), followed by neurometabolic disease (n=17, 30.9%). The cause of symptoms was known for 12 patients in the epilepsy group: complications of hypoxic ischemic encephalopathy (n=6, 10.9%), central nervous system infection (n=3, 5.5%), and central nervous system malformation (n=3, 5.5%); the causes of symptoms were unknown for the other 14 patients. In the neurometabolic disease group, mitochondrial encephalomyopathy, lactic acidosis, and stroke-like episodes (n=7, 12.7%), Leigh syndrome (n=3, 5.5%), and Kearns-Sayre syndrome (n=1, 1.8%) accounted for most of the diagnoses, with the cause being unknown for 14 patients in the neurometabolic category.
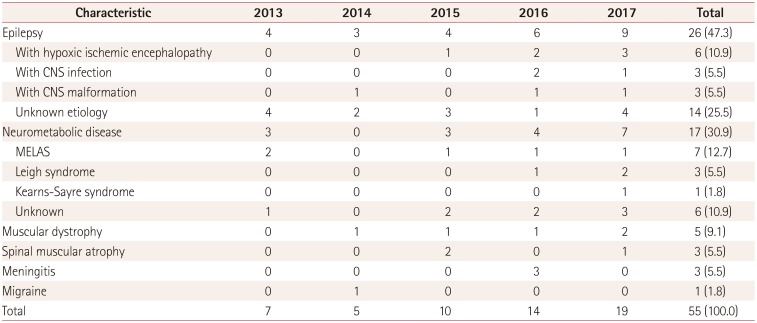
Table 6
Underlying diagnoses of N-TAPs who presented to the PED-ED from 2013 to 2017
![]()
Go to :
DISCUSSION
Several previous studies have found that TAPs comprise 0.9–4.0% of all patients presenting to the PED-ED, and that their numbers and proportions are increasing.2391116171819 Some studies have shown that the underlying diseases of TAPs are becoming increasingly diverse.39 However, few studies have investigated the trends and characteristics of N-TAPs, who represent a major proportion of the patients presenting to the PED-ED. The present study was prompted by pediatric neurologists noticing some changes in the number of N-TAPs who presented to the PED-ED while they were undergoing medical care, and so we investigated some of these changes and the characteristics of these patients.
The number of PED-ED presentations by N-TAPs steadily increased during the 5-year study period. There was a three-fold increase in the number and a nearly fourfold increase in the proportion of N-TAPs presenting to the PED-ED from 2013 to 2017 (Fig. 1A and B). This could have been due to differences in medical situations, including differences in the most-abundant subgroup of TAPs presenting to the PED-ED. However, there is a growing body of evidence that N-TAPs have a major effect on the overall number of TAPs presenting to the PED-ED.91216 This should be important to pediatric neurologists due to increasing numbers and proportions of N-TAPs presenting to the PED-ED. However, the decreased number of children being born in Korea due to decreased fertility rates is resulting in a downward trend in the overall number of PED-ED patients (Fig. 1C and D).20 It is therefore possible that these findings are also applicable to other countries with low fertility rates.21
We performed a comparative analysis of N-PEDs to elucidate the characteristics of N-TAPs presenting to the PED-ED. N-TAPs have greater disease/symptom severity, higher hospitalization rates, longer hospital stays, and greater use of the Medical Aid insurance program compared to N-PEDs (Table 3, Fig. 2). The characteristics of N-TAPs found in this study are supported by several other studies. Camfield and Camfield.1 concluded that in cases of epilepsy, which accounts for many of the neurologic conditions observed in the PED-ED, if the disease is severe and persists beyond the age of 15–20 years, the risk of sudden unexpected death may increase. Similarly, Wakamoto et al.6 suggested that the mortality rate is higher for adult than pediatric patients with childhood-onset epilepsy. The finding of high severity levels of N-TAPs in these studies is consistent with the results of the present study, suggesting that caution is required when treating N-TAPs in the PED-ED. Moreover, N-TAPs tended to have a lower socioeconomic status in some cohort studies performed in Canada, Finland, Japan, and Germany.1619 Those findings and the results of the present study highlight the need for PED-ED practitioners to understand the different socioeconomic situations of their patients so that they can ensure that they have the social skills required to care for N-TAPs.
The proportion of N-TAPs who presented to the PED-ED with an underlying primary neurologic disorder was higher than that of N-PEDs. Therefore, presenting to the PED-ED with underlying neurologic disorders was more likely among N-TAPs rather among N-PEDs. However, this difference was not statistically significant (p=0.087), and hence further observations are needed to confirm the real situation. We suggest that support focusing on neurologic disease is necessary in the PED-ED due to the high hospitalization rates of N-TAPs who present for treatment. A recent study by Michihata et al.22 of the primary diagnoses of adult patients in a pediatric department may support the concept that clinicians should focus more on disease-oriented care—rather than age-oriented care—when treating N-TAPs.
To gain a better understanding of N-TAPs, we performed a comparative analysis of N-TAPs and N-PEDs among the admitted and discharged patients (Table 4 and 5). It was hypothesized that N-TAPs tend to be homogeneous because no significant difference was found in the other variables; however, the severity level of admitted patients was higher than that of discharged patients. Furthermore, admitted N-PEDs accounted for a higher percentage of almost all of the aforementioned main symptoms. In addition, because the rate of a systemic diagnosis was significantly higher in the admitted patients than in the discharged patients, N-PEDs appeared to be heterogeneous regardless of whether they were admitted. Our comparison of the characteristics of admitted N-TAPs and N-PEDs revealed that N-TAPs might have disease-specific associations rather than main symptoms at the time of presentation to the PED-ED. Therefore, the underlying neurologic characteristics should be considered when N-TAPs present to the PED-ED.
We investigated the underlying neurologic diseases of 55 N-TAPs (Table 6). Epilepsy and neurometabolic disease were the most-common diagnoses, which is probably due to recent medical advancements including new neurologic drugs significantly improving the survival rates of these patients; in other words, these patients are able to live past childhood and then present to the PED-ED during adulthood for treatment. In addition, the increased survival rates and the development of diagnostic technology—along with the increasing focus on treating pediatric neurologic and rare diseases—mean that these diseases can be diagnosed and have become treatable. Therefore, the increase in neurometabolic disease rates among N-TAPs is the result of precision medicine, and this trend for N-TAPs is expected to continue.17817
Epilepsy is characterized by a wide variety of clinical manifestations, and neurometabolic disease is accompanied by a wide range of neurologic symptoms that often result in new symptoms developing during adulthood. Some researchers have suggested that pediatric neurologists should focus on other chronic neurologic diseases that were not considered in this study, such as tuberous sclerosis complex, Rett syndrome, Dravet syndrome, and autism/autistic spectrum disorder.17 However, there has been a general lack of interest in transition patients such as N-TAPs, resulting in insufficient resources for transitional health care such as pathophysiology, appropriate drug dosage, and emotional care for N-TAPs. Neurologic diseases can have long-term effects on the physical health, mental health, and social activities of N-TAPs. Therefore, in addition to treating the disease itself, pediatric neurologists should develop long-term care plans for N-TAPs that include multidisciplinary care by pediatric psychiatrists and pediatric psychologists.
Despite our research being limited by the small number of patients, we have been able to draw clear conclusions about the status of N-TAPs in the PED-ER and the role of pediatric neurologists in treating and managing this patient population. N-TAPs show a trend of rapidly increasing presentations to the PED-ED for treatment. Therefore, appropriate medical care is required for adult patients with pediatric-oriented diseases who not only present to the PED-ED but also present to medical departments and intensive-care units.2223 Improving the quality of life and long-term survival of TAPs requires an accurate understanding of the natural course of their underlying diseases and the ability to apply this knowledge systematically in PED-EDs, medical departments, intensive-care units, and outpatient departments. In addition, pediatric neurologists need to be familiar with medication dosages for adults and the pathophysiology of TAPs, which may differ from that of children, in order to be able to effectively treat N-TAPs.24 Pediatric neurologists should consider the emotional upset that can occur in situations when N-TAPs receive adult care, and be able to help with natural bridging to adult care.
The mental development of TAPs must be considered by pediatric neurologists, which requires multidisciplinary care by pediatric psychiatrists and pediatric psychologists. A formal and gradual transition process from pediatric to adult health-care services should be established via long preparation periods, cooperation between health-care professionals, and education of patients regarding self-management and self-monitoring.2526 Because N-TAPs comprise a major proportion of TAPs, a plan of care needs to be established for them through further epidemiologic studies.
Go to :
 XML Download